Document level assessment of document retrieval systems in a pairwise system evaluation
Prabha Rajagopal. Sri Devi Ravana, Harshit Srivastava and Masumeh Sadat Taheri
Introduction. The use of averaged topic-level scores can result in the loss of valuable data and can cause misinterpretation of the effectiveness of system performance. This study aims to use the scores of each document to evaluate document retrieval systems in a pairwise system evaluation.
Method. The chosen evaluation metrics are document-level precision scores against topic-level average precision (AP) scores, and document-level rank-biased precision scores against topic-level rank-biased precision at cut-off k (k=100) scores.
Analysis. An analysis of the results of paired significance tests with the use of document-level and topic-level scores are compared to determine the agreement in the obtained numbers of statistically significant information retrieval system pairs.
Results. The experiment results at document-level are an effective evaluation unit in the pairwise evaluation of information retrieval systems, with higher numbers of statistically significant (p=0.01) system pairs, compared with the topic-level results and a high percentage of statistically significant agreement with topic-level.
Conclusion. This study presents an original viewpoint on measuring the effectiveness of document retrieval systems through pairwise evaluation by using document-level scores as a unit of evaluation in the significance testing instead of the traditional topic-level scores (which involve averaging document scores).
Introduction
Information retrieval indicates the retrieval of unstructured records consisting mainly of free-form natural language text (Greengrass, 2001). Unstructured records are documents without specific format for the information being presented. Information on the Web grows continuously making it impossible to access the information without the help of search engines (Tsytsarau and Palpanas, 2012) or retrieval systems. When information is aggregated from multiple sources such as in virtual documents (Watters, 1999), retrieval becomes complicated, and solutions such as sentiment analysis and opinion mining are incorporated in traditional retrieval systems (Tsytsarau and Palpanas, 2012). Ideally, the main target of the retrieval system is to provide information that is as accurate as possible and relevant to the user, based on the user’s query.
System-based evaluation is one of the main categories of information retrieval evaluation and has been widely used. It focuses on measuring system effectiveness in a non-interactive laboratory environment (Ravana and Moffat, 2010), which involves a shorter experimentation time and is more cost-effective compared with other information retrieval evaluation techniques.
The effectiveness of information retrieval systems is measured by using relevant documents obtained by a retrieval system to meet users’ queries. The relevancy of the retrieved ranked documents is unknown until assessed or judged by experts or crowd-sourced judges. However, the retrieval system itself needs to be evaluated to determine its performance. System effectiveness can be assessed by using evaluation measures, including, but not limited to, the following: precision at cut-off k, (P@k) (Joachims, Granka, Pan, Hembrooke, and Gay, 2005), average precision (AP) (Buckley and Voorhees, 2000), normalised discounted cumulative gain (NDCG) (Järvelin and Kekäläinen, 2002) and rank-biased precision (RBP) (Moffat and Zobel, 2008).
Ranking the systems based on their effectiveness scores allow us to determine the superiority of the performance of one system over those of other information retrieval systems. An alternative way to determine the performance of a system is to do pairwise system comparisons. In a pairwise system comparison, a system is compared with two or more other systems. All comparisons use standard test collections, topic sets and relevance judgments. Generally, average topic scores using mean average precision (MAP) from fifty topics are used to quantify the overall system effectiveness in Text REtrieval Conference (TREC) (Smucker, Allan and Carterette, 2007, 2009; Urbano, Marrero and Martín, 2013). System evaluation is then done by using paired significance tests to determine the number of system pairs that are statistically significant.
Significance tests investigate whether the observed differences between pairs of systems are likely to be intrinsic or by chance. It is common to use the results for individual topics as the indivisible unit of measurement in statistical testing (Jayasinghe, Webber, Sanderson, Dharmasena and Culpepper, 2015; Robertson and Kanoulas, 2012). The current method of using topic scores results in loss of document scores when score averaging or cut-offs are performed. In this research, we propose the use of document-level precision and rank-biased precision scores of top k documents per topic between system pairs, instead of topic-level scores, to determine statistical significance.
An example of using document-level scores and topic-level scores is shown in Table 1 below. Let’s assume column A and B are the retrieved documents’ relevancy from same topic from two different systems, Sys1 and Sys2. The columns adjacent to columns A and B are the respective precision scores, also means document-level scores. The p-value resulting from a paired significant test between document-level scores (from rank 1 to 5) is 0.1. Similarly, assuming column C and D are another set of same topic from systems, Sys1 and Sys2. The p-value is 0.09. From these significant tests output, both the systems can be concluded as significantly different (assuming p-value <= 0.1). The usual method of using topic-level scores in paired significant test using the average precision scores (between scores 0.2, 0.04 and 0.4,0.1) of both the systems result in p-value of 0.3. This indicates the two systems are not significantly different (assuming p-value <=0.1).
| Rank | Sys1 | Sys2 | Sys1 | Sys2 | ||||
|---|---|---|---|---|---|---|---|---|
| ColumnA | precision | ColumnB | precision | ColumnC | precision | ColumnD | precision | |
| 1 | NR | 0 | R | 1 | NR | 0 | NR | 0 |
| 2 | R | 0.5 | R | 1 | NR | 0 | R | 0.5 |
| 3 | NR | 0.3 | NR | 0.7 | NR | 0 | NR | 0.3 |
| 4 | R | 0.5 | NR | 0.5 | NR | 0 | NR | 0.25 |
| 5 | NR | 0.4 | NR | 0.4 | R | 0.2 | NR | 0.2 |
| AP | 0.2 | 0.4 | 0.04 | 0.1 | ||||
By measuring the effectiveness of systems at the document-level, valuable document scores are used as a measure of effectiveness in the pairwise system evaluation.
In this paper, the following conjectures are addressed:
- Individual document-level scores, instead of topic-level scores, can be used as a pairwise system evaluation unit for information retrieval systems.
- Compared with significance tests using topic-level scores, system evaluations produce higher numbers of statistically significant system pairs when document-level scores are used.
Through experimentation, the aims of this study were met, as shown by the results of the significance tests. This paper is organized as follows. First, it provides details about related metrics, followed by significance testing, aggregating p-values and previous related studies. Next, the methodology and experimentation are discussed in detail. Finally, the results, discussions and conclusions are drawn.
Information retrieval evaluation tool and metrics
The following subsections describe the details of suitable metrics to evaluate the effectiveness of systems, significance testing to determine the true difference between the paired systems, and the aggregation of multiple p-values from multiple topics to produce a single p-value for comparison with the topic-level significant test.
Metrics
Precision and recall are the two basic information retrieval metrics. Precision measures the fraction of documents that are relevant to the query among all the returned documents, whereas recall is defined as the ratio of relevant items retrieved to all relevant items in the file. Due to a large number of documents, pooling (i.e., top 100 documents from selected system runs will be judged by experts) is incorporated before generating relevance judgments in TREC. A system that returns relevant documents earlier in the retrieval process will have a better performance compared with a system that retrieves relevant documents later or at lower rankings. The effectiveness of a system could also be measured by using precision at cut-off k, in which the total number of relevant documents is not required. However, among the commonly used evaluation measures, this is the least stable (Manning and Raghavan, 2009; Webber, Moffat and Zobel, 2010) and does not average very well across topics. Precision at cut-off k is regarded as an unstable measure because small changes in the ranking can cause big influence in the score, while large changes in the ranking can cause no change in the score. Another reason for regarding precision at cut-off k as unstable is because a constant cut-off represents widely varying user experiences, depending on the number of relevant documents for the query.
Average precision (AP) is computed by averaging the precision scores of each document per topic. Average precision is top-weighted because a relevant document in position 1 contributes more to the effectiveness score than one at position 2 and so on down the ranking. The top-weightiness is considered an advantage of average precision (Sakai and Kando, 2008). In addition, stability and discriminative power of average precision are considered as one of the best after normalized discounted cumulative gain (Shi, Tan, Zhu and Wu, 2013). In our experiment, the use of average precision as a baseline comparison at the topic-level is deemed suitable compared to precision at cut-off k due to the lack of stability and averaging ability of the latter. Average precision is also widely accepted in TREC (Webber, Moffat and Zobel, 2010) and is a commonly used metric for system effectiveness (Robertson, Kanoulas and Yilmaz, 2010). The irrelevant documents contribute to lower the precision scores at the ranks of the relevant documents in the average precision model. The irrelevant document contributes a score of 0 due to its irrelevancy, instigating to lower the effectiveness score. For example, a topic has the following ranked documents’ relevancy, {R R R NR NR}. Up to rank 3, the average precision is 1. At rank 5, the two non-relevant documents contribute to lower the average precision to 0.6.
On the other hand, rank-biased precision (RBP) is a rank-sensitive metric that uses parameter p as a measure of user persistence, that is, the probability that a user, having reached any given point in the ranked document list returned by the system, will proceed to the next rank (Moffat and Zobel, 2008). When p = 0.0, it is assumed that the user is either satisfied or dissatisfied with the top-ranked document and would not look further down the list of retrieved documents. It is assumed that the user would look through many documents before ending the search task as p approaches 1.0.
Significance testing
A significance test is a statistical method based on experimentation data that is aimed at testing a hypothesis (Kulinskaya, Morgenthaler and Staudte, 2014). It is used to show whether the comparative outcome attained between a pair of systems could have arisen by chance rather than intrinsically. The statistical test also shows confidence in the results obtained (Baccini, Déjean, Lafage and Mothe, 2012). The three commonly used statistical significance tests are paired Student’s t-test, Wilcoxon signed-rank test, and sign test. However, a previous study suggested that the use of the latter two for measuring the significance between system means should be discontinued due to their inadequate ability to detect significance and a tendency to steer toward false detection of significance (Smucker, Allan and Carterette, 2007).
The most widespread method of determining significance difference is through the p-value, by which a specific null hypothesis can be rejected. The p-value is the probability of obtaining almost equivalent or more evidence against the null hypothesis with the assumption that the null hypothesis is true (Fisher, 1995). A p-value larger than 0.1 is not small enough to be significant, a p-value as small as 0.05 can seldom be disregarded, and a p-value less than 0.01 indicates it is highly unlikely to occur by chance (Fisher, 1995). When more data are used in significance testing, the possibilities of obtaining a significant result are higher.
Test collections from TREC have the same topics and document corpus for each participant. The retrieval systems are assumed to have an approximately normal distribution, suggesting that parametric Student’s t-test is suitable for testing the significance of paired systems in this study. Meanwhile, the use of either parametric or nonparametric statistical tests has little impact because both evaluations result in the same conclusions (Sheskin, 2011).
In these hypothesis tests, the relationship between two systems’ effectiveness is measured. The effectiveness of a pair of systems is thought to be equal, where the null hypothesis is defined as H0: A=B. Two-sided p-values do not provide directions of deviations from H0 but a one-sided p-value is directional. Under the null hypothesis, the density of a p-value from a continuously distributed test statistic is uniform on the interval, 0 to 1.
A dependent t-test or paired t-test compares the means between two related samples on the same continuous, dependent variable (“Dependent T-Test using SPSS,” 2015). These assumptions are associated with dependent or paired t-test and were satisfied before conducting the experimentation:
- Dependent variable should be measured on a continuous scale such as interval or ratio.
- Independent variable should consist of related groups or matched pairs. Related groups indicate the same subjects are present in both groups.
- The distribution of the differences in the dependent variable between the two related groups should be approximately normally distributed.
When using dependent or paired t-test, independence of observations is not applicable, in contrast to the independent t-test.
Method for aggregating p-values
Combined significance has been described as providing an overall level of significance for a series of tests (Cooper, 1993). Combined significance is needed in this study to aggregate the multiple p-values from each of the fifty topics per system pair. There are many methods for summarizing significance level or p-values. The summarizing methods assume p-value as a continuous variable whereby the p-value is from a continuous test statistic. Continuous p-values summaries can be divided into those based on uniform distribution and those based on the statistical theories of other random variables such as transformed uniform variables. A uniform distribution has a constant probability for each variable, where summarizing p-values from multiple independent topics per system pair has equal probability. Uniform summaries include counting methods and a linear combination of p-values.
Sometimes, p-value summaries may test a common statistical null hypothesis but this does not have to be true in all tests. The null hypothesis for a test of combined significance is that the phenomena of interest are not present in any of the populations. In other words, all of the null hypothesis from the combined p-values must be true. The alternative hypothesis, however, is more complex and could imply different possible patterns of population parameters such that at least one of the population parameter provides evidence to reject the null hypothesis (Cooper, 1993). Such alternative hypothesis complements Fisher’s claims.
Fisher (1969) claimed that sometimes only a few or no individual probabilities are significant, but that their combined probabilities can be lower than would have been obtained by chance. He also mentioned that occasionally it is necessary to take into account only the individual probabilities, instead of the data from which the individual probabilities were derived, to obtain the aggregated probability. Although Fisher’s method has been commonly used in summarizing significance, rejecting null hypothesis due to a single combined p-value does not seem suitable for our study. It is not sufficient to have only one topic in a system pair to be statistically different, to suggest that the system pair is statistically significant.
Alternately, another summarizing method meanp which is a linear combination suits our study. Meanp is defined as
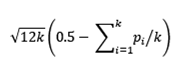
where k is total numbers of p-values and pi are the individual p-values that need to be combined or summarized (Cooper, 1993) and is a standard normal. If the defined meanp has a z value of more than z(α), the null hypothesis is rejected. The z(α) for 99% confidence is 2.58.
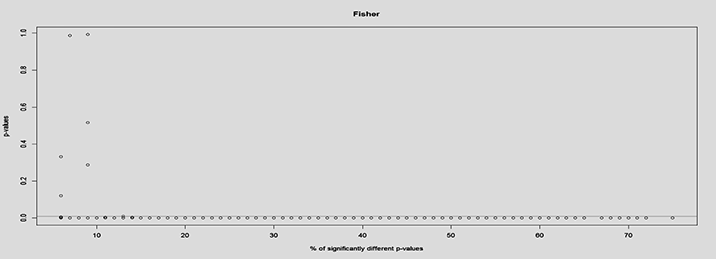
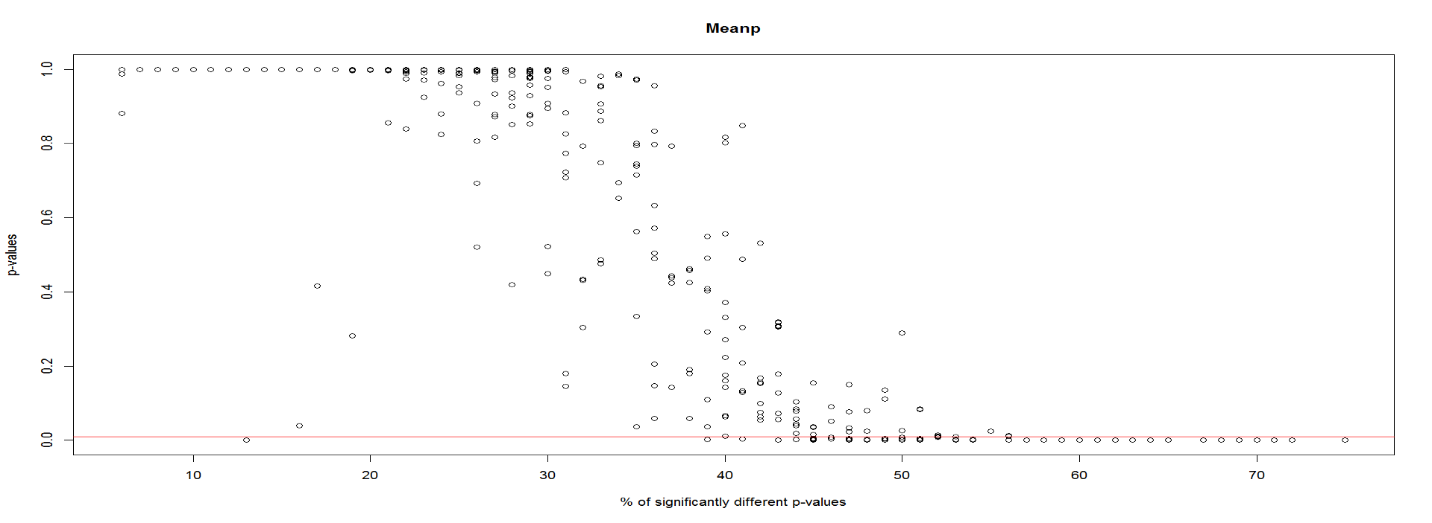
In combining p-values, selecting a suitable p-value summarizing method is important to reject the null hypothesis only if most topics between the system pairs were significantly different. A system’s effectiveness is usually determined by the effectiveness of all topics through mean average precision. Similarly, a combined p-value should take into consideration effectiveness of all topics per system pair. A preliminary analysis between Fisher’s and meanp method was done to determine the percentage of significantly different p-values from the fifty topics that would be needed to reject the combined null hypothesis. Figure 1 and Figure 2 show the percentage of statistically significant p-values from fifty topics that rejects the null hypothesis for Fisher’s method and meanp method respectively. Lower than 10% of the total combined p-values from fifty topics provide evidence to reject the null hypothesis using Fisher’s method, in accordance with Fisher’s claim. However, meanp requires almost 40% of the combined p-values from fifty topics to be significantly different before providing evidence to reject the null hypothesis. Based on this analysis and suitability with our study, meanp is our choice for aggregating the p-values.
Previous related studies
Previous studies have used the mean average precision to determine the statistical difference between system pairs (Smucker, Allan and Carterette, 2007). Five different tests of statistical difference were done using fifty topics: Student’s t-test, Wilcoxon signed-rank test, sign test, bootstrapping and Fisher’s randomization (permutation). Smucker et al. (2007) attempted to find agreement among these tests with the use of p-values. They concluded that there was little practical difference between Student’s t-test, bootstrapping and randomization, while the use of Wilcoxon and sign tests for measuring significant differences between means should be discontinued. In their 2009 study, only ten topics were used for statistical tests of randomization, paired Student’s t-test and bootstrapping (Smucker, Allan and Carterette, 2009). Disagreement among these tests was found to increase with ten topics, but the recommendation to use randomization and t-tests remained.
In another study, significance tests were done with the metrics precision at cut-off 10 (P@10) and mean average precision (Sanderson and Zobel, 2005), and an expansion of Voorhees and Buckley’s experiment was done. Previously, Voorhees and Buckley (2002) examined the significance by measuring the absolute difference in mean average precision between pairs of systems. The fifty topics were split into two disjoint sets of twenty-five topics each to determine whether the system ordering in the second set was similar to that in the first set based on mean average precision differences or error rates. Instead, Sanderson and Zobel (2005) extended the research to determine the impact of significance tests on error rates. They concluded that significance increased the reliability of retrieval effectiveness measures.
Dinçer, Macdonald and Ounis (2014) aimed to establish a theory of statistical hypothesis testing for risk-sensitive evaluations with the use of a new risk measure known as Trisk. This testing was done to shift from a descriptive analysis to an inferential analysis of risk-sensitive evaluation. TREC 2012 Web track was used in two-sided statistical testing that applied topic scores, expected reciprocal rank at cut-off 20 (ERR@20). Given an information retrieval system, a baseline system and a set of topics c, the significance of the calculated average trade-off score between risk and reward, Urisk, over the set of c topics can be obtained. The corresponding t-score, Trisk, is then compared against the selected level of significance (Dinçer et al., 2014).
Five different real-life information retrieval systems, namely, Google, Yahoo, MSN, Ask.com and Seekport, were evaluated by Lewandowski (2008) to determine their effectiveness based on the list of results and the results description. The significant difference between these systems was also obtained by using chi-square test. System performance was determined with the use of precision at a cut-off of twenty for the top twenty retrieved results, and forty queries were analysed. The results showed that Google and Yahoo had the best performance of the five systems, although the performances were not significantly different (p < 0.01) based on the list of results. However, the precision at cut-off k based on the results description showed that the differences among all five systems were highly significant (Lewandowski, 2008).
Statistical significance has been measured for system runs using various metrics to examine their ability in differentiating between the systems (Moffat, Scholer and Thomas, 2012). The results have been measured in terms of confidence indicators from a test for statistical significance. The authors stated that if the agreement of statistical significance between one metric and another metric is, for example 81%, using other metrics to determine statistically significant system pairs, one could have rejected the results as being not significant 19% of the time (Moffat, et al., 2012).
The above-mentioned studies, in addition to many others not cited here, used average and cut-off scores in significance testing for various information retrieval system evaluations.
Experiment
The experiments were laboratory-based and used test collections from TREC, including the data set from TREC-8 ad hoc track and TREC-9 Web track. The document corpus consists of 100GB of Web-crawled documents (Hawking, Craswell and Thistlewaite, 1999). The two test collections have different set of topics available for the retrieval systems but use the same document corpus. The difference between the systems lies in the usage of specific fields from a topic in retrieving the relevant documents. Some systems use the topic’s title-only field while others are combined with the descriptions field. A total of 129 system runs were submitted as part of TREC-8, and 105 system runs as part of TREC-9. One system from TREC-9 was no longer accessible on the TREC Website, leaving only 104 system runs. From these submitted runs, 25% of the least effective runs were removed. The least effective system runs were determined from their mean average precision scores using the traditional TREC method.
Each test collection consisted of fifty topics, with up to 1000 documents per topic in the submitted runs. All topics were considered in the experimentation regardless of the difficulty level or the number of known relevant documents (based on the relevance judgment) for each topic. The relevance judgments were constructed from a pooling depth of 100 based on the contributing systems for each test collection. Although the relevance judgment from TREC-9 used ternary relevancy, here it was interpreted as binary relevance for standardization between both test collections.
Before the experimentation, standardization of document rankings was done, in which all documents were arranged in descending order based on their similarity scores. Two or more documents with the same similarity scores were ordered alphabetically by document identifier. The standardization was done because some submitted system runs had rankings that did not match the similarity scores, whereas others had the same similarity scores for many documents.
Evaluating at topic-level, each system consisted of exactly the same topics per test collection, measuring the distribution of relevant documents amongst non-relevant documents. Similarly, effectiveness at document-level measures the distribution of relevant documents within the top k documents per query. This is regardless of which document is retrieved but based on document’s relevancy. Before evaluating at document-level, the assumptions (as stated in Significance testing section) of a paired or dependent t-test needs to be met.
In this experimentation, document scores are the dependent variable measured on a continuous scale while the independent variable is the documents’ ranks. Independent variable requires both samples to have matched pair. In this experiment, the matched pair is the documents’ ranks. Each topic from a system run can have up to 1000 documents retrieved and ranked but the sample consists of 30, 50, 100 or 150 documents. The assumption that distribution of differences in the dependent variable between the two samples should be approximately normally distributed can be met as the metrics precision and rank-biased precision can only have values within [0,1]. The independent variable, document rank, allows the dependent test to measure the mean difference between the distributions of relevant documents from top k documents.
Paired Student’s t-test (one-sided, both ways), was done by using the document-level scores per topic from each pair of systems. The one-sided significance test was chosen to determine if one system was better than the other. The null hypothesis states that the two systems do not differ, whereas the alternative hypothesis suggests that system A is better than system B or vice versa (one-sided, both ways). One-sided significance tests have been performed both ways because there is a possibility for either system from the system pair to be better than the other.
Significance testing at document-level results in fifty p-values for each system pair, which was contributed by fifty topics. A single p-value is needed to represent the system pair comprehensively for evaluation. Therefore, meanp method of combining p-values is used to aggregate the fifty p-values. The single p-value obtained could then be compared against the p-value from paired t-test using topic-level scores from the same pair of systems. The results would be evaluated based on the number of system pairs that are statistically significant (p=0.01). A total of 9,312 system pairs for TREC-8 and 6,006 for TREC-9 could be evaluated in each test collection. The following formula, total system pairs = total systems2 – total systems computes total numbers of system pairs for each test collection.
Methods
The following two subsections describe the various topic- and document-level experimentation and the steps involved to determine the significant difference between the systems.
Average precision versus precision
Traditional system evaluation by using topic-level average precision scores was done as a basis for comparison with the proposed document-level evaluation method. An evaluation depth of 1,000 documents, similar to the standard evaluation depth in TREC (Webber, Moffat and Zobel, 2010), was used in computing the average precision scores for each topic. These average precision scores were then used in the paired Student’s t-test (one-sided, both ways) between pairs of systems. In our first proposed method for document-level evaluation, the precision of each document per topic per system was computed. The precision score at each rank per topic from the pair of systems was used in Student’s paired t-test (one-sided, both ways). Sample size of 30, 50, 100, or 150 ranked documents per topic from system A (the basis for comparison with another system) was used for significance testing against system B. In cases in which some system pairs have insufficient ranked documents that are lower than the selected sample size, those topics per system pair were eliminated from the paired t-test. This ensures that the test statistics generate from equal numbers of observations for all pairs of systems.
Rank-biased precision at k versus Rank-biased precision
Another document-level metric considered in this study is the rank-biased precision. The rank-biased precision is computed for all documents (up to 1000) per topic per system. Persistence values of p = 0.8 and p = 0.95 are used to compute the rank-biased precision scores of each document, given that larger values of p are known to lead to deeper evaluation (Webber, Moffat and Zobel, 2010). The documents per topic were then matched between pairs of systems according to their document ranks, after which sample size selection of 30, 50, 100, or 150 ranked documents was used. In cases in which systems have ranked documents per topic that are less than the selected sample size, those topics per system pair were eliminated from the paired t-test. The rank-biased precision scores of documents between system pairs were used in paired t-test (one-sided, both ways) to determine if the system pairs were equally effective. The number of significant pairs obtained from our proposed method would be compared with those from topic-level rank-biased precision at an evaluation depth of 100 since rank-biased precision is not dependent on the evaluation depth.
Results and discussion
Aggregated p-values using meanp method from one-sided significance tests (both ways) at document-level using precision and rank-biased precision scores are compared with topic-level average precision and rank-biased precision at cut-off k (RBP@k), respectively. Throughout this study, the statistical significance level is 1%. Table 1 shows the number of statistically significant (p = 0.01) system pairs using average precision at cut-off 1000 (AP@1000) scores at topic-level and precision scores at document-level. The table shows the number of system pairs that suggest system A is better than system B, its reverse, where system B is better than system A and their conflicting claims whereby both one-sided significant tests claim system A is better than system B and vice versa.
Experiments were conducted with various sample sizes per topic based on the top k ranked documents for each pair of systems. A maximum of fifty p-values (from fifty topics) per system pair are aggregated to a single p-value to determine the number of significantly different system pairs. Some system pairs had either insufficient ranked documents per topic or the data were generally constant, making it infeasible for paired t-test. Approximately, 9312 system pairs for TREC-8 and 6006 system pairs for TREC-9 were evaluated.
As shown in Table 2, all selected sample sizes of the proposed method at document-level using precision scores yield better results in identifying significantly different (p=0.01) system pairs compared to topic-level average precision at cut-off 1000 (AP@1000) scores.
| Sample size | TREC-8 | TREC-9 | ||||||
|---|---|---|---|---|---|---|---|---|
| A>B & B>A | A>B | B>A | Total (%) | A>B & B>A | A>B | B>A | Total (%) | |
| AP@1000 | 0 | 1507 | 659 | 2166(23%) | 0 | 591 | 705 | 1296(22%) |
| 30 | 0 | 1797 | 934 | 2731(29%) | 0 | 941 | 938 | 1879(31%) |
| 50 | 0 | 1816 | 938 | 2754(30%) | 0 | 985 | 990 | 1975(33%) |
| 100 | 0 | 1830 | 918 | 2748(30%) | 0 | 1004 | 1012 | 2016(34%) |
| 150 | 0 | 1844 | 928 | 2772(30%) | 0 | 1016 | 1005 | 2021(34%) |
| Note: The p-values in the document-level method were aggregated by meanp method. The percentage of significantly different unique system pairs based on sample size is shown. The total number of unique system pairs varies due to the elimination of system pairs with insufficient ranked documents or essentially constant data. | ||||||||
There were no conflicting claims for any of the selected sample sizes, including that of topic-level average precision at cut-off 1000 (AP@1000). Conflicting claims here refers to results from one-sided paired t-test, both ways, that suggest system A is better than system B and also that system B is better than system A. Both test collections show that tests with higher numbers of documents per topic (sample size) are better able to identify more statistically significant system pairs. A sample size of 150 in paired t-tests identifies highest numbers of statistically significant system pairs which could result from the larger sample size. Larger sample sizes may produce smaller p-values (Cooper, 1993), resulting in the usage of 150 sample size identifying more statistically significant system pairs. However, the proposed document-level method using precision scores is better than topic-level in recognizing statistically significant system pairs for all sample sizes used in significance testing. This could have resulted from using precise document scores in significance testing as opposed to using averaged topic scores. However, we continue to determine how many of the statistically significant system pairs identified by the proposed method were in agreement or disagreement to those originally identified by the topic-level.
A comparison was performed between the traditional topic-level and proposed document-level methods’ agreement or disagreement in terms of accepting or rejecting the null hypothesis (p=0.01). The classification of such agreement and disagreement was adopted from Moffat, Scholer and Thomas (2012) and modified to suit the comparison between two methods. The categorizations based on statistical significance are presented below, where M1 refers to topic-level and M2 refers to document-level method:
- Active agreements: where method M1 and M2 both provide evidence that system A is significantly better than system B, or vice versa on systems.
- Active disagreements: where method M1 says that system A is significantly better than system B, but method M2 says that system B is significantly better than system A, or vice versa on systems.
- Passive disagreements M1: where method M1 provides evidence that system A is significantly better than system B (or vice versa on systems), but method M2 does not provide evidence in support of the same claim.
- Passive disagreements M2: where method M2 provides evidence that system A is significantly better than system B (or vice versa on systems), but method M1 does not provide evidence in support of the same claim.
- Passive agreements: where method M1 fails to provide sufficient evidence that system A is significantly better than system B and so does method M2.
Table 3 shows the number of system pairs in agreement or disagreement between average precision at cut-off 1000 (AP@1000) and proposed method using precision scores, where the p-values are aggregated using the meanp summarizing method.
Active agreement between the traditional (topic-level) and the proposed method increases with the increase in sample sizes included in paired t-test. Active disagreement between the traditional and the proposed method remains low, at less than 1% of the total number of system pairs evaluated using different sample sizes. The number of system pairs claimed to be significantly different in the traditional method but not similarly claimed by the proposed method decreases as sample size increases. It is a good indication that passive disagreements M1 remain low and the proposed method is better able to match active agreements with increased sample sizes. Passive disagreements M2 results show that the number of significantly different system pairs decreases for TREC-8 when the traditional method did not provide evidence for rejecting null hypothesis while the proposed method provides sufficient evidence to reject the null hypothesis. Meanwhile, TREC-9 passive disagreements M2 fluctuates slightly across the various sample sizes.
The increase in the active agreement between the methods indicates that larger sample sizes are better able to match the numbers of statistically significant system pairs identified by the traditional method. More than 90% of the statistically significant system pairs from traditional method have been identified by the proposed method when using 150 sample sizes. Similar results in both test collections show that the proposed method is reliable to reproduce identification of statistically and non-statistically significant system pairs. The proposed method could provide sufficient evidence to reject the null hypothesis with the increase in sample size. The reduction in passive disagreements shows that when a larger sample size is used, the proposed method is able to match well the traditional method with regard to active agreements and passive agreements.
| Categorization | AP-30 | AP-50 | AP-100 | AP-150 | |||
|---|---|---|---|---|---|---|---|
| TREC-8 | |||||||
| Active agreements | 1821 | 1878 | 1933 | 1976 | |||
| Active disagreements | 2 | 1 | 1 | 1 | |||
| Passive disagreements M1 | 344 | 288 | 233 | 190 | |||
| Passive disagreements M2 | 910 | 876 | 815 | 796 | |||
| Passive agreements | 6233 | 6268 | 6329 | 6348 | |||
| Total | 9310 | 9311 | 9311 | 9311 | |||
| TREC-9 | |||||||
| Active agreements | 1152 | 1192 | 1226 | 1239 | |||
| Active disagreements | 1 | 5 | 5 | 4 | |||
| Passive disagreements M1 | 145 | 105 | 71 | 58 | |||
| Passive disagreements M2 | 732 | 789 | 793 | 789 | |||
| Passive agreements | 3975 | 3918 | 3914 | 3918 | |||
| Total | 6005 | 6009 | 6009 | 6008 | |||
| Note: The aggregated p-values uses meanp method. The table shows the comparison for various sample sizes experimented. | |||||||
Table 4 shows the number of statistically significant (p=0.01) system pairs using rank-biased precision metrics with persistence of 0.95. The total numbers are taken from both ways one-sided paired t-test. The table shows results that claim system A is better than system B, system B is better than system A, and conflicting claims between both the one-sided paired t-test.
The proposed method at document-level using rank-biased precision scores yield better results in identifying significantly different (p=0.01) system pairs compared to topic-level rank-biased precision at cut-off 100 (RBP@100) scores. Better evaluation is expected for persistence 0.95 compared to persistence 0.8 due to the nature of rank-biased precision, in which a larger value of persistence leads to a deeper evaluation (Webber, Moffat and Zobel, 2010). There were no conflicting claims for any of the proposed method’s sample sizes and topic-level rank-biased precision at cut-off 100 (RBP@100), similar to average precision at cut-off 1000 (AP@1000) and precision document-level method.
TREC-8 test collection shows fifty documents per topic (sample size) are needed to identify most statistically significant system pairs, whereas TREC-9 shows 150 documents per topic are needed for identification of most statistically significant pairs. The number of statistically significant system pairs identified are generally close across the various sample sizes. The differences in percentage are not more than 5% among all the sample sizes. When compared with the results from the document-level method using precision score, rank-biased precision does not give a consistent indication of best sample size across both test collections. The proposed method using rank-biased precision document-level scores have identified approximately 8% to 18% more statistically significant system pairs compared to the traditional method. However, it is questionable whether the proposed method was able to successfully identify all of those statistically significant system pairs from the traditional method since the number of statistically significant pairs from the proposed method is higher compared to the traditional method. Agreement and disagreement comparison between topic-level rank-biased precision at cut-off 100 (RBP@100) and document-level rank-biased precision method was analysed similarly to that done for topic-level average precision and document-level precision.
| Sample size | TREC-8 | TREC-9 | ||||||
|---|---|---|---|---|---|---|---|---|
| A>B & B>A | A>B | B>A | Total (%) | A>B & B>A | A>B | B>A | Total (%) | |
| RBP@100(p=0.95) | 0 | 1361 | 618 | 1979(21%) | 0 | 690 | 778 | 1468(24%) |
| 30 | 0 | 1478 | 666 | 2144(23%) | 0 | 799 | 878 | 1677(28%) |
| 50 | 0 | 1539 | 702 | 2241(24%) | 0 | 830 | 904 | 1734(29%) |
| 100 | 0 | 1523 | 699 | 2222(24%) | 0 | 840 | 901 | 1741(29%) |
| 150 | 0 | 1506 | 689 | 2195(24%) | 0 | 840 | 901 | 1749(29%) |
| RBP@100(p=0.8) | 0 | 1168 | 532 | 1700(18%) | 0 | 617 | 609 | 1226(20%) |
| 30 | 0 | 1441 | 684 | 2125(23%) | 0 | 755 | 746 | 1501(25%) |
| 50 | 0 | 1450 | 679 | 2129(23%) | 0 | 761 | 760 | 1521(25%) |
| 100 | 0 | 1391 | 650 | 2041(22%) | 0 | 774 | 752 | 1526(25%) |
| 150 | 0 | 1365 | 637 | 2002(21%) | 0 | 774 | 752 | 1539(26%) |
Table 5 shows the number of system pairs’ agreements or disagreements between traditional rank-biased precision at cut-off 100 (RBP@100, p=0.95) and proposed method using rank-biased precision (RBP, p=0.95) scores whereby the p-values are aggregated using meanp summarizing method. Table 6 shows the number of system pairs’ agreements or disagreements between traditional rank-biased precision at cut-off 100 (RBP@100, p=0.8) and proposed method using rank-biased precision (RBP, p=0.8) scores whereby the p-values are aggregated using meanp summarizing method.
| Categorization | RBP-30 | RBP-50 | RBP-100 | RBP-150 | |
|---|---|---|---|---|---|
| TREC-8 | |||||
| Active agreements | 1868 | 1907 | 1880 | 1849 | |
| Active disagreements | 0 | 0 | 0 | 0 | |
| Passive disagreements M1 | 111 | 72 | 99 | 130 | |
| Passive disagreements M2 | 276 | 334 | 342 | 346 | |
| Passive agreements | 7053 | 6997 | 6989 | 6985 | |
| Total | 9308 | 9310 | 9310 | 9310 | |
| TREC-9 | |||||
| Active agreements | 1411 | 1417 | 1419 | 1413 | |
| Active disagreements | 0 | 0 | 0 | 0 | |
| Passive disagreements M1 | 57 | 51 | 49 | 55 | |
| Passive disagreements M2 | 266 | 317 | 322 | 336 | |
| Passive agreements | 4270 | 4219 | 4214 | 4200 | |
| Total | 6004 | 6004 | 6004 | 6004 |
| Categorization | RBP-30 | RBP-50 | RBP-100 | RBP-150 | |
|---|---|---|---|---|---|
| TREC-8 | |||||
| Active agreements | 1651 | 1647 | 1638 | 1600 | |
| Active disagreements | 0 | 0 | 0 | 0 | |
| Passive disagreements M1 | 49 | 53 | 62 | 100 | |
| Passive disagreements M2 | 474 | 482 | 403 | 402 | |
| Passive agreements | 7134 | 7128 | 7207 | 7208 | |
| Total | 9308 | 9310 | 9310 | 9310 | |
| TREC-9 | |||||
| Active agreements | 1184 | 1180 | 1181 | 1179 | |
| Active disagreements | 0 | 0 | 0 | 0 | |
| Passive disagreements M1 | 42 | 46 | 45 | 47 | |
| Passive disagreements M2 | 317 | 341 | 345 | 360 | |
| Passive agreements | 4461 | 4437 | 4433 | 4418 | |
| Total | 6004 | 6004 | 6004 | 6004 |
As mentioned earlier, larger persistence values produce deeper evaluation (Webber, Moffat and Zobel, 2010). In accordance to that, the persistence value of 0.95 has higher numbers of statistically significant system pairs identified for both traditional and proposed method compared to numbers from persistence of 0.8. The number of system pairs for the active agreements category is also higher for deeper evaluation using persistence 0.95 compared to 0.8. The percentage of active agreements for both persistence values experimented are equally good. The document-level method using rank-biased precision is able to identify approximately 96% of the statistically significant system pairs identified by topic-level. This is true for both test collections. Therefore, the proposed method is reliable for the identification of statistically significant (p=0.01) system pairs.
On another note, increasing sample size, decreases identification of significantly different system pairs for the rank-biased precision metric. This proves that increasing sample size does not necessarily give better results. In addition, with the decline in active agreements between topic-level and document-level, it is unlikely that further increase in sample size would be better able to identify statistically significant system pairs. Hence, it can be stated that current finding using the proposed method is at its best when using rank-biased precision metric. However, similar claims cannot be made for the document-level method using precision scores because the number of active agreements between topic-level average precision at cut-off 1000 (AP@1000) and document-level precision scores continue to increase with sample size. It is possible that increasing the sample size to more than 150 could also increase the percentage of active agreements for the document-level method using precision scores.
In the information retrieval field, higher numbers of statistically significant system pairs could indicate that the proposed method using document scores is better able to distinguish statistical difference compared to averaged topic scores. In a previous study, the ability of a metric to differentiate between the systems that are statistically significant was used to determine the effectiveness of the metric (Moffat, Scholer and Thomas, 2012). Similarly, in our study, the ability of a method to differentiate between the systems that are statistically significant determines the effectiveness of the method used. Type I error indicates 1% of the statistically significant system pairs could have wrongly rejected the null hypothesis. In other words, 10 in 1000 system pairs could be wrongly rejecting the null hypothesis.
Tabular data provide accurate numbers of system pairs which are significantly or nonsignificantly different while graphical illustration shows the distribution of p-values between the topic-level and document-level. The graphical illustrations for both document-level methods and their sample sizes appear to have a similar pattern, hence, only one graph is provided in this paper. Figure 3 is a scatter plot graph comparing the p-values of system pairs between the topic-level rank-biased precision at cut-off 100 (RBP@100) and the document-level rank-biased precision (RBP, p=0.95) for TREC-9 with sample size 100. The x-axis represents the topic-level p-values, whereas the y-axis denotes the document-level aggregated p-values using meanp. The vertical and horizontal lines mark the axes with a p-value of 0.01 based on the significance testing.
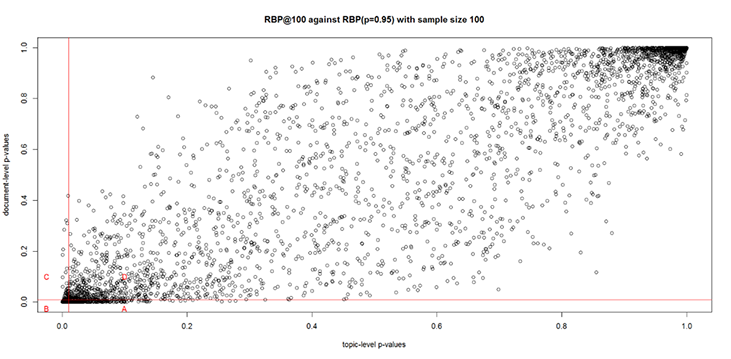
Figure 3: System pair p-values of RBP@100 (p=0.95) and RBP (p=0.95) for TREC-9 with sample size 100
A) System pair p-values that were significantly different at document-level but not at topic-level;
B) system pair p-values that were significantly different at both topic- and document-level;
C) system pair p-values that were significantly different at topic-level but not at document-level;
D) system pair p-values that were not significantly different at both topic- and document-level.
Regions A and C are of most interest to us because they include the system pairs with passive disagreements. Region A covers many system pair plots with p-values of 0.01 and below based on the document-level method. These were previously identified as nonsignificantly different in the topic-level method. In contrast, region C has fewer system pairs than region A. We can see that the difference in the distribution of p-values between region C and A shows that the document-level method is effective in identifying statistically significant system pairs compared to the topic-level method.
Conclusion
Based on the results of our study, it can be concluded that the document-level method is effective in identifying significantly different (p=0.01) system pairs. The document-level scores used in significance testing identify higher numbers of statistically significant system pairs compared to the topic-level method. In addition, statistically significant system pairs’ agreement percentage is high which also indicates the effectiveness of the proposed method. The use of document-level scores per system pair is reliable in statistically significant identification because active agreement remains consistent between test collections and between both metrics used in the experiment.
When comparing the two document-level methods applied in statistical significance testing, it can be seen that the use of rank-biased precision document scores is better able to identify significantly different system pairs compared to using precision scores. However, both document-level methods are equally good. It can be concluded that individual document-level scores can be used as a pairwise system evaluation unit for information retrieval systems, instead of topic-level scores.
Future research could analyse the relation of pairwise system evaluation using document-level scores with the difficulties of topics and how it affects the identification of statistically significant pairs.
Acknowledgements
We acknowledge the UMRG Programme - AET (Innovative Technology) (ITRC) (RP028E-14AET) from University of Malaya, Malaysia.
About the authors
Prabha Rajagopal
is currently associated with the Faculty of Computer Science and Information Technology, University of Malaya, Malaysia. She received her Bachelor’s degree in Electronics Engineering from Multimedia University, Malaysia and Master’s degree in Computer Science from University of Malaya, Malaysia. She can be contacted at prabz13@yahoo.com
Sri Devi Ravana received her Master of Software Engineering from University of Malaya, Malaysia in 2001, and PhD from the Department of Computer Science and Software Engineering, The University of Melbourne, Australia, in 2012. Her research interests include information retrieval heuristics, data analytics and the Internet of things. She is currently a Senior Lecturer at the Department of Information Systems, University of Malaya, Malaysia. She can be contacted at sdevi@um.edu.my
Harshit Srivastava received his Bachelor of Technology in Information Technology from Maharaja Agrasen Institute of Technology in New Delhi, India. His main research interest is in the field of Information Systems particularly in information retrieval, lcoud computing and the Internet of things. He can be contacted at harshit.ndl@gmail.com
Masumeh Sadat Taheri received her Master of Computer Science with the specialisation in Multimedia from University of Malaya, Malaysia in 2013. She worked as a research assistant in the information system department, Faculty of Computer Science and Information Technology at University of Malaya, Malaysia. Her current research interests include information retrieval evaluation, significance testing, scientometrics and game-based learning techniques. She can be contacted at Masumeh.Taheri@gmail.com
References
- Baccini, A., Déjean, S., Lafage, L., & Mothe, J. (2012). How many performance measures to evaluate information retrieval systems? Knowledge and Information Systems, 30(3), 693–713.
- Buckley, C. and Voorhees, E. M. (2000). Evaluating evaluation measure stability. In Proceedings of the 23rd annual international ACM SIGIR conference on Research and development in information retrieval SIGIR '00 (pp. 33–40). Athens, Greece: ACM.
- Cooper, H. (1993). A handbook of research synthesis. New York, NY: Russell Sage Foundation.
- Dependent t-test using SPSS. (2015). Retrieved January 3, 2016, from https://statistics.laerd.com/spss-tutorials/dependent-t-test-using-spss-statistics.php (Archived by WebCite® at http://www.webcitation.org/6qIoBZXdN).
- Dinçer, B. T., Macdonald, C., & Ounis, I. (2014). Hypothesis testing for the risk-sensitive evaluation of retrieval systems. In Proceedings of the 37th international ACM SIGIR conference on Research & development in information retrieval - SIGIR ’14 (pp. 23–32). Gold Coast, Queensland: ACM.
- Fisher, R. A. (1969). Statistical methods for research workers (Fourteenth ed.). Edinburgh: Oliver and Boyd.
- Fisher, R. A. (1995). Statistical methods, experimental design, and scientific inference. New York, NY: Oxford University Press.
- Greengrass, E. (2001). Information retrieval: a survey.. OD Technical Report TR-R52-008-001.
- Hawking, D., Craswell, N., & Thistlewaite, P. (1999). Overview of TREC-7 Very Large Collection Track. In NIST Special Publication 500-242: the Seventh Text REtrieval Conference (TREC 7) (pp. 1–13). Gaithersburg, MD: National Institute of Standards and Technology.
- Järvelin, K., & Kekäläinen, J. (2002). Cumulated gain-based evaluation of IR techniques. ACM Transactions on Information Systems, 20(4), 422–446.
- Jayasinghe, G. K., Webber, W., Sanderson, M., Dharmasena, L. S., & Culpepper, J. S. (2015). Statistical comparisons of non-deterministic IR systems using two dimensional variance. Information Processing & Management, 51(5), 677–694.
- Joachims, T., Granka, L., Pan, B., Hembrooke, H., & Gay, G. (2005). Accurately interpreting clickthrough data as implicit feedback. In Proceedings of the 28th annual international ACM SIGIR conference on Research and Development in Information Retrieval: SIGIR'05 (pp. 154–161). Salvador, Brazil: ACM.
- Kulinskaya, E., Morgenthaler, S., & Staudte, R. (2014). Significance testing: an overview. In M. Lovric, (Ed.), International encyclopedia of statistical science (pp. 1318–1321). Berlin, Germany: Springer.
- Lewandowski, D. (2008). The retrieval effectiveness of Web search engines: considering results descriptions. Journal of Documentation, 64(6), 915–937.
- Manning, C. D., Raghavan, P., & Schütze, H. (2009). An introduction to information retrieval. Cambridge: Cambridge University Press.
- Moffat, A., Scholer, F., & Thomas, P. (2012). Models and metrics:IR evaluation as a user process. In Proceedings of the Seventeenth Australasian Document Computing Symposium: ADCS ’12 (pp. 47–54). Dunedin, New Zealand: ACM.
- Moffat, A., & Zobel, J. (2008). Rank-biased precision for measurement of retrieval effectiveness. ACM Transactions on Information Systems, 27(1), 1–27.
- Ravana S.D., & Moffat A. (2010). Score estimation, incomplete judgments, and significance testing in IR evaluation. In P. J. Cheng, M. Y. Kan, W. Lam, and P. Nakov, (Eds.), Information Retrieval Technology: AIRS 2010 (Lecture Notes in Computer Science, 6458). Berlin, Germany: Springer.
- Robertson, S. E., & Kanoulas, E. (2012). On per-topic variance in IR evaluation. In Proceedings of the 35th annual international ACM SIGIR conference on Research and Development in Information Retrieval: SIGIR ’12 (pp. 891–900). Portland, Oregon: ACM.
- Robertson, S., Kanoulas, E., & Yilmaz, E. (2010). Extending average precision to graded relevance judgments. In Proceedings of the 33rd annual international ACM SIGIR conference on Research and Development in Information Retrieval: SIGIR’10 (pp. 603–610). Geneva, Switzerland: ACM.
- Sakai, T., & Kando, N. (2008). On information retrieval metrics designed for evaluation with incomplete relevance assessments. Information Retrieval, 11(5), 447–470.
- Sanderson, M., & Zobel, J. (2005). Information retrieval system evaluation: effort, sensitivity, and reliability. In Proceedings of the 28th annual international ACM SIGIR conference on Research and Development in Information Retrieval: SIGIR’05 (pp. 162–169). Salvador, Brazil: ACM.
- Sheskin, D. J. (2011). Parametric versus nonparametric tests. In M. Lovric, (Ed.), International encyclopedia of statistical science (pp. 1051–1052). Berlin, Germany: Springer.
- Shi, H., Tan, Y., Zhu, X., & Wu, S. (2013). Measuring stability and discrimination power of metrics in information retrieval evaluation. Lecture Notes in Computer Science (including subseries Lecture Notes in Artificial Intelligence and Lecture Notes in Bioinformatics), 8206, 8–15. Berlin, Germany: Springer-Verlag.
- Smucker, M. D., Allan, J., & Carterette, B. (2007). A comparison of statistical significance tests for information retrieval evaluation. In Proceedings of the sixteenth ACM conference on information and knowledge management (pp. 623–632). Lisbon, Portugal: ACM.
- Smucker, M. D., Allan, J., & Carterette, B. (2009). Agreement among statistical significance yests for information retrieval evaluation at varying sample sizes. In Proceedings of the 32nd international ACM SIGIR conference on Research and Development in Information Retrieval: SIGIR ’09 (2, pp. 630–631). Boston, MA: ACM.
- Tsytsarau, M., & Palpanas, T. (2012). Survey on mining subjective data on the web. Data Mining and Knowledge Discovery, 24(3), 478–514.
- Urbano, J., Marrero, M., & Martín, D. (2013). A comparison of the optimality of statistical significance tests for information retrieval evaluation. In Proceedings of the 36th international ACM SIGIR conference on Research and Development in Information Retrieval (pp. 925–928). Dublin, Ireland: ACM.
- Voorhees, E. M., & Buckley, C. (2002). The effect of topic set size on retrieval experiment error. In Proceedings of the 25th annual international ACM SIGIR conference on Research and Development in Information Retrieval: SIGIR’02 (pp. 316–323). Tampere, FL: ACM.
- Watters, C. (1999). Information retrieval and the virtual document. Journal of the American Society for Information Science, 50(11), 1028–1029.
- Webber, W., Moffat, A., & Zobel, J. (2010). The effect of pooling and evaluation depth on metric stability. In The 3rd International Workshop on Evaluating Information Access (EVIA 2010) (pp. 7–15). Retrieved from http://research.nii.ac.jp/ntcir/workshop/OnlineProceedings8/EVIA/03-EVIA2010-WebberW_slides.pdf (Archived by WebCite® at http://www.webcitation.org/6qIoSA86A).