Twitter conversation patterns related to research papers
Gustaf Nelhans and David Gunnarsson Lorentzen
Background
The Web and especially social media have increasingly become an arena for communication amongst researchers, complementing the journal article as well as social interaction such as the seminar or conference meetings. The notion of using this information as indicators of research output and metrics has increasingly gained scholarly interest (Haustein, Sugimoto and Larivière, 2015). Altmetrics, sometimes referred to as social media metrics (Haustein, Sugimoto and Larivière, 2015), is then used as means for measuring research impact based on online metrics as an alternative to citation analysis. It has been suggested that with the altmetric counts still being at a low level, and the positive correlation with citations is weak, the indicators are at best a complement to citations (Costas, Zahedi and Wouters, 2015). Blog citations however were found as an alternative source to citations (Shema, Bar-Ilan and Thelwall, 2014).
One source for altmetric data is Twitter (e.g., Hammarfelt, 2014; Haustein et al., 2014; Thelwall, Haustein, Larivière and Sugimoto, 2013). Tweets comprise the most common provider to the commercial Altmetric.com service (Costas, Zahedi and Wouters, 2015). Twitter mentions are generally regarded as having low value as an impact measure since tweets are easily manipulated. Moreover, one study has found large volumes of tweets created by automated bots (Haustein et al., 2016). There is also a known bias in Twitter data as it is commonly used for marketing by publishers and authors, rather than as communication about the actual research. The correlation between Twitter mentions and citations has been found to be non-existent (e.g., Bornmann, 2015b). In this paper, we shift the focus slightly to also include conversations as units of analysis. Gonzales (2014) viewed tweets including a conference hashtag as a conversation. Contrary to this view, we define conversations as chains of tweets that are linked together through replies to previous tweets. The rationale for focusing on conversations rather than on single tweets in an altmetric study is that if there is an interaction there is sign of interest and possible communication between users. Tweets for marketing or spam are seldom replied to and, therefore, are expected to be much lower in a study focussing on conversations. The length and characteristics of Twitter conversations with possible bifurcations and dead ends are arguably more relevant aspects to measure in terms of impact than the sheer number of singular tweets. This is an empirical question that will be pursued using an exploratory approach in this study.
Previous related research on scholarly activity has been performed in different ways. Holmberg and Thelwall (2014) tracked the activities of a list of predefined scholars from different disciplines. A related study was made by Haustein, Bowman, Holmberg, Peters and Larivière (2014) who focused on the behaviour of thirty-seven astrophysicists. A negative correlation between tweets per day and number of publications was found, and there was no correlation between retweet and citation rates in either way (i.e., retweets made and citations made and retweets received and citations received). Using the same dataset, Holmberg, Bowman, Haustein and Peters (2014) focused on the conversational connections of the studied users. Among their findings the most relevant to us is that there was little interaction in regards of directing messages to other users (@mention). Thus tweeting behaviour was more about information sharing than having conversations.
Searching for references to entities related to the academia has previously been studied by Orduña-Malea, Torres-Salinas and Delgado López-Cózar (2015), who performed a link analysis of tweet references to a sample of 200 university Web sites and found a correlation between tweet links and Web links. Finally, Thelwall, Tsou, Weingart, Holmberg and Haustein (2013) used content analysis of tweets linking to journals and digital libraries. The far most common tweet included the title or a brief description of the article, and positive or negative comments were rare. The authors conceded a limitation in that the discussion of the articles was not captured by their method and suggested 'a deeper future analysis might be able to assess the extent to which this occurs'. This study fills this gap, while it also includes bibliographic and bibliometric analyses of academic Web sources such as articles and data-sets referred to by digital object identifier.
Aim and research questions
Aim
The aim of this study is to gain an understanding about the characteristics of Twitter conversations about objects of research such as research papers identified by digital object identifier references. The digital object identifier is a reasonable identifier for research publications and is suitable for the exploratory approach used here. Since Twitter is an interactive media platform, we argue that its relevance for social media metrics should be valued not by the numbers of tweets. Instead its merits should evaluated by its prospects of capturing relevant correspondence about the research that is mentioned. The analysis will be done using both network analysis tools to study their development and content analysis of a selection of actual conversations with regards to content and style of communication. While hashtag or keyword based studies of scholarly activity on Twitter has been published previously, this is the first paper to investigate Twitter conversation in altmetrics data.
Research questions
Our overarching questions are:
RQ1: Which types of academic source are most often mentioned?
RQ2: Which types of academic source are most often retweeted?
We then investigate the threaded conversations with at least ten tweets from these questions:
RQ3: Which disciplines and topics are the articles referred to representing in the selected conversations?
Finally, we investigate fourteen chosen threads using content analysis:
RQ4: What are the characteristics of conversational threads emanating from a reference to an article?
RQ5: How are research papers referred to in a threaded conversation?
Methods
Data collection
We used the Twitter streaming API to filter tweets containing the strings 'dx' and 'doi' or including an embedded dx.doi.org URL. A drawback with traditional Twitter research is that when hashtags or keywords are used for data collection, the replies to these tweets that do not match the search criteria are missing. This unknown conversation has been labelled follow-on tweets or follow-on communication (e.g., Bruns, 2012; Bruns and Moe, 2013), and is so far under-researched (e.g., Bruns and Moe, 2013; Lorentzen and Nolin, in press). In order to capture the conversation around these tweets we simultaneously filtered the stream for replies to tweets in our dataset by tracking the most active participants in the conversation during the current week, using a method similar to the one used by Lorentzen and Nolin (in press). This means we tracked both Twitter users posting digital object identifier tweets and users replying to tweets in the dataset. As in Lorentzen and Nolin (in press), we identified tweets replying to tweets not captured and queried the API for the missing tweets using the endpoint GET statuses/lookup. Data were collected during April 2015.
The Twitter API returns a subset of the tweets matching the search criteria and their associated metadata. Of this metadata, two entities are of particular interest to us: the URL and the reply field. A URL embedded in the tweet is represented by three versions; one shortened (e.g., http://t.com/H2QYbr6SkU), one for display (e.g., dx.doi.org/10.1037/xge000) and one expanded (e.g., http://dx.doi.org/10.1037/xge0000043). A reply is denoted by an ID of a tweet a given tweet is replying to. This reference to another tweet is used to build conversational threads from the data, here defined as two or more tweets connected through the reply metadata field. A thread is thus comprised of a start tweet and a chain or tree of replies.
From the text of the tweets we can derive whether a tweet is a retweet of another tweet or not. Unfortunately, not all retweets can be identified as the API only denotes manual retweets as retweets and not button retweets (e.g., Bruns and Moe, 2013). The manual retweet typically includes the original message but with 'RT', 'MT', or 'via' added to the user name of the original tweet author. The former is the far most common in this dataset with only sixteen instances of 'MT' and two of 'via' found, compared to 7,173 tweets starting with 'RT'. A button retweet is made by clicking the retweet button and by doing so copying the original tweet. Given that the former option is arguably a more conversational one as it is possible to edit while retweeting (e.g., Highfield et al., 2013), we here focus on this type of retweet. Similar to Haustein et al. (2014), we identified tweets starting with 'RT' as retweets.
In the analysis, we ranked all the digital object identifier references based on the number of retweets and the number of mentions. The most retweeted and mentioned papers and the conversations around these were analysed qualitatively using a combination of visualisation techniques and content analysis.
Data analysis
Data were analysed in three steps. In the first, a bibliographic/bibliometric (Sections 4.1 and 4.2) study of the tweeted articles with a digital object identifier identified in Web of Science (WoS) was performed. From the total dataset of 15,731 individual tweets, all digital object identifier references were identified. A total of 4,499 unique and valid identifiers were found. These URLs were matched to their source publications in WoS using the advanced interface and searching using the DO field tag. The searches had the following form:
DO=(10.1371/journal.pbio.0040105) or

DO=(10.1371/journal.pbio.0050018) ...
Search parameters used were:
Indexes=SCI-EXPANDED, SSCI, A&HCI, CPCI-S, CPCI-SSH, Timespan=All years.
Searches were performed on the 10th September, 2015.
In the second step, the thirty most mentioned and retweeted digital object identifier references were analysed, including any type of publication and not just research papers. The problem of the retweet button outlined above entails that mentioned references not starting with 'RT' and thus not recognised as retweets could include button retweets. Here, we noted the title, research area and source of the publication. Finally, in the third step, a network and content analysis of the collected set of tweets and follow-on conversations was made. In this step, we analysed the threads with at least ten tweets. Only threads including at least one tweet referring to a digital object identifier were chosen. In total, twenty-nine threads matched these criteria. For content analysis, a final purposive sample of fourteen threads was made based on number of participants, volume of tweets, velocity, structure (tree, chain or hybrid) and length (in time).
As correlations between citation counts and social media activity are difficult to interpret, Bornmann (2015a) suggested content analysis of references to research articles. To investigate how the referenced papers were talked about, we used a grounded-theory-influenced, qualitative content analysis (Glaser and Strauss, 1967; White and Marsh, 2006). Different aspects of the comments made in the tweets, as well as the conversation structure were coded using a bottom-up approach. Whenever an interesting aspect was identified, this was marked down for the thread and correspondingly, a legend of different codes was constructed. This was done in an iterative process, so that codes that were invented later in the process were applied to earlier threads upon occurrence. Additionally, codes were harmonised so that passages with similar interpretation were brought under the same code, if applicable. Not every tweet message was coded, instead, relevant passages that were found appropriate for the description of the threads were used for coding. In the end, the codes were sorted typologically based on what kinds of code had been found.
The data collection method captured some non follow-on tweets not including valid digital object identifier strings. There were a few examples of digital object identifier related tweets not using an identifier URL such as '[username] cite the kindle DX type and include DOI number or where was downloaded from' and '[username] Smith, B. (2010). My Life. (Kindle Dx Version). DOI number'. Some tweets written in other languages also included both strings as part of the tweet or usernames mentioned. In our analysis, we used only tweets with valid digital object identifier strings. All tweets regardless of language were used for the digital object identifier collection in the bibliometric part of the study, while only conversations predominantly having English language content were used for the qualitative part.
Results
As noted in Table 1, 4,549 unique digital object identifier strings were found in the tweets. Of these, 4,499 where valid identifier strings searchable in Web of Science. Of these unique identifers, a total of 2,992 papers were identified in Web of Scienvce and their entries were harvested for the bibliometric analysis below. Digital object identifier not matched in Web of Science could either belong to papers in journals not indexed by Web of Science, misspelled identifiers or identifiers pertaining to data sets or other material that is not indexed in the citation database. These 2,992 papers were published within 814 different journals. The total number of authors was 17,603. Although most of the URLs were digital object identifier URLs, some other sources were also linked to. Most of these were references to other tweets (37), nature.com (9) and YouTube (5). Below we give an aggregated overview of the publications referenced by digital object identifier, we also zoom in on the most mentioned and retweeted articles in the set. Finally, we focus on a selection of conversations found in the collected Twitter material.
| Tweets | 15,731 |
| Tweets matching 'dx AND doi' | 13,242 |
| Tweets with a digital object identifier URL | 12,967 |
| Follow-on tweets | 1,039 |
| Tweets added through gap filling | 1,450 |
| Directed tweets | 2,758 |
| Retweets | 7,173 |
| Non follow-on tweets not referencing digital object identifier | 73 |
| Unique digital object identifier URLs | 4,549 |
| Unique non-digital-object-identifier URLs | 442 |
Bibliographic data on tweeted articles
All tweets were collected during a single month and from the publication year of the papers that were referenced in the tweets it is shown that the majority of the tweeted articles in the set are very recent (Table 2). In fact, 80 per cent of the articles were published in the same year as the collection was made, and an additional ten per cent was published the year before. This is in stark contrast with the citation impact of the articles, which is highest about ten years back (around 2005 with a mean citation rate of about 20 citations per year, not counting individual outliers in years with only singular articles tweeted in the set).
| Publication year | No. of papers | Mean citations/article | Mean citations/year |
|---|---|---|---|
| 1963 | 1 | 1,135.0 | 21.8 |
| 1980 | 1 | 0 | 0 |
| 1983 | 1 | 2,487.0 | 77.7 |
| 1985 | 1 | 13 | 0.4 |
| 1989 | 1 | 20 | 0.8 |
| 1990 | 1 | 18 | 0.7 |
| 1991 | 1 | 168 | 7 |
| 1992 | 1 | 133 | 5.8 |
| 1994 | 1 | 330 | 15.7 |
| 1996 | 3 | 153.3 | 8.1 |
| 1998 | 2 | 60.5 | 3.6 |
| 2000 | 2 | 636.5 | 42.4 |
| 2001 | 2 | 2.5 | 0.2 |
| 2003 | 3 | 10 | 0.8 |
| 2004 | 4 | 217.5 | 19.8 |
| 2005 | 10 | 209.3 | 20.9 |
| 2006 | 12 | 136.3 | 15.1 |
| 2007 | 6 | 49.7 | 6.2 |
| 2008 | 11 | 49.7 | 7.1 |
| 2009 | 21 | 20.9 | 3.5 |
| 2010 | 26 | 66.2 | 13.2 |
| 2011 | 45 | 51.1 | 12.8 |
| 2012 | 73 | 18.6 | 6.2 |
| 2013 | 97 | 16.7 | 8.4 |
| 2014 | 275 | 4.2 | 4.2 |
| 2015 | 2,391 | 0.6 | 0.6* |
In Tables 3 and 4 we compare tweet numbers vs. citation impact based on journals with the largest number of individually cited papers within the set. In Table 3 we can see journal names of the most tweeted journals, while in Table 4 we note that journals with many publications are not among the most cited (on average). While to a certain degree this is because a lot of the material is very newly published and, therefore, has not yet attracted many citations, since this bias is (at least in principle) systematic, meaning that all journals have the same disadvantage, one could argue that journals with many tweeted papers are not necessarily having a high impact status. Similar to the findings of Shema et al. (2014), journals such as various PLOS titles, Nature, Cell, Lancet and Journal of the American Chemical Society stand out here. Our findings indicate a dominance by the natural sciences, which stands in some contrast to the findings of Costas et al. (2015). Their Twitter counts were heavily dominated by biomedical and health sciences, with mathematics and computer science, natural science and engineering among the least Twitter mentioned disciplines.
| Rank Pub. | Journal | Recs | TCS | Mean CS | Rank Cit. |
|---|---|---|---|---|---|
| 1 | PLOS One | 546 | 1,241 | 2.3 | 22 |
| 2 | Physical Review Letters | 98 | 1,592 | 16.2 | 7 |
| 3 | Physical Review E | 96 | 87 | 0.9 | 31 |
| 4 | Nature | 61 | 916 | 15 | 8 |
| 5 | Nature Communications | 54 | 63 | 1.2 | 29 |
| 6 | PLOS Computational Biology | 54 | 488 | 9 | 11 |
| 7 | PLOS Genetics | 51 | 137 | 2.7 | 20 |
| 8 | PLOS Medicine | 41 | 3,133 | 76.4 | 2 |
| 9 | PLOS Biology | 38 | 627 | 16.5 | 6 |
| 10 | IEEE Transactions on Computational Intelligence and AI in Games | 36 | 110 | 3.1 | 19 |
| 11 | BMJ | 33 | 108 | 3.3 | 18 |
| 12 | Cell | 31 | 937 | 30.2 | 3 |
| 13 | Scientific Reports | 30 | 18 | 0.6 | 35 |
| 14 | Lancet | 29 | 839 | 28.9 | 4 |
| 15 | Modern Pathology | 29 | 16 | 0.6 | 36 |
| 16 | ZooKeys | 29 | 68 | 2.3 | 21 |
| 17 | Comunicar | 28 | 22 | 0.8 | 32 |
| 18 | ELIFE | 28 | 45 | 1.6 | 24 |
| 19 | PLOS Neglected Tropical Diseases | 28 | 40 | 1.4 | 27 |
| 20 | PLOS Pathogens | 28 | 262 | 9.4 | 10 |
| 21 | Journal of the American Chemical Society | 26 | 41 | 1.6 | 25 |
| 22 | Proc. of the National Academy of Sciences of the United States of America | 25 | 361 | 14.4 | 9 |
| 23 | Neuron | 24 | 96 | 4 | 16 |
| 24 | Parasite | 24 | 50 | 2.1 | 23 |
| 25 | Social Science & Medicine | 23 | 7 | 0.3 | 39 |
| 26 | Current Biology | 21 | 393 | 18.7 | 5 |
| 27 | Nature Genetics | 21 | 174 | 8.3 | 12 |
| 28 | Angewandte Chemie-International Edition | 18 | 80 | 4.4 | 15 |
| 29 | Trends in Ecology & Evolution | 18 | 124 | 6.9 | 13 |
| 30 | Computers in Human Behavior | 15 | 6 | 0.4 | 38 |
| 31 | Nature Biotechnology | 15 | 22 | 1.5 | 26 |
| 32 | Nano Letters | 14 | 6 | 0.4 | 37 |
| 33 | Science | 14 | 2,630 | 187.9 | 1 |
| 34 | Nature Medicine | 13 | 71 | 5.5 | 14 |
| 35 | Organic Letters | 13 | 10 | 0.8 | 33 |
| Rank Cit. | Journal | Recs | TCS | Mean CS | Rank Pub. |
|---|---|---|---|---|---|
| 1 | Science | 14 | 2,630 | 187.9 | 33 |
| 2 | PLOS Medicine | 41 | 3,133 | 76.4 | 8 |
| 3 | Cell | 31 | 937 | 30.2 | 12 |
| 4 | Lancet | 29 | 839 | 28.9 | 14 |
| 5 | Current Biology | 21 | 393 | 18.7 | 26 |
| 6 | PLOS Biology | 38 | 627 | 16.5 | 9 |
| 7 | Physical Review Letters | 98 | 1,592 | 16.2 | 2 |
| 8 | Nature | 61 | 916 | 15 | 4 |
| 9 | Proc. of the National Academy of Sciences of the United States of America | 25 | 361 | 14.4 | 22 |
| 10 | PLOS Pathogens | 28 | 262 | 9.4 | 20 |
| 11 | PLOS Computational Biology | 54 | 488 | 9 | 6 |
| 12 | Nature Genetics | 21 | 174 | 8.3 | 27 |
| 13 | Trends in Ecology & Evolution | 18 | 124 | 6.9 | 29 |
| 14 | Nature Medicine | 13 | 71 | 5.5 | 34 |
| 15 | Angewandte Chemie-International Edition | 18 | 80 | 4.4 | 28 |
| 16 | Neuron | 24 | 96 | 4 | 23 |
| 17 | Proc. of the Royal Society B-Biological Sciences | 10 | 34 | 3.4 | 43 |
| 18 | BMJ | 33 | 108 | 3.3 | 11 |
| 19 | IEEE Transactions on Computational Intelligence and AI in Games | 36 | 110 | 3.1 | 10 |
| 20 | PLOS Genetics | 51 | 137 | 2.7 | 7 |
| 21 | ZooKeys | 29 | 68 | 2.3 | 16 |
| 22 | PLOS One | 546 | 1,241 | 2.3 | 1 |
| 23 | Parasite | 24 | 50 | 2.1 | 24 |
| 24 | eLife | 28 | 45 | 1.6 | 18 |
| 25 | Journal of the American Chemical Society | 26 | 41 | 1.6 | 21 |
| 26 | Nature Biotechnology | 15 | 22 | 1.5 | 31 |
| 27 | PLOS Neglected Tropical Diseases | 28 | 40 | 1.4 | 19 |
| 28 | ACS Nano | 10 | 13 | 1.3 | 40 |
| 29 | Nature Communications | 54 | 63 | 1.2 | 5 |
| 30 | Blood | 12 | 11 | 0.9 | 37 |
| 31 | Physical Review E | 96 | 87 | 0.9 | 3 |
| 32 | Comunicar | 28 | 22 | 0.8 | 17 |
| 33 | Organic Letters | 13 | 10 | 0.8 | 35 |
| 34 | Macromolecules | 12 | 9 | 0.8 | 38 |
| 35 | Scientific Reports | 30 | 18 | 0.6 | 13 |
Most articles tweeted were in the form of peer reviewed journal articles or reviews, together with some editorial material (Table 5). It is also worth noting that most tweeted articles are published by authors from well renowned U.S. and British universities, such as Harvard, Oxford and University College London (UCL). Another striking feature is that Rhodes University (South Africa, ranked in QS as between #501-550) is among the five institutions with most tweeted articles in the set (Table 6). The large English speaking dominance is also seen based on the country of the authors of the tweeted articles in the set (Table 7). Most authors come from English-speaking countries (US, UK, AU, CA), while the main European countries and China are also found at the top.
| Document Type | Recs |
|---|---|
| Article | 2,608 |
| Review | 163 |
| Editorial material | 155 |
| News item | 25 |
| Letter | 22 |
| Correction | 5 |
| Article; proceedings paper | 4 |
| Book review | 4 |
| Proceedings paper | 3 |
| Article; book chapter | 2 |
| Biographical-item | 1 |
| Institution | Recs |
|---|---|
| Harvard University | 120 |
| University of Oxford | 77 |
| Unknown | 67 |
| University College London | 64 |
| Rhodes University | 63 |
| University of Cambridge | 61 |
| University of Sydney | 50 |
| Chinese Academy of Scienc | 46 |
| University of California Berkeley | 45 |
| Stanford University | 44 |
| University of Pennsylvania | 44 |
| University of Michigan | 43 |
| University of Toronto | 43 |
| Centre National de la Recherche Scientifique | 40 |
| Imperial College of Science Technology & Medicine | 40 |
| University of Washington | 38 |
| University of Edinburgh | 37 |
| University of Alberta | 34 |
| Massachusetts Institute of Technology | 33 |
| University of Copenhagen | 33 |
| University of Manchester | 33 |
| Yale University | 32 |
| Cornell University | 31 |
| University of Bristol | 31 |
| University of Tokyo | 31 |
| University of Illinois | 30 |
| Country | Recs | meanGCS |
|---|---|---|
| USA | 1,254 | 10.2 |
| UK | 615 | 9.8 |
| Germany | 268 | 4.6 |
| Canada | 236 | 4.5 |
| Australia | 213 | 4.2 |
| France | 199 | 6.1 |
| Peoples Republic of China | 185 | 1.6 |
| Spain | 168 | 2.7 |
| Netherlands | 153 | 4.4 |
| Japan | 148 | 2.7 |
| Italy | 115 | 3.9 |
| Switzerland | 113 | 5.3 |
| South Africa | 97 | 0.9 |
| Unknown | 94 | 17.8 |
| Sweden | 85 | 3.2 |
| Belgium | 81 | 5 |
Bibliometric analyses of the tweeted articles
To get an overview of what the tweeted papers actually are about, some aggregated information is given in an analysis of the bibliographical coupling of the tweeted articles, as well as from co-word analyses of terms used in the tweeted articles selected in this study. This will serve as a basis for understanding the differences between the actual conversations and the referents of these Twitter conversations. Are the tweets generally about what the tweeted papers are about?
Bibliographic coupling
Bibliographic coupling is based on the quantitative analysis of the literature within the set, the so called research front of the research found in the downloaded papers (Persson, 1994; Åström, 2007). Bibliographic coupling in a set of papers can be measured at a number of levels. At the basic level, the article, it calculates the degree of relatedness of all article pairs in the set based on the number of cited references each pair share with each other (Kessler, 1963). Here, bibliographic coupling was performed at the aggregated level and the results visualised in a citation map for visual inspection and interpretation. Data were calculated at the journal level, meaning that coupling between journal titles depended on the number of shared references in articles published in each journal. In this way, we found out which journals were closely related in terms of subject area their articles belonged to based on what digital object identifiers were mentioned in tweets during the month the data collection was done.
In Figure 1, bibliographic coupling of journals is visualised using VOSviewer, a software tool for calculation and clustering of bibliographic analyses (van Eck and Waltman, 2014). The results are visualised in different views depending on its purpose. Here, journal titles of the 2,992 papers identified in are shown based on the journal level bibliographic coupling. This view features a heat map of journal titles that could analogously be interpreted as a topographic map. Location of a title implies location in two-dimensional space, and the closer two titles are with to other, the closer reference lists in articles published in each journal have been found to be. The coloration resembles a map, of densities, where red is found in the densest peaks in terms of bibliographic coupling strength, whereas yellow, green and blue signifies gradually lower density. PLOS One stands out as the most prominent journal, due to the number of articles mentioned by way of the digital object identifier in the study. Again, this is similar to the journals standing out in the blogosphere (Shema et al., 2014). It is also clear that the PLOS One papers are oriented quite evenly to journals in many different subjects, as would be expected, since it is a general purpose journal. To some degree, the surroundings of the journal are filled with journals that publish material that is more attainable to the public than would be expected from a bibliometric selection based on academic citations. Inter- and multidisciplinary research such as social medicine, public health, ecology/environmental science, as well as specific titles in the social sciences; Scientometrics and Futures stand out. In the mid-section of the map more research in biochemistry and medicine stand out, while physics and chemistry are found in the rightmost part of the map. These latter groups are research areas that would be found in a traditional citation analysis performed within a cross section of all published research. The results relate quite well to the findings of Costas et al. (2015), that biomedical and life sciences, as well as life and earth science dominate, while mathematics and computer science is less well represented within Twitter mentions. One thing that stands out in the map is that many titles allude to up-to-date research. Based on titles having such terms as current, emergent, advances, trends, and, again, futures we could postulate that research mentioned on Twitter is more forward-looking, than historical in nature in comparison with traditional academic referencing.
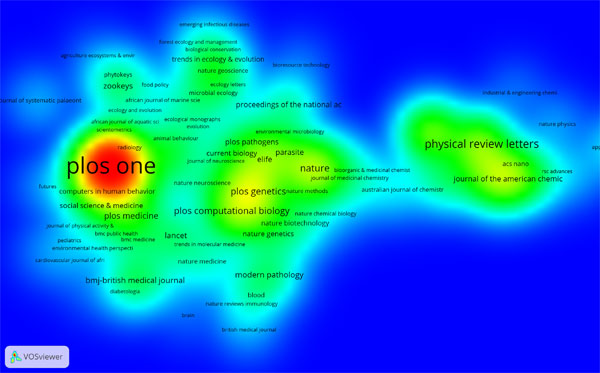
Figure 1: Bibliographic coupling of sources (Of 814 source publications - journals and conference proceedings - 263 have at least 2 articles).
Term based analyses of keywords and topic terms
Another way to identify what literature is mentioned in the tweets is to read the articles. Here, instead, we will employ quantitative methods of text analysis to analyse the aggregated content of the literature, sometimes described as distant reading (e.g., Moretti, 2013). Here we will employ two different techniques for aggregating information to describe what literature is mentioned in the digital object identifier set. First, we will use author-generated keywords from the Web of Science set of 2,992 articles that were identified and view them based on their co-occurrence at the article level. The pre-processing of data was done using the Science of Science (Sci2) Tool (Sci2 Team, 2009) and the visualization was then prepared in Gephi, using the Force Atlas 2 algorithm (Bastian, Heymann and Jacomy, 2009). Second, a similar visualisation based on title and abstract of the 2,992 articles will be performed. This time, so called noun phrases, meaning phrases of nouns, pronouns or combinations of the two word classes are constructed and subsequently mapped at article level in a visualisation in VOSviewer (van Eck and Waltman, 2014). Additionally the phrases will be clustered according to how sets of topics could be delineated.
Keywords based analysis (Gephi)
In Figure 2 we introduce a keyword map based on the keywords added in the papers in the group of 2,992 articles. Keywords found at least two times are shown and the maximum number of occurrences is 457. Node size is proportional to occurrence and links indicate that the pair has been found in one single article. As in the journal map above, we note a wide selection of terms and concepts describing the articles. Some terms are found closer to each other and by viewing them one could identify clusters that are meaningful. The interpretation starts from the top, and we then find concepts relating to health, medicine and the life sciences. Interestingly enough, neither these areas, nor basic science such as physics and chemistry stand out very well. Instead, social science topics in a broad meaning are the most prominent. These range from information technology topics bordering to mathematics, social medicine and further on to information science, media studies, education and gender studies. This is even more prominent in Figure 3, where the social science and social issues section of the map is enlarged. In the centre of this part, social networks is found close Internet and collaborative learning, and below, social media borders keywords such as emotion, content analysis, MOOC and higher education. To some degree, a circularity of the Twitter - academia complex must be noted here: to a certain degree research articles mentioned in tweets are expressly focused on social media, a correspondence that could not be called a coincidence.
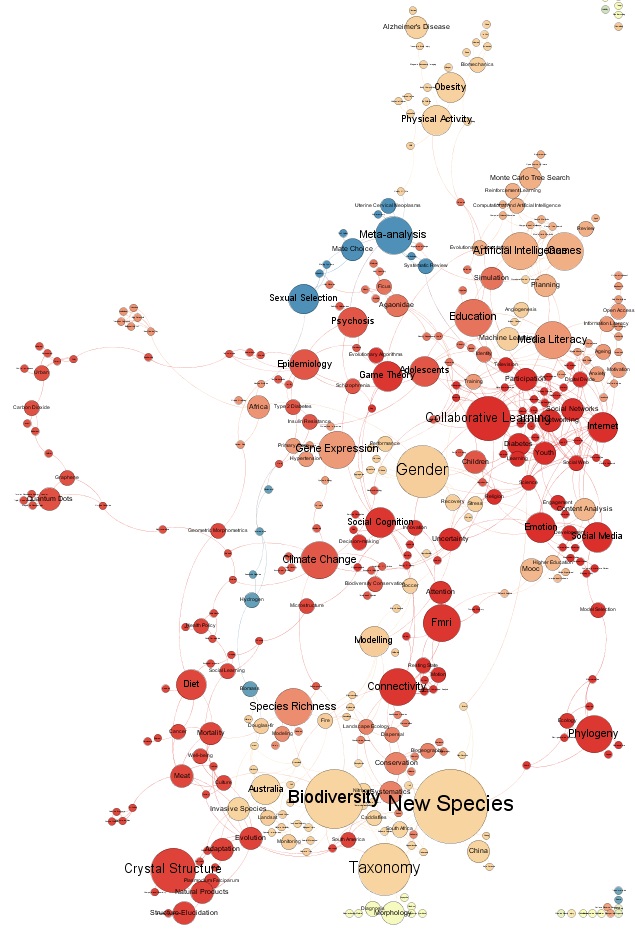
Figure 2: Author-based keywords (WoS).
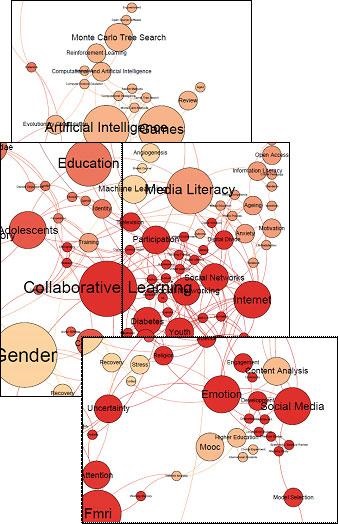
Figure 3: Keywords, zoomed in.
VOSviewer term based analyses
The following term based analyses are based on noun phrases constructed by the algorithm from words in title and abstract fields of the articles found in Web of Science. Of 72,807 terms, 1,147 are found 10 or more times in the set. Of these, 688 terms were selected based on a term frequency-inverse document frequency (tf-idf)=60 %. This means that commonly found terms found in the set are omitted (such as paper;, study, e-service, etc). In VOSviewer, a density visualisation was performed using the proprietary mapping and clustering algorithms of VOSviewer introduced by its authors, that, in essence maps terms closer to each other if they often occur together and at the same time clusters them based on a similar closeness calculation (van Eck and Waltman, 2014), yielding a term based map (Figure 4). The clustering algorithm used in VOSviewer Word length was set to 30 letters and the longest phrase consists of 27 letters and the mean number of letters were 9.0 (std.dev=4.2). Nine clusters were identified in the set. The visualisation could be interpreted visually, with help of a list of frequently occurring terms in each cluster (Table 8). Starting with the red cluster (1), quite technical terms such as structure, state and property are found, indicating terminology to describe research. Next, the green cluster (2) signifies the actual research process in a clinical medical setting, with terms like patient, treatment, participant and outcome. The dark green cluster (6) next to that is in the medical sciences, but time rather about social medicine and epidemiology, with terms like death, report, child but also hiv, Africa and recommendation. The blue cluster (3) indicates lab work, predominantly in cancer and gene research, while the adjacent grey cluster (7) focused on biochemistry, with terms like sequence and infection, but also dna, genome, sequencing and antibiotic. Next, the yellow cluster is biological with terms like species, evolution, plant and ecosystem, while the purple cluster (6) sits firmly in survey methodology and the social sciences with terms such as practice and survey, science, and further below policy, education and learning. Lastly, there are two unidentified clusters (8 and 9) with single terms, schizophrenia and higher level.
To a certain degree, the term based clustering based on title and abstract shows that a rather high share of the research found in the DOI-mentioned articles are found in biochemistry and medical research, while the social sciences do not turn out so strongly here. This is probably because there is a high yield of applied research, mainly focusing on health, while base research to some degree is found in biochemistry, but also in ecology, zoology and evolutionary biology.
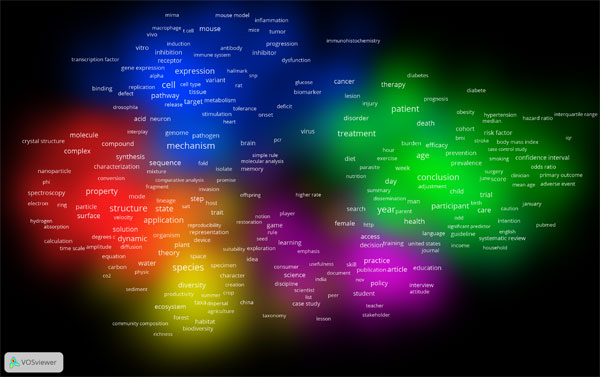
Figure 4: Term visualisation. 688 terms occurring at least ten times were mapped and cluster resolution was set to 1.40, to generate nine distinct clusters.
| Cluster 1 | n | Cluster 2 | n | Cluster 3 | n | Cluster 4 | n |
|---|---|---|---|---|---|---|---|
| structure | 324 | year | 311 | mechanism | 299 | species | 337 |
| state | 195 | conclusion | 276 | cell | 292 | evolution | 136 |
| property | 183 | patient | 270 | gene | 214 | diversity | 127 |
| application | 175 | treatment | 222 | expression | 184 | composition | 95 |
| dynamic | 174 | risk | 212 | protein | 176 | origin | 84 |
| formation | 166 | age | 198 | pathway | 141 | plant | 84 |
| theory | 141 | participant | 165 | cancer | 109 | trait | 72 |
| complex | 115 | outcome | 153 | regulation | 101 | ecosystem | 70 |
| material | 114 | background | 145 | mouse | 99 | female | 69 |
| solution | 105 | day | 120 | mutation | 92 | organism | 66 |
| Cluster 5 | n | Cluster 6 | n | Cluster 7 | n | Cluster 8 | n |
| article | 126 | death | 92 | sequence | 132 | schizophrenia | 11 |
| practice | 118 | report | 84 | infection | 123 | ||
| person | 113 | child | 83 | dna | 68 | Cluster 9 | n |
| survey | 108 | efficacy | 70 | genome | 63 | higher level | 19 |
| country | 89 | drug | 69 | sequencing | 63 | ||
| science | 82 | dose | 55 | strain | 63 | ||
| access | 77 | administration | 40 | virus | 57 | ||
| experience | 77 | africa | 40 | pathogen | 51 | ||
| policy | 68 | recommendation | 40 | bacterium | 50 | ||
| education | 64 | min | 39 | pcr | 31 |
Twitter mentions and retweets
Detailed information including publication titles, discipline, source and number of mentions and citations are given in Tables 14 and 15 in the Appendix. There are larger figures for retweets than for digital object indentifier mentions (Figure 5) which is probably a result of retweeting requiring less effort than posting an original tweet. There are a couple of similarities with the results from the analyses in 4.1 and 4.2. Biology and medicine are the most mentioned research areas, and articles from the sciences are more often mentioned than social sciences, even though there are examples of mentioned papers from political science, research and education and library and information science (Figure 6). The most prominent journals in this respect are PLOS journals, where PLOS One dominates with thirteen mentioned articles (Figure 7). Nature has five mentions. The retweet set was even more dominated by the sciences, with biology and medicine being the more prominent areas (Figure 8). The domination by PLOS journals was not as evident in the retweet set, with seven PLOS One articles and six articles from other PLOS journals (Figure 9). Most of the mentioned and retweeted items were from 2015 (28 and 27, respectively), so it seems as the recent published research is more likely to be mentioned or retweeted, even though there were examples of older articles in this set. A difference between the top lists is that references to Figshare were included among the most retweeted digital object indentifiers, however, the most striking difference is that the by far most retweeted item, "Crickets are not a free lunch: protein capture from scalable organic side-streams via high-density populations of Acheta domesticus", retweeted 1,014 times, is not included among the top thirty mentioned items. There was some overlap between the top digital object indentifiers with eight items present in both sets, but overall these findings indicate that what is most often retweeted is not necessarily what is most often mentioned.
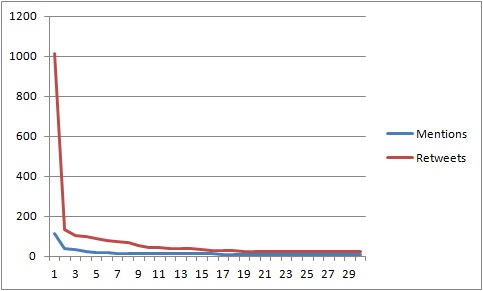
Figure 5: Histograms of the thirty most often mentioned (blue) and retweeted (red) digital object identifiers.
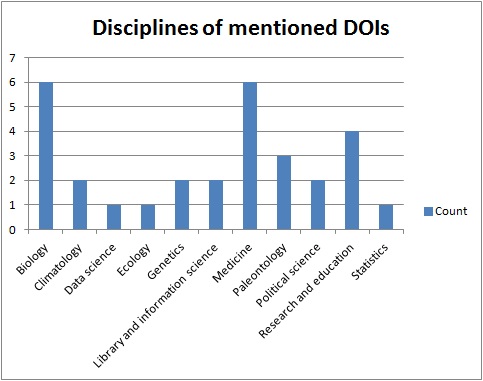
Figure 6: Disciplines of thirty most often mentioned digital object identifiers.
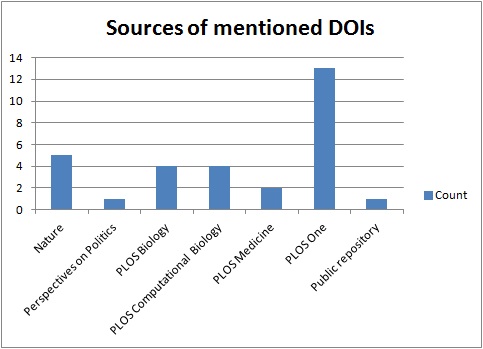
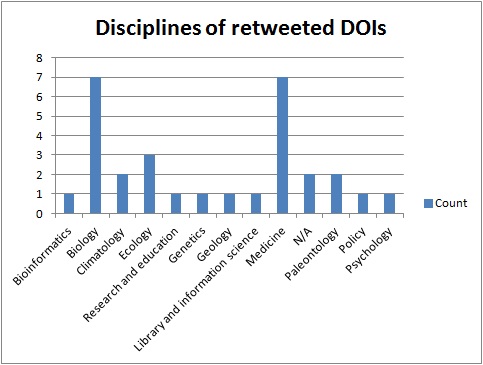
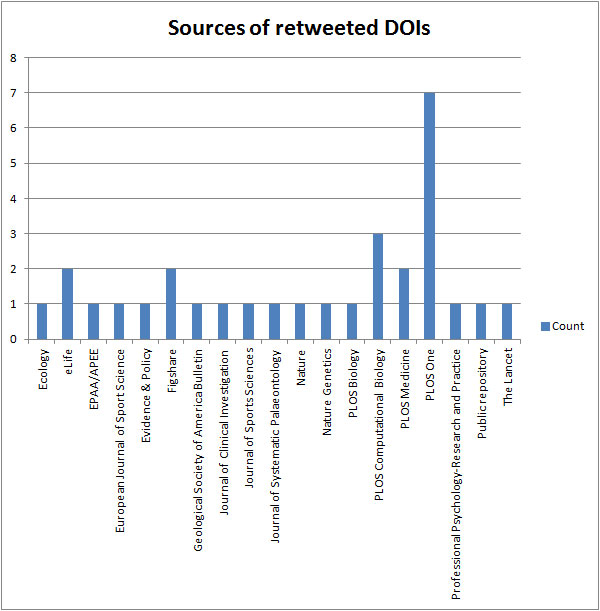
Figure 9: Sources of thirty most often mentioned digital object identifiers.
Conversation threads
Twitter conversation kinds
In this study, twenty-nine conversation threads with more than ten interacting tweets were selected for an in-depth analysis of structure and contents. Table 9 shows descriptive statistics over these threads. The longest thread consisted of fifty-six and the median number of tweets was fifteen. Twitter conversations included between on and eleven participants with a median of four. The other metrics are velocity of the conversation, indicating the number of tweets per hour ranging between 0.0014 and 51 with a median of 1.2 tweets per hour and lastly a time length of the conversation lasting between 0.5 and 21,900 hours with a median of 14.5.
| Mean | Median | Std.dev | Min | Max | |
|---|---|---|---|---|---|
| Volume | 18.97 | 15 | 10.78 | 10 | 56 |
| Participants | 4.28 | 4 | 1.89 | 1 | 11 |
| Velocity | 5.84 | 1.2 | 10.98 | 0.0014 | 51 |
| Length | 806.66 | 14.5 | 3,989.14 | 0.5 | 21,900 |
Aggregated characteristics of a Twitter conversation pertains to various forms of interaction. As shown in Figure 10, the node structure of a Twitter conversation could take on many different forms.
In analysing the aggregated features of the Twitter conversations, one could describe the visual appearances of the interactions between users. An interaction could take the form of a chain, in which each (or most) of the follow-on is consecutive and after each other in a long line. Alternatively, the discussion can have a star-shape, in which a central tweet is approached in many different conversations. Hybrid conversations could be described as connections were both the temporality of the chain is found, but where many different follow-on discussions are started later in the conversation and that does not interact with the original tweet. Within these segmented conversations each new conversation thread that is started could be labelled a bifurcation. Among the twenty-nine threads that were analysed eleven had chain form, one was shaped as a star and seventeen were hybrid with bifurcations along the line of conversation.
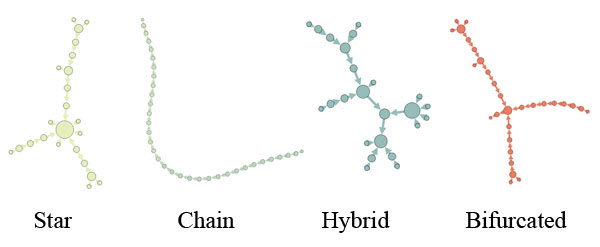
Figure 10: Aggregated features of Twitter conversations.
Of the twenty-nine Twitter threads that were chosen, fourteen were analysed in depth, in terms of the actual conversations that was related to the digital object identifier reference.
Twitter conversations: description
In tables 10-13, the fourteen threads chosen for qualitative analysis are described. For each thread indicated by an ID, thread type, and the measures mentioned above is calculated.
| ID | Type | Velocity | Length | Volume | Participants |
|---|---|---|---|---|---|
| 1 | Star | 0.2 | 52 | 10 | 7 |
| 2 | Hybrid | 0.8 | 23 | 19 | 4 |
| 3 | Chain | 0.7 | 25 | 18 | 5 |
| 4 | Hybrid | 1.9 | 29 | 56 | 4 |
| 5 | Hybrid | 1.1 | 22.5 | 25 | 5 |
| 6 | Hybrid | 0.02 | 840 | 19 | 5 |
| 7 | Hybrid | 2.1 | 7.5 | 16 | 5 |
| 8 | Chain | 1.2 | 11 | 14 | 1 |
| 9 | Chain | 0.1 | 100 | 11 | 6 |
| 10 | Chain | 0.2 | 53 | 12 | 3 |
| 11 | Hybrid | 0.0014 | 21,900 | 29 | 4 |
| 12 | Hybrid | 30 | 0.5 | 14 | 2 |
| 13 | Chain | 1.2 | 10 | 12 | 3 |
| 14 | Hybrid | 12.2 | 1 | 11 | 3 |
In Table 11, title and source journal for the first article indicated with a digital object identifier reference (if more than one is given in the conversation) in each conversation (ID number corresponds to the ID in the other tables in this set). As noted, many conversations were based on articles from the PLOS and in a count of the fifty most tweeted sources within the set (not shown here, half of the titles belonged to the PLOS consortium) it is almost exclusively journal articles from Public Libraries of Science (PLOS) that are found in more than singular numbers. The spread of research areas is mainly focused on the (bio-) sciences, while policy and education studies are found singularly within the twitter conversations. Another relevant observation is that a large part of these publications are open access publications. This could perhaps be a sign of researcher vanity: publishing accessible articles and self tweeting?
| ID | Source | Title |
|---|---|---|
| 1 | PLOS One | Plastic accumulation in the Mediterranean Sea |
| 2 | PLOS Computational Biology | Speeding up ecological and evolutionary computations in R; Essentials of high performance computing for biologists |
| 3 | PLOS One | The repertoire of Archaea cultivated from severe periodontitis |
| 4 | The New England Journal of Medicine | Cell-free DNA analysis for non-invasive examination of trisomy |
| 5 | PLOS One | Abnormalities of AMPK activation and glucose uptake in cultured skeletal muscle cells from ndividuals with chronic fatigue syndrome |
| 6 | The Lancet | Efficacy of paracetamol for acute low-back pain: a double-blind, randomised controlled trial |
| 7 | Journal of Clinical Investigation | Quantification of mutant huntingtin protein in cerebrospinal fluid from Huntington's disease patients |
| 8 | Figshare | Database - medical education - Part I - The double standard test. (version 1.0) |
| 9 | PLOS One | Fgf21 impairs adipocyte insulin sensitivity in mice fed a low-carbohydrate, high-fat ketogenic diet |
| 10 | Applied machine intelligence and informatics (SAMI), 2011 IEEE 9th International Symposium on | Identification of carnatic raagas using hidden markov models |
| 11 | Radiography | A taxonomy of anatomical and pathological entities to support commenting on radiographs (preliminary clinical evaluation) |
| 12 | City: analysis of urban trends, culture, theory, policy, action | Response: Building a better theory of the urban: A response to 'Towards a new epistemology of the urban?' |
| 13 | City: analysis of urban trends, culture, theory, policy, action | Towards a new epistemology of the urban? |
| 14 | Neuroimage | Sensible decoding |
Content analysis of Twitter conversations
Coding was done bottom-up as described in the method section and four distinguished types were established. The types correspond to contents of singular tweets, meta (or communication), conversation (at the aggregated level) and non-academic. These types will be used to describe the Twitter conversations that were chosen in a conceptual manner. The fourteen Twitter conversations that were analysed are included in Table 12. Each row includes the text of the full tweet, or, if it is the title of the digital object identifier-referenced article, the label [Title], which could be looked up in Table 11. It also includes the interpreted topic of the conversation, and the codes that were used to describe the conversation. In Table 13, the themes and the codes that were developed for the interpretation in the qualitative content analysis are described. Below, we present an interpretation of the conversations by thematically illustrating our findings.
| ID | Start tweet | Topic | Codes |
|---|---|---|---|
| 1 | [Title]* | Fisheries | Tech, Ti, Co |
| 2 | [Title] | Computation in R | Cr, AffCr, PoImg, Arg, MQ, MA, IC |
| 3 | #PLOSONE: [Title] | Periodontitis | Cr, TP, Sarc |
| 4 | An invasive blood test may be a better way to diagnose Downs syndrome in fetuses at 10-14 weeks of pregnancy. | Down's syndrome, blood test | Cr, Sarc, Ti, Th, #, Arg, Fur |
| 5 | [Title] | Cronic fatique syndrome | Mon, Aff, Coll |
| 6 | Non-opioid ED analgesia. #AAEM15 #FOAMed | Analgetics, Physical therapy | Ti, Aff, Coll, # |
| 7 | We detected mutant huntingtin protein, the cause of Hunting-ton's disease, in cerebrospinal fluid for the first time | Huntington's disease | Ti, Coll, Aff, MQ, MA, TP |
| 8 | The [username] and their school of [user-name] also have #big-pharma ties ( e.g., [username] ) | Big pharma | Arg, # |
| 9 | Low-carb diet impairs insulin sensitivity in mice. But they don't tell it's casein-based. | LCHF diet | Ti, Cr, AffCr |
| 10 | Have you ever wondered how apps like Shazam magically detect songs in a very short time? The key is Parson's code | Music detection | Gen, Mon, TA |
| 11 | hey bro! Don't forget gmail | Radiography | Gen GQ, TA, Aff, MQ, MA, Me, # |
| 12 | *long-ass whistle* read from "I am..." all way down to "...replicable city." damn. | Urban studies, theory | Rant, Me, Quot, Aff |
| 13 | It's not clear to me, reading Brenner and Schmid, why we even need an urban theory, ~if~ the urban condition is so planetary and total. | Urban studies, epistemology | Quot, Rant, Me, Cr |
| 14 | Interesting commentary - what is MVPA orientation decoding in fMRI actually measuring? | Neuroimaging | Att, MQ, Arg, Sarc |
| Type | Code | Explanation | Example |
|---|---|---|---|
| Tech | Th | Technical issues | e.g., "Link doesn't work" |
| Content | Ti | Title retweeet | Title is retweeted in full or in parts. No other user input |
| Quot | Quote from article | e.g., "'authors could tone down the hyperdrive on their academic prose, so as not to burn the retinas of those less attuned' lol" (note the "lol" comment after the quote. | |
| DX | Doi as Example | e.g., "I want to try periodicity measurement on images as in http://t.co/FSzsvXHWwb" | |
| PoImg | Pointing out specific part in the article | e.g., https://twitter.com/jaimedash/status/ 583757221412151296/photo/1 | |
| Co | Comment on result | Either in own words or by quoting a short passage of the text: e.g., "between 1.000 and 3.000 tonnes!" | |
| GQ | General Question | e.g., "I would be interested in your opinion of this" | |
| MQ | Methodological Questions | e.g., "What software do you use to read the files?", "Do you have a comparison re..." | |
| MA | Methodological answer | Answer to the question, e.g., "we have sens/spec/acc for each of the..." | |
| Cr | Critical comments (topical) | e.g., "I find it odd that..." | |
| Fur | Discussion is going further than the content of the article | In an article on blood work for test of Down's syndrome: discussant starts discussion about insurance policies not related to the original conversation or DOI. | |
| Communication (or: meta) | Aff | Affirming result or heads up | e.g., "Great Article!" |
| Coll | Collegial discussion no arguments | e.g., "Very promising to see them get results in this area" | |
| AffCr | Affirming Critical comment | e.g., "Good point. I had not thought about that" | |
| IC | Invite college in discussion | e.g., "[username] to the rescue?" | |
| Description of conversation | *Arg | Argumentation between responders | Back-and-forth |
| *Mon | Monologue | A number of tweets from the same author | |
| *TS | Turned scientific | Discussion turns scientific with the introduction of a DOI in a comment. | |
| *Pros | Discussion turned prosaic | Goes from academic to generic. e.g., in the conversation about "hubby just went to the dentist today. Dare I read this?" | |
| Non academic | Gen | General Tweet (No DOI in first) | First tweet not academic in nature. |
| Sarc | Sarcasm | e.g., "#facepalm" Note the hashtag. | |
| Me | Meta | Commenting stance, e.g., "being nosey" | |
| Rant | Ranting on contents | "'Please, fellow geographers, leave the boxes to the sociologists, who absolutely worship them.' this gets raw lol." |
Content
The biggest category is content, where aspects of what was said in the various tweets were coded. The codes are sorted by the level of complexity, so that a tweet only containing the title (Ti) is the simplest form. Here, no other user input is made other than the inclusion of a digital object identifier reference to the material in question. A quote from an article, followed by an identifier reference is another simple kind of tweet. Sometimes the quote is followed by an exclamation mark or internet slang such as 'lol' (laugh out loud).
Other kinds of content based tweets are tweets that exemplifies with a digital object identifier-referenced article, such as 'I want to try periodicity measurement on images as in [DOI]' (DX) or a reference to a specific part in a digital object identifier-referenced article such as an image (PoImg). More content based comments regard comments to the content of a digital object identifier-referenced article, either in the author's own words, or by quoting a short passage and then giving a verbal comment.
Questions posed by participants could be formed in a general fashion (GQ), such as I would be interested in your opinion of this or, more frequently, based on methodological aspects (MQ), e.g., What software do you use to read the files?, Do you have a comparison re... Methodological answers (MA) to those questions are often given in a direct form, e.g., we have sens/spec/acc for each of the... Lastly, critical thoughts (CR) are sometimes posed, such as e.g., I find it odd that... Sometimes these are sustained by another participant that responds with an affirming critical comment (AffCR) e.g., Good point. I had not thought about that.
Meta level
At the meta level, we find such statements as affirming comments or simple giving credit without focusing on the contents (Aff) e.g., Great Article! or Thanks for sharing your article. It was an interesting read. Other tweets address some of the content in a collegial manner (Coll) e.g., Very promising to see them get results in this area. Another meta action that is invoked at one time is the calling for help from another Twitter user to solve a question, e.g., [username] to the rescue? Some people do not ask for help but find seemingly obvious information by themselves and add a hashtag (#) to inform about it e.g., #letmegooglethatforyou. In this category, technical issues (Tech) are incorporated, although only one instance of such a mention was found e.g., Link doesn't work.
Conversation
The style of the conversations at the aggregate level could be distinguished by looking at the style of the whole conversation. There are monologues (Mon), including a long stream of tweets from the same participant, sometimes written in parts (1/3, 2/3, 3/3) and either including quotes from the article in question, or a longer argument that does not fit in one single tweet. Another style is the argument (Arg), where two or more participants argue back and forth on a topic related to the research in the article whose digital object identifier is mentioned.
Another distinguishing feature of the conversations is that a conversation switches between being academic in character and non-academic, or prosaic. In the first case, the conversation turns academic with the introduction of a digital object identifier in a comment (TA), while in the other (TP), the discussion turns prosaic. An example from the conversation on periodontitis one participant responds to the original tweet: hubby just went to the dentist today. Dare I read this?The conversation never returns to the academic realm after this. On the other hand, one Twitter conversation in the set goes further (Fur) than the content of the article; in relation to an article on blood work for test of Down's syndrome, the conversation turns to a discussion about insurance policies not related to the original conversation or the digital object identifier.
Non academic
The last kind of Twitter conversation practices that were identified could be labelled non-academic, since they do not involve any academic (or in some cases intellectual) content. First, there are general tweets, not relating to academic content in any way. Such conversations could turn academic (TA), but does not start as such. An example start Tweet in the collection is hey bro! Don't forget gmail, and another is Have you ever wondered how apps like Shazam magically detect songs in a very short time? The key is Parson's code, although the second indicates that there is some kind of answer to the generic question. Other indications of non-academic content is sarcastic comments (Sarc) e.g., #facepalm, or the tweet about #letmegooglethatfor you above. Note the hashtag in these examples. There are also comments at the meta level (Me), where a participant comments his/her stance towards the issue, by adding being nosey. Last, we find statements that are interpreted as ranting (Rant), 'Please, fellow geographers, leave the boxes to the sociologists, who absolutely worship them.' this gets raw lol.
In summary, the conversation style between participants was very varied and one could find both formal communication as well as tweets consisting almost entirely of Internet slang. Writing in the tweets is often very reflexive in the sense that authors seem to have taken on an internet persona and sometimes using slang and emoticons to convey mental feelings to their words. In a few rare instances communication is almost cordially polite, e.g.
[username] do you mind if I ask, is the CSF DNA neural in origin?
The answer, though, is short:
[username] with* haemoglobin.;
This still rends a polite appreciation from the first participant:
[username] Thanks for the clarification - much appreciated
Following up on Thelwall et al. (2013), we see that there is conversation beyond the digital object identifier references, but it does not seem to give deep insights into the reactions to the content referred to. Some tweets in the conversations could also be related to the more practical issues such as Wi-Fi passwords and dinner plans found by Gonzales (2014).
Conclusions
In this paper, we have demonstrated and exemplified a method for collecting conversations related to research articles and other academic sources. We first outlined the journals, disciplines and topics referred to, then looked at the most often mentioned and retweeted scientific content and finally analysed fourteen conversational threads emanating from a digital object identifier reference. The first observation made was that the tweets referring to a identifer did generate some follow-on conversation. By looking at tweets in relation to the conversation they can be analysed in their contexts. Such an analysis could be used as an extension to current altmetric methods. In the set of tweets, 2,992 unique papers were referred to. There was a quite wide range of topics or research areas referred to, both with mentions and retweets, but there was also a clear emphasis on the natural sciences, with social science being less visible. In related research, similar findings were made by Costas et al. (2015) and Shema et al. (2014). However, while biomedical and health sciences dominated the Twitter usage in the former study, our results are more diverse discipline-wise, with more references to computer science. This might be a consequence of aggregating the analysis to the most referenced source titles, which would not show large numbers of sources with few referenced papers each.
In a small qualitative analysis of Twitter conversations such as the one performed in this study, it is not easy to assess how representative the selected sample is of the whole population. Nevertheless, differences between the most mentioned digital object identifiers and the most retweeted identifiers were found that potentially has consequences for how to use Twitter data to measure impact. Eight identifiers were shared between the top mentions and the top retweets while only one frequently mentioned identifier was also discussed in one thread. Additionally, two frequently retweeted identifiers were discussed in threads. This point is potentially important as the Twitter indicator used by the service Altmetric.com, for example, only considers the number of users tweeting or retweeting a publication (Costas, et al., 2015). Here, it was not the most retweeted items that were most often mentioned and it was not the most mentioned or retweeted identifiers that were most talked about in a conversation context. Therefore we propose that an impact metric should be extended to include measures of visibility, spreadability and the ability to spark discussion to represent Twitter activity around scholarly work to be truly meaningful.
While the analysed conversations were selected purposively, some care was taken to maintain the ratio of research areas from the set of twenty-nine threads that were found with more than ten comments. Biology and health sciences were in the broad sense dominant, while certain data science, mathematical and social sciences also stand out. The conversations were very varied, ranging from serious discussion of concepts and methodology, to prosaic opinionated pieces with value-laden language, often amplified by the use of punctuation, emoticons and internet slang.
In our qualitative content analysis, we found that references to digital object identifier URLs were mainly used for promoting a paper, as conversation starter or as arguments in a discussion. It would be wise to separate the different usage types from each other in an analysis. By doing this we could for example analyse how maps based on non self-promoting references change over time. The self-promoting tweets are of interest as well, for example in an analysis of how or if they have impact on the success of an article. Our findings suggest that for judging scholarly impact, Twitter data and conversations should be used with caution but that it might have a potential for gauging social impact. Hence, we propose that some research on Twitter activity in relation to research can be shifted towards analysing how the public reacts to scientific reports, or what the public seems to find interesting. Collecting tweets referring to identifiers makes it possible to analyse some reaction to the published research. Collecting follow-on conversation makes it possible to analyse the reaction to the tweets referring to the research, thus painting a richer picture of how Twitter users react to research. While this particular study found few examples of extensive or substantial conversations or discussions around the identifiers, further research over longer time periods than one month is needed to confirm whether such communication exists on Twitter and of what relevance these discussions are. It would also be useful to search for other types than digital object identifiers, for example references to popular sources titles, especially if the research question regards the public interest.
Finally, from the large share of titles from PLOS, we could also presume that there is a high open access share in the mentioned articles, although this was not investigated here. Neither was the sender of each tweet investigated, which means that we are not able to discern any motives for posting the tweet that originated the conversation.
Acknowledgements
The authors wish to thank the anonymous referees for their comments, which were helpful for improving the quality of the paper.
About the authors
Dr. Gustaf Nelhans is Senior lecturer at the Swedish School of Library and Information Science (SSLIS) at University of Borås, SE-501 90 Borås, Sweden. His research focuses on the performativity of scientometric indicators as well as on the theory, methodology and research policy aspects of the scholarly publication in scientific practice using a science and technology studies (STS) perspective. Presently his focus of interest has shifted towards other forms of impact measure such as professional impact, i.e., in clinical guidelines.
David Gunnarsson Lorentzen is a PhD Student at the Swedish School of Library and Information Science, University of Borås, SE-501 90 Borås, Sweden. His main research interests concerns social media studies with a focus on method development. He received his Master's degree in Library and Information Science from University of Borås. He can be contacted at: david.gunnarsson_lorentzen@hb.se.