Library user studies for strategic planning
Zinaida Manzuch
Institute of Library and Information Science, Vilnius University, Universiteto 3, LT-01513 Vilnius, Lithuania
Elena Maceviciute
Swedish School of Library and Information Science, University of Borås, SE-50190 Borås, Sweden
Introduction
In the turbulent times of growing requirements to performance of public sector institutions and rapidly changing economic situation, libraries turn to more rigorous analysis of their activities to develop strategies for thriving. An important pre-requisite for developing an effective strategy is a comprehensive knowledge of the state-of-the-art of library activities. A researcher of organizational learning Peter Senge (1990) emphasizes interaction between a vision and strategic analysis that produces creative tension when creating an organizational strategy. Creative tension emerges from a vision of a desirable future and the real situation. The gaps between the two must be realized while looking for decisions that could help closing the gap. The concept of the gap between future visions and present reality that should be closed for best exploitation of the possibilities offered by libraries was guiding the whole study.
Performance indicators, widely used in business and public sector, provide effective tools for generating knowledge about current library performance situation. In general terms, performance indicators cover means for evaluating the current state-of-the-art of those aspects of activities that are crucial to accomplish major strategic goals of an organization (Parmenter 2010). The use of indicators in libraries is widespread and highly standardized. International standards, as e. g. ISO 11620: 2008, ISO TR 28118 (for national libraries), ISO 2789: 2006 etc. provide lists of indicators and recommendations how to collect and interpret statistical data about library performance. User studies (that are listed as a user satisfaction indicator in standards) became traditional practice in most libraries. Libraries conduct user studies for a variety of purposes, mainly for evaluation of existing services and improvement of them (Brophy, 2008; Poll and Boekhorst, 2007). Various reader surveys in the USA, Finland, Denmark and Latvia show that users associate public libraries with books and possibility of reading. Latvian survey has demonstrated that the most popular service is borrowing of books and the value of public libraries is perceived in the context of leisure reading and education (Paberza, 2010). A comparative survey of the perception of libraries by the USA readers in 2005 and 2010 has revealed that assotiation between libraries and books was stronger in 2010 than in 2005. According to this survey, the USA readers most often borrow books to read for pleasure in public libraries (De Rosa et al., 2011). Similar results were revealed in Denmark by several user surveys and the analysis of library statistics. The users of Danish public libraries mainly visited them to collect ordered documents. According to readers opinions, one of the most important quality features of these libraies is good collections of fiction and non-fiction (Pors, 2010). A wide survey of population in Finland has shown that readers associate the benefits received from public libraries with reading of fiction, non-fiction and with self-education (Vakkari and Serola, 2012). The authors admit that many public library readers in different countries are not aware of digital resources offered by these libraries, such as databases and e-books (Ashcroft, 2011; Pors, 2010; De Rosa et al., 2011). This ignorance to some extent may be a source of existing expectations and low use of modern services in public libraries. The association of public libraries with books and reading is controversial. On one hand, books and reading are important for societies and for the development of individuals. On the other hand the changes in user behaviour that can be observed already today indicate that public libraries might loose their relevance if they do not find a way to provide and promote more varied services for their communities (O'Beirne, 2010; Scott, 2011).
Project LiBiTop 'A study of optimization feasibility for Lithuanian library network' was started in 2012 and finished in 2014. It is conducted by a team of researchers hired for conducting this structural research project. The aim of the project is to design means of strategic planning that could help library managers and the governmental i nstitutions to make decisions about the future directions of library development. LiBiTop concentrates attention on ten libraries: five libraries of state significance and five county public libraries. These libraries are important strategic components in Lithuanian library system and as strategically placed participants influence the development of different library networks and the whole system. This paper focuses on the analysis of the data pertaining to the usage of service and user satisfaction with the county public libraries that are the centers of regional public library networks.
The aim of this paper is demonstrate how the data of library users' satisfaction study and the indicators of the usage of Lithuanian county public libraries' services were used for identification of the strategic development areas for the county public library network in Lithuania.
The questions that the authors are attempting to answer are:
- what are the gaps in the present provision of county library services as identified by library user studies?
- what are the directions of library strategic development suggested by library usage and user studies?
County public libraries in Lithuania
There are five county public libraries situated in five biggest cities of Lithuania. They could be compared with regional public libraries in some countries of the world. Usually regional libraries have some specific functions. The one met most often is coordination of a regional network of public libraries and the centre of the competence of library work. The feature that makes this type of libraries unique is their service provision to other public libraries. In some of the countries (e.g. Sweden) regional public libraries do not serve individual inhabitants, but in others they offer services to the people living in the region or visiting it.
In Lithuania county public libraries were changing their ownership and the served territory over the explored period. At present each of them serves a region including two neighbouring counties. The role and aims of Lithuanian county public libraries are not well determined. They may be extrapolated from a general description of their functions found in the clause no 9 of the Library Law (version in force from 31 December 2013):
- A county public library is a budgetary institution. It is owned by the state, the rights and duties of the owner are performed by the Ministry of Culture. The Ministry of Culture, in coordination with the municipal Councils acting in the territory, defines the territory of the activities of county public libararies (further - a defined territory).
- A county public library ensures the implementation of national development programmes of librarianship in the county, serves users, and is a centre of coordination, methodological consultation, interlibrary loan, bibliography, local history and information for the libraries in the county territory.
- Laws and other legal acts may endorse a county library to perform research and experimental (social and cultural) development.
- A county library collects and preserves a universal document collection satisfying the needs of a county, participates in the formation of the collection of Lithuanian libraries and in the creation of the library information system.
- A county public library, according to an agreement between the institution having the owners rights and duties and the municipality, can perform the functions of a municipal public library. (translation from Library Law - Lietuvos Respublikos biblioteku istatymas, 2013).
The function of coordinating and implementing of state library programmes in the regional network is emphasised by the law as well as the function of being a participant in the whole library system of Lithuania. In addition a county public library is allowed to perform the functions of municipal public libraries. As all five county public libraries are situated in big regional centres having municipal public library networks of their own this permission seems to imply a duplication of work. On the other hand, a unique function of conducting research and experimental development is entirely groundless as these libraries do not enjoy a status of research institutions and do not have staff trained to perform this kind of work. As this function was added only at the end of 2013, the actual meaning of it is not yet clarified in the accompanying legal documents. Serving users is one of the main functions that is included in the second provision of the clause 9. It is obviously one of the main functions that these libraries should perform. But this function also contains a problem for county public libraries as users are served by other libraries in the county and in the cities. Thus finding out what is the actual use and users satisfaction with services of these libraries and what could be the directions of further development in this area was one of the aims of the LiBiTop project. Part of the results related to this aim is used for the purposes of this paper.
The overall goal of the project was to identify the possible strategic development directions for the libraries in different circumstances and conditions that can occur in the future (O'Connor, Sidorko, 2010).
Methods
The part of the data collected from all five county public libraries is used in this paper. Each library is given a number with following letters AVB (apskrities viesoji biblioteka - county public library) in this text. The numbers were assigned in no particular order and have no significance but for preventing easy identification of a particular library.
Balanced score card of sixteen indicators related to the main roles, functions and activities of county public libraries was used to evaluate the activity of each of five libraries. These indicators helped to determine how users approach and exploit library resources and services. Table 1 shows only five of them that are presented in this paper and pertain to usage statistics and user satisfaction. The fifth indicator is qualitative and user satisfaction questionnaire was used to understand users' perception of their library use and their attitudes towards respective library activities and services.
| Percentage of target population reached |
| Library visits per capita / per active user |
| Number of content units downloaded per capita / per active user |
| Collection turnover |
| User satisfaction |
Statistical data were received from the following sources:
- a) annual reports of LAVB (2010 - 2012) provided by the libraries,
- b) statistical data available from the module of library statistics at the National Martynas Mažvydas Library,
- c) Lithuanian Research Library Consortium - a consortium for licencing databases (for downloads of content units).
Survey of the county library users was conducted in November - December 2013. The questionnaires were built on the basis of the SCONUL Satisfaction Survey for library services slightly adapted to the present Lithuanian context of public libraries. They consisted of 16 questions on the frequency of use, success of usage and importance of used library services.
As the researchers were looking for the answers from active users the questionnaires were distributed in the premises of respective libraries. County libraries serve the users of the whole region and to reach active users who might be visiting library less often they were also presented through the Internet. Information about the survey was sent through the libraries circulation service. Thus the sample was formed of self-selected users of the county libraries. This method also allows researchers to get responses from the targeted population of active and concerned users. Table 2 provides information on the sample representative of the library users registered in respective libraries and numbers of returned questionnaires. Questionnaires returned on paper and through the internet are indicated as well as the returns that were analysed. Table 2 also shows satisfactory proportion of answers in relation to the samples calculated for each library from the total number of their users, therefore the results can be regarded as reliable.
| Library | Sample | Returned on paper | Returned on the internet | Total returns suitable for analysis | Proportion |
|---|---|---|---|---|---|
| 1AVB | 376 | 125 | 108 | 199 | 52.9% |
| 2AVB | 372 | 124 | 85 | 181 | 48.7% |
| 3AVB | 376 | 126 | 433 | 369 | 98.1% |
| 4AVB | 377 | 122 | 124 | 218 | 57.8% |
| 5AVB | 377 | 103 | 179 | 206 | 54.6% |
For the purposes of this paper we present only a small part of the collected data: some demographic features (age, education, place of work and occupation); aims of usage; ratings of success of used servies; rating of satisfaction with library services and features of library work.
Results
Usage statistics
In this part, some essential indicators are presented showing the reach of the library service in the region, and actual use of library by the inhabitants.
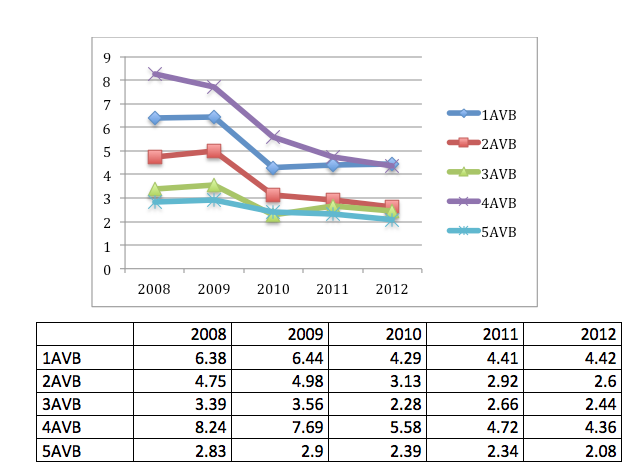
Percentage of target population reached
A county public library has a duty to serve users. The Law does not mention which groups of users it should serve, but one can assume that being a centre of the county public library network it should extend its services throughout the whole territory of the county. Therefore the inhabitants of the county are considered to be its target group and the ratio is calculated in relation to the number of county inhabitants, i.e. all potential users.
Fig 1 shows that county public libraries reach only a very small part of target group. The highest meanings of the indicators in 2008 and 2009 start from 2.90% and reach up to 8.24% of the served potential users group. From 2010 this part was slightly diminishing for various reasons and in 2012 was only 2.08% in 5AVB and 4.42% in 1AVB.
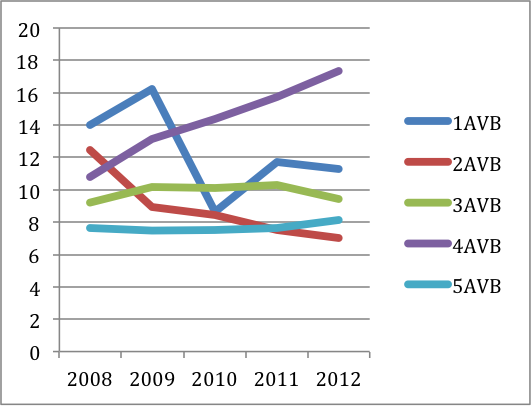
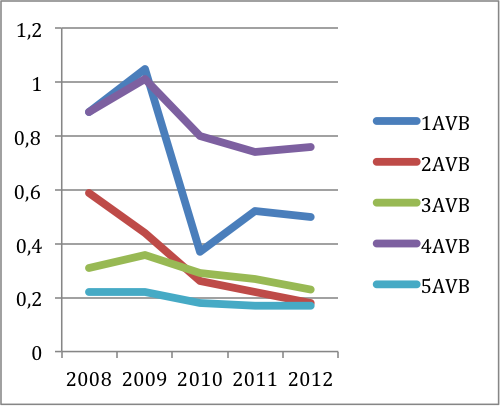
Library visits per active user / per capita
This indicator was calculated in two modes:
- Per active user, i.e a user registered as a reader in a particular library who used library services during the past 12 months and
- per an inhabitant of the served counties (per capita of the target population)
|
|
The Fig. 2.2 shows that number of visits to all libraries calculated per one member of a target group is very low, in some cases extremely low. This indicator falls down over the investigated period in all libraries. The main reason for the low meanings of this indicator can be explained only by the fact that these libraries do not reach their target population.
The number of visits per active user (Fig. 2.1) shows that it was changing over the period but not equally: falling down in one library, fluctuating in two, and growing in two libraries. However, these numbers are also not very high. Only in one of the libraries an active user visits the library slightly more than once a month. In all others it is less than 12, i.e. less than once a month.
Downloads of content units per active user / per capita
Judging about library use only from the visits to its building at present might provide a rather lopsided picture as many library services are available online and can be used without visiting its premises. For the county public libraries serving large territories this indicator should be fairer as the inhabitants of the county living in remote places can get access to its services anyway. The county public libraries in Lithuania were using a number of licenced databases. Downloads from them might show another side of library usage and the researchers tried to calculate downloads of content units by a member of targeted group.
The data of database usage was collected unsystematically by the Lithuanian Research Library Consortium and libraries themselves. Only fragments of data are available for certain years and databases. Out of this usage data only the downloads of content units from subscription databases were selected. A content unit in this investigation was defined as a full-text articles, books, html pages for reference publications (e.g. digital dictionaries). The abstracts were not considered to be content units for the full- text databases. In bibliographic databases an entry was defined as a content unit.
The data on downloads of content units were recoverd only partially and they are different for all libraries, though they had access to the same databases subscribed to by the Lithuanian Research Library Consortium. Therefore, it was impossible to calculate and compare indicators. Thus, the text is focused on statistica data and general observations.
1AVB had access to eight foreign databases and one Lithuanian database package. The data shows that the downloads do not exceed 4,000 per year. Having in mind that in 2008-2012 this library had between 17,017 and 17,312 registered users, which is only a fragment of the whole target group (ranging from 266,567 in 2008 to 391,700 in 2012), it is a very low indicator.
2AVB had access to ten foreign and one Lithuanian database. The downloads of content units per one member of the target group was the highest in 2009 - 0,02 downloads. Re-calculated per one active user the indicator shows that ten users download 3-4 content units per year. For a library with number of active users ranging from 15,480 in 2008 to 11,510 in 2012, including served territories with population of 326,026-441,933 in 2008-2012 respectively, these are very low rates of usage of electronic databases.
3AVB had access to 13 foreign and two Lithuanian databases. 3AVB collected the most comprehensive statistics on downloads of content units. It served a large target population ranging from 640,842 in 2008 to 754,091 in 2012. Downloads of content units ranged from 43,895 in 2008 to 19,736 in 2012. The highest number of downloads was in 2008 and reached 25,290 units (or bibliographic entries). The data on Lithuanian databases is largely missing, but what is available show that the usage of databases was diminishing since 2008. The county inhabitants practically do not use them as only two downloads were made per 100 inhabitants of the county. The active users visiting library show higher interest in downloading the content. One active user downloads 1,07 content units per year. This is still a very low indicator.
4AVB had access to nine foreign and four Lithuanian databases. Their usage data for the investigated period is largely missing, but what is available show that databases, especially, the foreign ones are used extremely seldom. E.g. downloads from EBSCO database was barely 2,633 over a year ( a reduction from 2010 almost by half). Comparing to the number of active users (29,346-19,179 in 2008 and 2012 respectively) and inhabitants of served territories (356,142-440,379 in 2008 and 2012 respectively) the number of downloads is inadequately low.
5AVB had access to six foreign and four Lithuanian databases. The data of their usage is largely missing, but what is available shows that the downloads of content units do not exceed 2000 downloads per year. The number of active users of this county public library ranged from 23,388 in 2008 to 19,914 in 2012, thus the indicator is extremely small even for this active group. For the target group (826,386 in 2008 and 959,670 in 2012) it is negligent.
Collection turnover
Collection turnover was calculated for the loan collection of each library, i. e. excluding the collections of print heritage that some of them collect and preserve. The main aims of work with these collections is preserving and making them available to relevant users, but but high rates of usage is not the purpose. One of the libraries is also performing the role of a print archive of legal deposit and these publications were also excluded from calculating turnover indicators as legal deposit is not for use.
Turnover of collections shows how often each item in the collection is lent. This measure is relevant to the use of the collection and shows its relevance to users' needs and the activity of users in borrowing materials from a library.
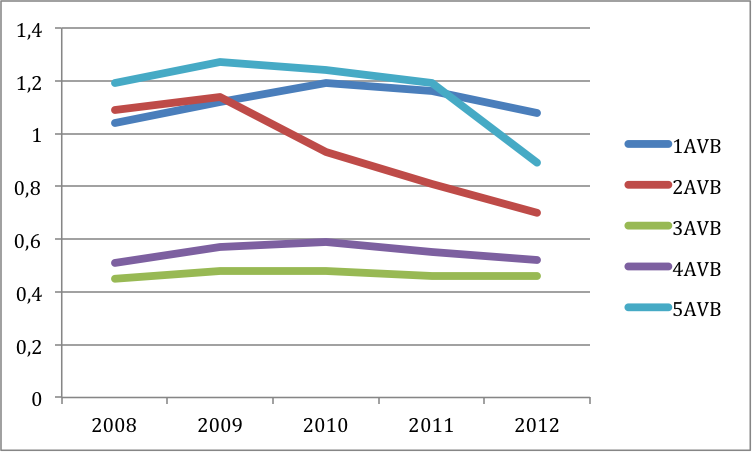
Fig. 3 shows that only three libraries exceeded one loan per one item in their collections. The overall indicator meanings are low and diminishing over the investigated period. Only one library managed to maintain stable turnover from 2008 to 2012, but this turnover is smallest in comparison with other libraires. The indicators of three libraries have fallen down, two of them sharply at the end of the period, though practically all libraries had an increased turnover in 2009 and 2010.
The turnover of the libraries can be explained best by the economic situation in the country. The financial crisis has brought readers to the libraries and collection turnover started increasing. However, at the same time most libraries, including county public libraries have lost a big chunk of their budgets and could not afford to buy new items. They had to rely on occassional sources of acquisition (e.g. donations) and that diminished the relevance of their collections to the users. Although, the reasons for the increase and decrease of collection use are quite clear, the indicators of turnover are still very small throughout the period and show that only a part of the collection is actively used. It means that the reasons of low turnover should be sought in internal processes of organizing acquisition in libraries.
User satisfaction
User satisfaction questionnaire has provided researchers with useful data on respondents demographic features and their attitudes towards county public library activities and services. Out of the multitude of this data we have selected only some that help explaining the gaps between actual service provision and strategic goals that these libraries could identify with regard to the Library Law and the actual state-of-the-art service use.
Demographic features of respondents
Here we introduce the following demographic features of the respondents of the county public libraries: age, residence data, education level, place of work and occupation.
| Age group | 1AVB (%) n=199 |
2AVB(%) n=181 |
3AVB(%) n=369 |
4AVB(%) n=218 |
5AVB(%) n=206 |
|---|---|---|---|---|---|
| Up to 18 | 6.5 | 8.8 | 2.2 | 5.5 | 5.3 |
| 18-26 | 22.6 | 32 | 58.5 | 33 | 28.7 |
| 27-39 | 10.6 | 23.8 | 27.4 | 27 | 30.4 |
| 40-49 | 24.6 | 9.9 | 5.1 | 16.1 | 11.2 |
| 50-59 | 18.6 | 16.7 | 4.9 | 12.4 | 15.2 |
| Over 60 | 17.1 | 8.8 | 1.9 | 6 | 9.2 |
| Total | 100 | 100 | 100 | 100 | 100 |
Table 3 shows that there are two major age groups of users in the county public libraries of Lithuania: young people of 18-26 and people of working age between 27 and 59 years old. Children and youth as well as senior readers do not form a majority group, though in some libraries their proportion is higher than in the others (2AVB has more young, 1AVB - senior users).
| County of residence |
|---|
| 1AVB - 96% in the main county (86.9% in the main city of the county 1) |
| 2AVB - 96.7% in the main county (89.3% in the main city of the county 2) |
| 3AVB - 93.2% in the main county (84.2% in the main city of the county 3) |
| 4AVB - 93.5% in the main county (85.8% in the main city of the county 4) |
| 5AVB - 96.6% in the main county (93.9% in the main city of the county 5) |
Each county public library serves a region consisting of two counties. County public libraries used to serve one county, but in 2010 served territories were expanded. However, Table 4 shows that the majority of respondents live not only in the main county, but in the main city of the main county. It is understandable that users living closest to the library should dominate, however, the received data shows a very high ratio of them for a library with a function to reach to the whole region.
| Educational level | 1AVB (%) n=199 |
2AVB(%) n=181 |
3AVB(%) n=369 |
4AVB(%) n=218 |
5AVB(%) n=206 |
|---|---|---|---|---|---|
| Primary | 1 | 2.2 | 0 | 0.5 | 2 |
| Basic | 10.6 | 10 | 5.7 | 10.6 | 7.8 |
| Secondary (general or special) | 14.6 | 19.9 | 13.7 | 16.5 | 13.7 |
| Advanced vocational | 15.6 | 6.6 | 3.5 | 15.6 | 6.8 |
| Higher | 58.2 | 61.3 | 77.1 | 56.8 | 69.7 |
| Total | 100 | 100 | 100 | 100 | 100 |
The classification of educational levels used in the Republic of Lithuania was used to collect the data. It is quite obvious that the group with higher education is dominating all other user groups.
The place of work and occupation categories were taken from the classification of working organisations and occupations used in the Republic of Lithuania.
| Place of work | 1AVB (%) n=113 |
2AVB(%) n=99 |
3AVB(%) n=220 |
4AVB(%) n=126 |
5AVB(%) n=132 |
|---|---|---|---|---|---|
| Business enterprise | 20.4 | 32.3 | 45.9 | 30.2 | 35.6 |
| State agency | 74.3 | 57.5 | 42.3 | 49.2 | 48.5 |
| Private enterprise | 4 | 5.1 | 8.6 | 19 | 9.1 |
| Other | 1.8 | 5,1 | 3.2 | 1.6 | 6.8 |
| Total | 100 | 100 | 100 | 100 | 100 |
Table 6 shows that the employment structure in a respective big city of the county impacts the structure of the library user group. The dominating groups are employed in a state (governmental) agency and in a business enterprise.
This table does not include unemployed respondents. The numbers of unemployed respondents (those who answered the question) using the county libraries are as follows:
- 1AVB: 60.3% - employed, 39.7% - unemployed
- 2AVB: 55.2% - employed, 44.8% - unemployed
- 3AVB: 61.2% - employed, 38.8% - unemployed
- 4AVB: 59.2% - employed, 40.8% - unemployed
- 5AVB: 65% - employed, 35% - unemployed
The most of unemployed respondents study at secondary or higher education instutions. This group forms between 43% (1AVB) and 75% (3AVB) of the unemployed respondents. Two other groups, identified as significant, are retired people and persons on maternity leave. Table 7 shows the occupations of employed respondents.
| Occupation | 1AVB (%) n=117 |
2AVB(%) n=98 |
3AVB(%) n=214 |
4AVB(%) n=129 |
5AVB(%) n=132 |
|---|---|---|---|---|---|
| Worker, technician | 12 | 8.2 | 8.9 | 14 | 3 |
| Specialist | 51.3 | 43.9 | 58.4 | 39.5 | 55.7 |
| White-collar worker | 26.5 | 34.7 | 16.4 | 22.5 | 18 |
| Manager (top or middle level) | 7.6 | 6.1 | 9.8 | 10.9 | 14.3 |
| Other | 2.6 | 7.1 | 6.5 | 13.1 | 9 |
| Total | 100 | 100 | 100 | 100 | 100 |
Two biggest groups of respondents in all public county libraries are specialists and white-collar workers. Specialists are the employees of high qualification who need professional knowledge acquired through studies in higher education unstitutions (e.g. physicians, engineers, teachers, etc.). White-collar workers are employees who need practical knowledge and experience of managing information. They usually have vocational education of advanced level. The third group consists of workers and technicians, which is outnumbered by managers only in 5AVB. This data is consistent with the educational and age data of the respondents.
Satisfaction with library service
For the purpose of demonstrating the satisfaction with library service we have chosen three idicators: aim of usage of library services, evaluation of success rates of the last instance of usage of library services, and satisfaction with the features and services of a county public library.
| Aims | 1AVB (%) n=199 |
2AVB(%) n=181 |
3AVB(%) n=369 |
4AVB(%) n=218 |
5AVB(%) n=206 |
|---|---|---|---|---|---|
| Looking for leisure reading | 65.8 | 51.4 | 63.7 | 53 | 74.3 |
| Searching internet | 47.2 | 30.9 | 16.5 | 40.4 | 13.6 |
| Attending library events | 41.2 | 31.5 | 12.2 | 33.9 | 11.2 |
| Looking for professional (working) literature | 34.2 | 31.5 | 30.9 | 37.6 | 28.6 |
| Looking for study materials | 32.2 | 46.4 | 64 | 42.2 | 49.5 |
| Spending leisure time | 16.6 | 13.8 | 5 | 19 | 9.7 |
| Using study/work space | 11.1 | 8.3 | 14.6 | 22 | 12.6 |
| Other | 4 | 6.6 | 4.1 | 10 | 3.4 |
Table 8 shows that the main reason the respondents use library is searching for leisure reading material. However, it is outranked by summed indicators of using library for searching professional literature and for study materials in all libraries. Searching internet mainly reflects the aim of accessing technology (which is also a popular service) rather than any particular purpose that it is used for. Attendance of library events attracts different numbers in different libraries. Only minority of users in all libraries use libraries as study or work places and spend their leisure time there (though in some libraries these aims are more poular than in others).
Table 9 (Appendix 1) shows ratings of success (mean, median and mode) of the latest instance of the library service use by respondents. A list of services was provided and the respondents could enter their own service. The success rates were: 0 - did not use, 1 - entirely unsuccessful, 2 - rather unsuccessful, 3 - rather successful, 4 - entirely successful. The data in the table is significant as it shows not only the perceived rate of success, but also the most popular and the least used services in each library. Using electronic databases and asking librarians online are not among the used services in all five libraries. 3AVB obviously does not provide convenient access to computers and 5AVB is mainly used for borrowing books and consulting librarians on the premises. Usage of electronic catalogues and library websites are among the less used or rated as unsuccessful that is reflected in lower means.
Table 10 (Appendix 2) provides evaluation of satisfaction with county public library services or features of their collections and activities. The list was produced using the literature survey, other library service satisfaction measuring instruments and the actual input from the investigated libraries. Satisfaction was evaluated using the following scale: 0 - do not use; 1 - entirely unsatisfied, 2 - rather unsatisfied, 3 - rather satisfied, 4 - entirely satisfied.
The table demonstrates the tendency to rate the library services very highly - mainly as rather satisfied and entirely satisfied. This may be a consequence of the fact that the questionnaires were distributed through libraries and the respondents wanted to express their positive attitude rather than actual level of satisfaction. This required thoughtful approach to the data on the researchers part and taking into account the differences in positive response data as well as other indicators to identify the actual gaps. Thus, the mean ratings show that not all services are used equally by the respondents. Most of them in all libraries are satisfied by book collections, convenient opening times, friendliness and competence of staff - in other words by traditional library service. Information literacy training and libraries' electronic publications receive lowest satisfaction rating mainly because they are least used (0). In 3AVB and 5AVB library events are also poorly used by the respondents. Library premises and technological equipment receive similar ratings in all libraries despite visible differences in their building and technological infrastructure. These differences are mainly reflected in comments of the users rather than in the ratings.
Discussion and conclusion
Comparison of user statistics with the data from user questionnaire is quite interesting. There is an obvious discrepancy between small turnover of collections and high satisfaction with book collections. On the other hand, the low number of downloads from databases and low usage of electronic databases and tools confirm each other.
The first question of the undertaken exploration was: what are the gaps in the present provision of county library services as identified by library user studies?
Taken together and in the context of other data, the statistics of use and user questionnaire allows researchers to identify the following problems (gaps) of the county public libraries' activities in Lithuania:
- It is obvious that current model of a county public library as a universal public library serving population of two counties is inefficient. Currently, these libraries do not reach their target group and mainly serve the inhabitants of the main city in the county. The libraries also have no strategy how to effectively reach their remote audiences in the regions. It is shown by low usage of electronic services, such as databases and also electronic resources developed by the libraries themselves and low demand for information literacy training.
- The Library Law makes no clear distinction between county and municipal public libraries. This results in duplication of services. Additionally, searching for possible niches and trying to distinguish themselves from municipal public libraries, county public libraries duplicate other libraries' services. Looking at the structure of the unemployed user group one can extrapolate that these libraries duplicate academic and school library functions. Looking at the most popular services and use patterns of their printed and electronic collections one can extrapolate that they duplicate the functions of other public libraries.
- The survey shows that the largest groups of users are specialists and white-collar workers. These users are mainly not served by any other libraries in the region (except few branches of medical and technical libraries). However, these users are not sufficiently using county public libraries for professional development. The results of the survey show that approximately 30 % of users aims at finding professional literature in county public libraries.
- The least demand is placed on two groups of services: 1) practically all electronic content produced and available through county public libraries; 2) information literacy training, which indicates either the lack of demand or poor quality of the service.
The highest demand is placed on book collections and book borrowing, the highest satisfaction is displayed with librarians' friendliness, competence, and help and with convenient opening times. On the whole the data shows that all respondents were avoiding negative evaluation of satisfaction. There are very few of them who rated services as unsatisfactory, therefore it is necessary to pay attention to the level of usage of the services - which are used most and least. These data show the need of the service or demand for it. On the other hand, user satisfaction data and usage statistics together can be best understood when viewed in the context of other data collected during studying the cases of each library, which actually became a proper library survey (McDiarmid, 1909).
The second question of the undertaken investigation was: what are the directions of library strategic development suggested by library usage and user studies?
On the basis of the data presented in this paper, the researchers were able to suggest the following strategic development directions for the county public libraries in Lithuania:
- Focusing collections and services to satisfy the professional development and learning needs of specialists and white-collar workers. This is the only user group with particular information needs not served by other libraries in the regions. Some users of this type have already discovered county public libraries as a resource for continuing professional development. However, a study of information needs of these users and also non-users from the group of specialists and white-collar worker is essential to attract this target audience to the libraries.
- Tuning electronic services and information resources to the needs of new target group and reaching remote audiences. Such services cover subscription databases, electronic resources, and services by county public libraries. Currently, subscription to electronic databases is not serving any purpose in county public libraries. They mostly provide access to databases available under country licence in all Lithuanian libraries. This may be the reason of low use of database content. It is clear that county public libraries should become a strategical partner of the Lithuanian Research Library Consortium. They should subscribe to specific databases demanded by users. County public libraries should also develop a strategy to generate sufficient rates of usage of database content in served regions. Low rate of content downloads may be also the reason of insufficient knowledge about the service. Similar situation of low usage of electronic content and services produced by county public libraries suggests the need to change promotion strategy. Libraries should also investigate if services and content they develop are in need and focus on involving users in the processes of electronic products' development.
- Using municipal public library network as a channel for provision of services to remote audiences. County public libraries serve huge population, which is dispersed over large territories. It is also clearly seen in user survey that traditional library services (lending books, visits to library buildings) are valued. In order to reach remote audiences, county public libraries should exploit their role of service coordinator in the municipal public library network. Attention should be paid to collaboration and development of such services as interlibrary loan (including electronic), promotion of county public library services in municipal public libraries (e.g. electronic databases and content) and other collaborative initiatives.
Acknowledgements
The authors would like to acknowledge the help of the librarians from Lithuanian county libraries who have provided data, helped to organize user surveys and participated in the studies themselves. Big support was received from the contractor of research - Lithuanian Academic Libraries Directors' Association that may not necesserily share the opinions of researchers expressed in the paper. The project LiBiTOP was financed by European Social Fund Agency.
About the authors
Zinaida Manzuch is a docent in the Institute of Library and Information Science, Vilnius University, Lithuania.
She has received her PhD at Vilnius University. At present she teaches courses on digitisation of cultural heritage
and information management. Her main research interest include memory institutions and their activity, policy of digitisation
and strategic development of libraries. She has participated in a number of international and European projects, managed
and conducted the LiBiTOP project. She can be contacted at: zinaida.manzuch@kf.vu.lt
Elena Maceviciute is a professor at Vilnius University and at the Swedish School of Library and Information Science. She works in
information management and digital library area and has published articles on Lithuanian libraries and more general topics. She works
on a number of research projects on digital libraries and e-book publishing.
In the LiBiTOP she worked as a principal researcher. She can be contacted at
elena.maceviciute@gmail.com