'Nobody reads the documentation': true or not?
Brigit van Loggem
Open Universiteit, Heerlen, the Netherlands
Introduction
The study presented in this paper was carried out to provide empirical evidence to confirm, or not, the widely held belief that software users don't read documentation.
In 1991, a short article aimed at a professional audience of programmers appeared in the Communications of the ACM under the title Nobody Reads the Documentation (Rettig, 1991). Since then, the idea that users of software "simply won't read the instructions" has become almost an article of faith; and technical writers the world over secretly hope for permission from management to have printed on every page of their user manuals the catch-phrase, "Read The F... Manual!" or RTFM for short. Yet a respondent in a study on the appropriation of the iPhone (!) was quoted as saying: "I don't have the time to explore. I miss having a manual that I can lean back and read." ( Bødker and Christiansen, 2012). This is just anecdote; but if it were indeed so that users of software avoid consulting the instructions, then how can we explain the long shelves filled with software-related books (van der Meij, Karreman, and Steehouder, 2009; D. Wright, 2008) that are found at any bookshop or public library?
A handful of research studies have previously been carried out to determine whether users are indeed reluctant to consult the documentation that is delivered with a product, and these are surprisingly unanimous in their findings. The different studies vary greatly as to respondents, method and the exact nature of the question. However, they invariably conclude that—at least for complex and unfamiliar products—the documentation is consulted; even if it is not read, marked, learned, and inwardly digested in its entirety. Table 1 below shows a summary of the available research, showing the percentage of respondents reported as ever having consulted documentation of a particular type.
| % 'yes' | N | consultation of | ref |
|---|---|---|---|
| 82.9 | 44 | the printed documentation for complex equipment such as VCRs | P. Wright, Creighton, and Threlfall, 1982 |
| 96 | 201 | instruction manuals | Schriver, 1997 |
| 99 | 400 | the printed manual for a major word processing program | Smart, DeTienne, and Whiting, 1998; Smart, Whiting, and DeTienne, 2001 |
| 65 | 400 | the online Help for a major word processing program | Smart et al., 1998; Smart et al., 2001 |
| 95.5 | 224 | the printed manual for an accounting software package | Vromen and Overduin, 2000 |
| 58.9 | 365 | the manual of the vehicle that they drive most often | Mehlenbacher, Wogalter, and Laughery, 2002 |
| 92 | 201 | the manual that comes with a product they buy | Jansen and Balijon, 2002 |
| 59 | 107 | the printed manual for any piece of software | Martin, Ivory, Megraw, and Slabosky, 2005 |
| 57 | 107 | the online Help for any piece of software | Martin et al., 2005 |
| 91.2 | 70 (older adults) |
product manuals for technological products | Tsai, Rogers, and Lee, 2012 |
In addition to the studies summarized in Table 1, there are a few reporting considerably lower rates of recourse to documentation (Ceaparu, Lazar, Bessiere, Robinson and Shneiderman, 2004; Mendoza and Novick, 2005). These, however, are characterized by a different focus, studying as they did the occurrence of users turning to sources of support on experiencing "frustration" with software as a result of poor usability. Many of the frustrations described did not result from lack of mastery of the software but followed from network breakdowns, time delays, and recognized user errors such as saving a file to the wrong location. In such situations the origin of the frustration is already known, and it is not surprising that no attempt is made to alleviate it by turning to documentation. Also, there is no reason to assume that recourse to documentation is necessarily preceded by a sensation of frustration. It is well imaginable for an individual to turn to documentation while experiencing a non-frustrating desire to know. For these two reasons, the "frustration" studies recorded only a subset of all recourses to documentation, of unknown proportion. They are therefore not included in Table 1.
Doubt has been expressed (Novick, Elizalde, and Bean, 2007) as to the validity of the results summarized in Table 1. Moreover, some of them pertain to consumer products whilst others discuss the use of documentation when working with software. The study described in this paper, therefore, specifically focused on the sources of information that users of software refer to in the course of their work.
Study design
Instrument and method
A single-sheet questionnaire was prepared which offsets six possible sources of information against four possible situations in which information can be required when working with software. In the Netherlands, where the study was conducted, the national language is Dutch but there are many environments where English is the working language. For this reason, the questionnaire was prepared in two language versions (Dutch and English). In all respects other than language, the two versions of the questionnaire were identical. An image of the English language version of the questionnaire is presented in Figure 1.
The information sources were described as follows (all quotations are taken from the English language version of the questionnaire):
- instructions delivered with the software (in print or as a PDF)
- Help that you call up from within the software
- online sources (through a web browser)
- shop-bought book (either your own or borrowed)
- ask someone you know (colleague, family member, etc.)
- other, that is: _______________
The situations in which information might be sought were described as follows:
- understand how the program or part of it works, and what it can do
- look up how to carry out a particular procedure
- quickly look up a particular fact that you don't know or cannot remember right now
- find out what went wrong when there is a problem
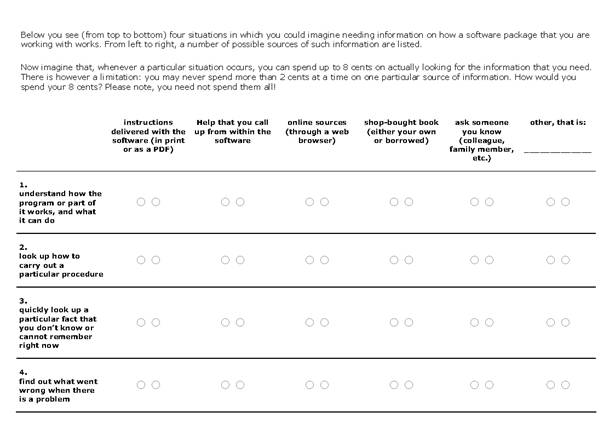
Rather than asking respondents for their preferences, a little narrative was introduced to exert some gentle pressure, prompting respondents to consider their choices more thoroughly than they might have done when presented with a more straightforward questionnaire. Printed on the questionnaire itself were the following instructions:
Below you see (from top to bottom) four situations in which you could imagine needing information on how a software package that you are working with works. From left to right, a number of possible sources of such information are listed. Now imagine that, whenever a particular situation occurs, you can spend up to 8 cents on actually looking for the information that you need. There is however a limitation: you may never spend more than 2 cents at a time on one particular source of information. How would you spend your 8 cents? Please note, you need not spend them all!
This unusual design, it was hoped, would slow down respondents enough to make them carefully consider their answers; rather than breeze through a list of similar-looking questions.
In November 2013, the 69 students who attended class on the first day of an introductory course on web applications were presented with the Dutch language version of the questionnaire. These students were at the very beginning of their studies at an institution for short tertiary education, and the course they were taking was part of a study program in Communication and Multimedia Design. Most were under 25 years old, having enrolled in the program directly or almost directly after completing upper secondary education; 5 were between 25 and 30 years of age. None of these 69 respondents, who all returned the filled-in questionnaire, held a tertiary educational qualification.
Then, in February 2014, the English language version of the questionnaire was administered to employees at the Netherlands office of a developer of a scientific software suite for the interpretation of seismic data. This is a highly skilled area of expertise, as is reflected in these respondents' relatively high level of education. Out of the 30 professionals (as I shall refer to this group from now on) who were in the office on the particular day on which the questionnaire was administered, and who all returned the filled-in questionnaire, 11 held a doctoral degree or equivalent and a further 10 held a master's degree or equivalent. Their overall age was, inevitably, higher than that of the students studied a few months earlier.
Data processing
First, all the filled-in questionnaires were checked for clarity and for violations of the rules that 1) on no situation that information could be needed, more than 8 'cents'-from now on, I shall refer to these as tokens-in total could be spent and 2) no more than 2 tokens could be spent on a particular information source in a particular situation. None of the questionnaires violated either of these rules, nor was it ever unclear how many tokens were spent.
The filled-in questionnaires were also checked for 'empty' rows, to see if there were situations in which a respondent had not spent any tokens at all. This was not the case. All respondents had allocated at least one token to at least one information source for every one of the four situations.
Separately considered were the explanations given for the information source 'other' in cases where tokens were spent on this source: as it turned out, only two 'other' sources of information were mentioned. One, exclusively mentioned by students, was 'YouTube'; the other, exclusively mentioned by professionals, was 'Help desk'.
To allow for the data obtained from the filled-in questionnaires to be analyzed in different ways, a relational database was then created which could be queried using SQL, the standard query language for such databases. In doing so, the six information sources were given a code determining whether that particular source of information is an instance of 'documentation'; where 'documentation' was defined as pre-recorded information that is purposefully selected and presented by a human designer to assist future human users deploying a particular tool. Application of this definition led to the information sources 'instructions delivered on paper or PDF', 'Help system', and 'shop-bought book' being labelled 'documentation', where the remaining three categories of 'information found online', 'asking somebody', and 'other' (which had turned out to be either YouTube or Help desk) were not.
The database was then filled with the data from the questionnaires. For each combination of a respondent, an information source, and a situation a value was entered into the database recording whether 0, 1 or 2 tokens (the maximum allowed) were allocated.
Finally, pertinent SQL queries were run and the results analyzed as described below.
Results
In this section, to determine if there is truth in the saying that "nobody reads the documentation", the question is looked at from a number of different angles.
First, an extension to Table 1 is drawn up, allowing for a summary of the results to be compared to earlier studies.
Then, the relative use of documentation compared to other sources of information is investigated.
Next, the results are investigated in more depth and split up by the type of information source that respondents report they refer to.
Finally, the results reported in the first three paragraphs are split up by situation in which information is sought.
Reference to documentation
The first question asked was, very simply and in line with the information presented in Table 1: What is the percentage of respondents in both groups (students and professionals) who at least sometimes, in some situations, refer to documentation?
For the professionals this percentage is 100. Out of the six information sources to which respondents were invited to allocate tokens in different situations, some were coded 'documentation' whilst others were not. None of the professionals allocated less than 1 token to the combined information sources instruction manual, Help system and book. Even if we remove the tokens allocated to books from the equation, the answer is still 100: all professionals indicate referring to the 'traditional' documentation genres of instruction manual and Help system at least some of the time.
For the students these percentages are a little lower. 10 students never refer to the instructions or the Help system, although 2 of these may occasionally refer to a shop-bought book. This means that in this group 85% consult the instructions or the Help, be it ever so occasionally, while 88.4% may consider turning to any source of information that can be seen as documentation. These numbers are summarized in Table 2 below, in a format similar to that used in Table 1.
| % 'yes' | N | consultation of | group | year |
|---|---|---|---|---|
| 88.4 | 69 | Help system or instructions (in print or PDF) or shop-bought book | students | 2013 |
| 85 | 69 | Help system or instructions (in print or PDF) | students | 2013 |
| 100 | 30 | Help system or instructions (in print or PDF) or shop-bought book | professionals | 2014 |
| 100 | 30 | Help system or instructions (in print or PDF) | professionals | 2014 |
Documentation versus other sources of information
High percentages of users indicating that under certain conditions they refer to documentation are not difficult to obtain and therefore not very meaningful. Indeed, almost the same result can be achieved if we count the percentage of respondents that indicate referring, at some time or other, to sources of information other than documentation: for the students as well as for the professionals this turned out to be 100%.
In order to determine the relative importance of documentation, we need to know how frequently other sources of information will be referred to when users have a choice. The next question therefore was: To which of the two groupings of information sources, documentation or not, was the highest proportion of tokens allocated?
Figure 2 shows a clear preference for information sources that cannot be seen as documentation. Out of a total of 944 tokens spent by the 69 students, only 248 (26%) were allocated to documentation. The 30 professionals together spent 472 tokens, 190 (40%) of which were allocated to documentation.
Reference to different information sources
Thus far, the information sources labelled 'documentation' and those labelled 'not documentation' have been lumped together. It is worth our while looking at the six sources of information separately.
One way of doing this is by asking: How is the total number of tokens spent distributed over the various information sources?
As it turns out, students and professionals had the same relative preferences. Figure 3 shows how of all tokens that were allocated, by far the most are spent on the information source 'online', with 'ask somebody else' as a good second. Only then come the Help system and the instructions, followed by 'other' (which was YouTube for the students and Help desk for the professionals) and finally, the shop-bought book.
Another way of looking at the use made of the various sources of information is by counting those respondents who have allocated tokens to a particular information source in at least one situation. As there are six categories rather than one, and the percentages under consideration add up to more than one hundred, the numbers do not lend themselves to presentation in a format comparable to the earlier tables, nor the 'doughnut' chart format used thus far. Figure 4 presents the data as a simple clustered column chart.
Although direct comparison between Figures 3 and 4 is difficult, we can still see that shop-bought book and 'other' are the least popular sources of information in both analyses, just as asking somebody and online browsing are the most popular. However, the differences between the information sources are smaller when we ignore the total number of tokens allocated, and the classical documentation genres of instruction manual and Help system manifest themselves much more strongly.
Of the 30 professionals, 27 (90%) would refer to the user instructions in at least one situation, and 24 (80%) would look for information in the Help system. Fewer students than professionals would ever turn to traditional documentation products, but still considerably more than half the students would in at least one situation do so: out of the 69 students, 48 (almost 70%) would sometimes consult the instructions and 44 (almost 65%) would sometimes consult the Help system.
User instructions and Help in different situations
To conclude this analysis, let us consider the relative preferences for the information sources 'instructions' and 'Help' against the different situations in which information is sought. In which situations are these traditional documentation products most frequently referred to?
Again, the different percentages do not add up to one hundred; this time because only those tokens allocated to either instructions or Help are taken into consideration while the others are ignored. Figures 5 and 6 present the data therefore once again in the format of a set of clustered column charts.
Figures 5 and 6 show that for problem-solving and quick lookup of simple facts, Help is generally preferred over instructions delivered as a printed manual or as PDF. For finding out how the program works and what it can do, and for learning how to carry out a particular procedure, however, the two sources of information are almost equally popular. If anything, the instruction manual is marginally preferred to the Help.
Limitations
The unusual design of the questionnaire seemed to have met its objective of forcing respondents to think before answering. No obvious patterns could be detected simply by looking at the filled-in forms: almost all respondents had spent their tokens so that the distribution over the information sources was different for each of the four situations.
However, neither the students nor the professionals spent all the tokens that they had at their disposal. Remember that every respondent was presented with four distinct situations and eight tokens to spend on looking for information in any one situation; they were explicitly told that they need not spend all eight tokens per situation. So, every respondent had a total of 32 tokens to spend. Considering that the students spent on average 13.68 tokens and the professionals 15.73, we see in Figure 7 that in both groups more than half the tokens remained unspent.
It is difficult to determine how to interpret this. Does the proportion of unallocated tokens somehow provide a measure for how often the average respondent would give up and live with a lack of information rather than look for it? Or is it so that at least some respondents have spent their tokens assigning a score of 2, 1 or 0 in order to indicate a relative preference? Are there respondents who fully expect the answer to a question in a particular situation to be found in one or two particular sources of information, and do not feel the need to spend any 'money' on other information sources? Or is the fact that not all information sources are always available taken into consideration? Informal discussion with a few of the professionals after they had filled in the questionnaire revealed that all of these explanations, and undoubtedly more, in some cases apply. It is not possible therefore to draw hard conclusions from the absolute numbers found; but we can conclude that users of software refer to documentation as well as to other sources of information, and that non-documentation sources are referred to relatively more.
Conclusions
No matter how we look at the numbers, the findings from this study offer strong evidence that reports of the death of user documentation have been greatly exaggerated.
Contrary to popular belief, software users do read the documentation. Depending on what exactly is counted, the numbers vary between 26% and 80% of information-seeking behaviours. Interestingly, all the numbers attempting to describe frequency of recourse to documentation in this study are higher for the (better educated, older) group labelled 'professionals' than they are for the (less educated, younger) group labelled 'students'. Although the sample sizes were relatively small and therefore it is not known whether they extrapolate to the general population, this can be seen as encouraging. After all, from an economic perspective, inefficient or ineffective use of software, or under-use of the same, has more serious repercussions when the work is undertaken for profit than when it is undertaken to fulfil private goals. Man-hours wasted; incorrect or invalid results; reduced acceptance of a system after implementation; that which has been paid for not being fully utilized: all these constitute financial losses. If professional users of software are as willing to consult documentation as the findings suggest, then taking pains to design and develop documentation of the highest possible quality is a worthwhile endeavour.
In line with popular belief, on the other hand, is the predilection exhibited by both groups of respondent for 'unauthorized' sources of information such as somebody near them or sources found on the open Internet. These results fit a repeatedly-confirmed observation in areas other than that of recourse to (software) documentation. Time and again it is found that ease of access and convenience are the strongest determinants for the choice of an information source, with online browsing as the single most popular method for seeking information (e.g., Connaway, Dickey, and Radford, 2011; Fast and Campbell, 2004; Julien and Michels, 2004; Kim and Sin, 2011).
Even software users who fully realize that answers obtained from a non-authorized source are often not of the same quality as those obtained from the software's supplier-who, having created the software, at least in theory knows it better than any third party ever could- can hardly be blamed for taking the easy route first. It cannot be denied that asking the person at the next desk or entering a few keywords into an online search engine hardly 'costs' at all, be it time or any other resource. And where asking still involves admitting ignorance and imposing on somebody else's time, barriers to turning to one's web browser are completely non-existent. Most of the time, a software user who wants to obtain information about the program he or she is working with, is sitting at the computer; and whatever the working environment, Internet access nowadays is as good as ubiquitous.
It is very well imaginable that documentation would be used even more than it already is if high-quality support materials were created by professionals and offered where appropriate, rather than such an approach being dismissed as too expensive. Documentation must be designed so as to be genuinely helpful. There is no reason why the traditional instruction manual or Help system should remain the only genres of user documentation, yet the 'mainstream' approach to documentation has remained unchanged for a number of decades. It is led by guidebooks and standards originally dating from the 1980s. Although regularly updated and added to, such guidelines tend to change only slowly and superficially and by their nature cannot reflect the latest developments. This is illustrated by the fact that it has, for example, proven quite possible to validate an instruction manual for a table loom, published in 1925, to ISO/IEC 26514:2008 Systems and software engineering - Requirements for designers and developers of user documentation and establish a high level of conformance (van Loggem, 2014).
Creating high-quality documentation is undeniably expensive. Yet in the long run, misinformed users concluding that a particular software product is useless is even more expensive. Designers and developers of software documentation must be aware of the danger of users finding incomplete or incorrect information in sources other than the ones supplied as 'documentation'. Rather than throw the towel in the ring from a mistaken belief that "users don't read the instructions anyhow", they should make the documentation a worthy competitor to other sources of information. Documentation should be easily accessible and pleasant to use. And it should be made available in old and new formats on the open Internet, search-engine optimized for people to find it.
Acknowledgements
The study reported on in this paper could not have been carried out without the co-operation of the Hogeschool van Amsterdam (department Communication and Multimedia Design), and that of CGG Jason (Netherlands) B.V.; who kindly gave me access to respectively their students and their employees.
About the author
Brigit van Loggem has been working as a professional documentation developer since 1992. She received her Master's degree in Communication Science from Twente University, Enschede, the Netherlands and is currently working towards a PhD at the Open University, Heerlen, the Netherlands. She can be contacted at: brigit@byteryte.nl