vol. 16 no. 4, December 2011
vol. 16 no. 4, December 2011 |
||||
Scholars have long recognized that user characteristics (e.g., domain knowledge level of users (Zhang, et al. 2005)), task (e.g., task stages (Kuhlthau 1993), task types (Kim 2006)), user situation, goal and context have significant influence on the information-seeking process (Belkin 1996, 2008; Ingwersen and Järvelin 2005). Human-computer interaction relies heavily on human cognition and perception (Card et al. 1983). Human cognition and perception are processed at a series of levels during information-seeking process. (Belkin 1980; Ingwersen 1996). Therefore, user characteristics, particularly users' cognitive characteristics are increasingly drawing attention in the field of information science and human computer interaction studies. As one of the cognitive characteristics, cognitive style was found to impact the search performance when using information systems (Palmquist and Kim 2000; Park and Black 2007). Furthermore, the findings that (1) cognitive styles affect users' interaction with information systems on different information tasks (Gwizdka 2009) and (2) users perceived differently between an information visualization system and a text information retrieval system (Yuan et al. 2010) indicate that it is possible to improve the user performance of information (visualization) systems if different cognitive styles of information system users can be taken into account when designing such systems. This paper is part of a larger user experiment that involves thirty-two subjects, with sixteen using the Web of Science system (reported in (2011)) and sixteen using the CiteSpace system. For the current study, we were particularly interested in if and how cognitive styles impact the user performance when using the CiteSpace information visualization system (Chen 2004a). In the following sections, the related work in the field, CiteSpace System, cognitive style test, research methodology, data analysis, discussion and conclusions are described in sequence.
Cognitive styles are approaches preferred by people for organizing and presenting information (Riding and Rayner 1998), and represent personality dimensions which have an impact on people's information collecting, analysing and evaluating (Harrison and Rainer 1992). The most widely researched cognitive styles are field dependence versus field independence (Messick 1994; Chen 2000), which were derived from a series of studies of Witkin and Goodenough (1981). Field independent people tend to impose a structure on an unstructured field, while field dependent people perceive a complex field globally. Weller, Repman and Rooze (1994) indicated that there are differences between field-dependent and field-independent cognitive styles in regard to how well people can restructure information by using salient cues and field arrangement.
Field-dependent/independent cognitive styles have been shown to significantly affect users' information seeking behaviour (Chen and Ford 1998, Ford and Chen 2000). More recently, many researchers have investigated the effects of field-dependence/independence on user performance of information tasks. Kim (2001) explored the impact of cognitive style difference and online search experience on search performance and users' online navigation patterns. Results showed that cognitive styles had an impact on search time, and online search experience influenced search styles. Kim and Allen (2002) conducted two independent experiments to study the effect of differences in users' cognition and search tasks on Web searches. They found strong task effects on search activities, but interactions between cognitive and task variables were found on search activities only. An important finding from this study is that search efficiency depends on how well each searcher fits with the specific task.
Palmquist and Kim (2000) explored the effects of cognitive styles and on-line database search experience (novice and experienced) on the World Wide Web search performance of undergraduate students. They found that cognitive styles significantly affected the search performance of novice users, but the impact was greatly decreased for the experienced users. Chen and colleagues (Chen et al. 2005; Chen et al. 2004) created a flexible Web directory (similar to a search engine) that accommodated both field-independent and field-dependent users. Lee and Boling (2008) argue that interactions between information representation approaches and learners' cognitive styles may have significant effects on learners' performance. They insist that the performance of a learner, especially with a low level of knowledge, could decline if a representational approach that contradicts their cognitive style is used. Frias-Martinez, Chen and Liu (2009) found cognitive styles have great effects on users' responses to adaptability and adaptivity.
Besides field-dependence/independence, wholistic versus analytic styles also drew attention in the field (Peterson et al. 2005a and 2005b). Riding and Cheema (1991) explain the differences between users with a wholistic and analytical cognitive styles by asserting that holists often view a situation as a whole, while analytics see situations as a collection of parts, often stressing only one or two aspects at a time. It is believed that wholistic versus analytic cognitive styles also have an impact on search behaviour and search performance (Park and Black 2007), but few studies have been done in this direction. Ford, Wood and Walsh (1994) insist that field-independent students have greater propensities towards analytical cognition. Park and Black (2007) conducted a study in which sixty-one graduate students were tasked with finding answers to six open-ended questions on the World Wide Web. Subjects who had an analytical cognitive style used significantly more keywords than did subjects with an intuitive (wholistic) cognitive style. Ford, Miller and Moss (2005) examined holist/analytic and imager/verbalizer cognitive styles as relating to individual differences and their effects on Web search strategy. They found that high levels of Boolean searching were positively correlated with a wholistic cognitive style.
In sum, research has shown that cognitive styles are important factors influencing the interaction between users and systems, as well as affecting information seeking performance. This research contributes to both the field of human-computer interaction and information science in that the findings about the effect of cognitive styles on user performance of the information visualization system, CiteSpace, show that there is relation between users' cognitive styles and their performance with information visualization systems. This further indicates that a good design of information visualization systems should take into account of users' cognitive styles.
The research question of this study is:
Will cognitive styles affect users' search performance of an information visualization system?
The CiteSpace system was chosen in this study because it is a well-known, actively maintained, stable and widely used knowledge domain visualization system. Also, it can be run on multiple computer platforms making it convenient for researchers to evaluate. The CiteSpace system was originally created to identify intellectual turning points (Chen 2004a; 2004b). It does so by constructing co-citation networks among highly cited articles and enables users to manipulate the resulting graphical network in a variety of ways such as displaying multiple time periods and setting different thresholds.
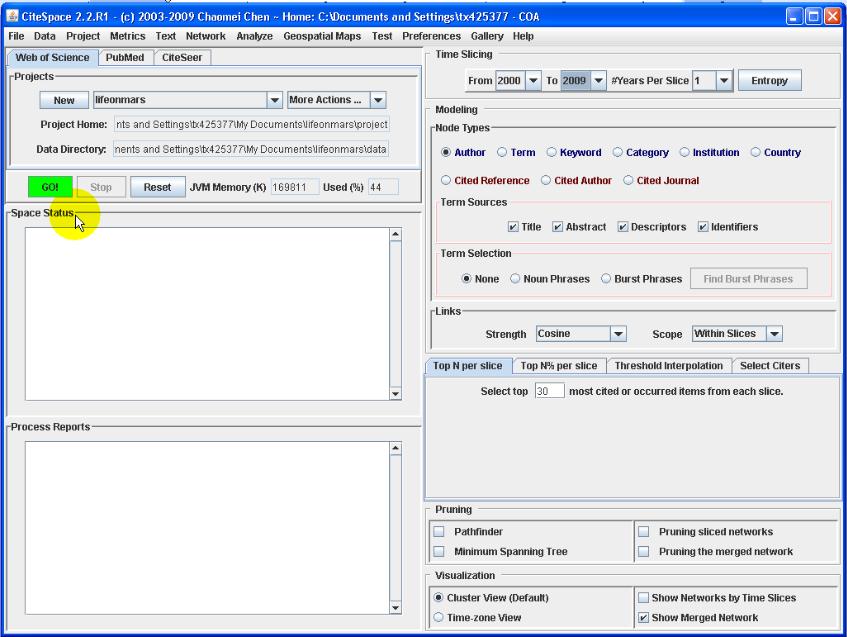
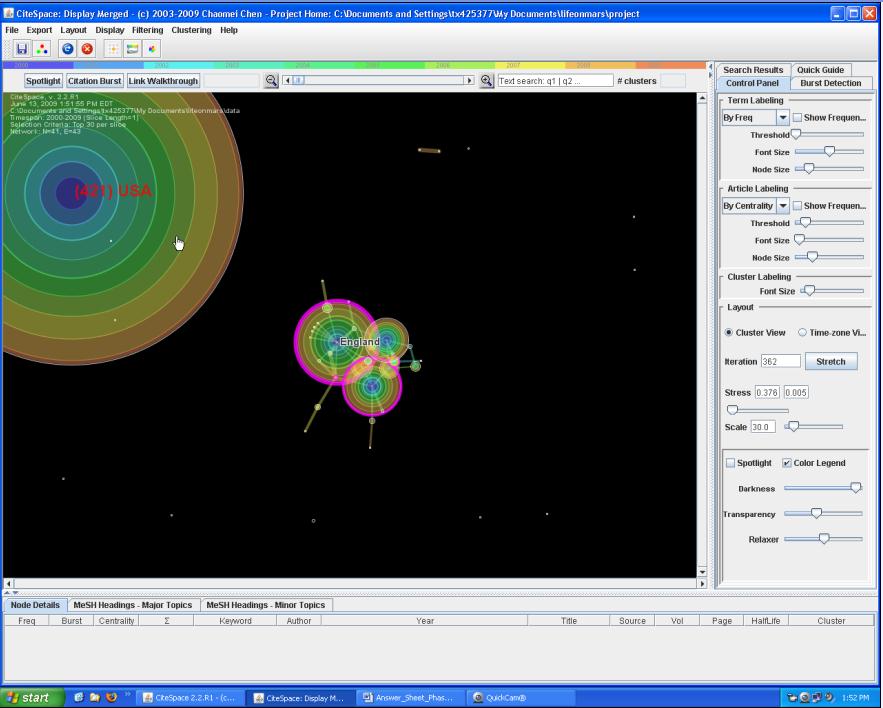
The visualization graph of the CiteSpace system is composed of nodes and lines connecting the nodes. There are nine types of nodes in the CiteSpace system (version 2.2.R1), including authors, term, keyword, category, institution, cited reference, cited journal, cited author and country. Correspondingly, nine visualization graphs were designed to represent the patterns in scientific literature. Figure 1 shows the first screen of the CiteSpace system. Users can specify the time period of the literature they want to search, choose nodes and set up thresholds in this screen. Figure 2 displays the resulting visualization graphs which correspond to the node "country." Other resulting graphs are similar to Figure 2.
Riding (1991) designed the Cognitive Style Analysis test to measure wholistic and analytic cognitive styles by comparing how fast, on average, individuals respond on a verbal task compared to an imagery task, and how fast they respond, on average, on a wholistic task compared to an analytic task. Peterson, Deary, and Austin (2003a; 2003b) demonstrated that Riding's verbal-imagery style preference and wholistic-analytic style preference ratios had poor re-test reliability. Further, they (2003a; 2003b) found that an extended version of the CSA's wholistic-analytic dimension (Extended CSA-WA) improved the tests reliability to a satisfactory level.
The Extended Cognitive Styles Analysis-Wholistic-Analytic test contains forty wholistic questions in which the user is asked to judge whether two shapes are the same or different and forty analytic questions which task the user with determining if a certain shape is embedded within another. Participants are immediately provided with information on the accuracy of their choice and are encouraged, by the system, to respond accurately but at a comfortable pace. A subject's style preference for the Extended CSA-WA is measured by comparing the median reaction times on the wholistic questions with the median reaction times on the analytic questions, so that each participant is given a wholistic-analytic reaction time ratio which identifies their relative position on a wholistic-analytic style continuum (Peterson and Deary 2006). In short, the test measures user preferences for wholistic versus analytic ways of structuring information.
We chose this test in our study because it reliably detects individual differences in tasks of a higher order, relative to wholistic and analytic stimuli (Peterson et al. 2005b; Peterson and Deary 2006).
The subjects in the study were given tasks that required them to use scenario-based topic descriptions to retrieve information from the CiteSpace system. The topics were related to life on Mars. The tasks followed the model of simulated work task situations proposed by Borlund (2000). Borlund investigated whether the application of simulated work task situations can be recommended to future evaluations of interactive information retrieval systems. In Borlund's (2000) study, data were collected consisting of twenty-four sets of responses from university students to questionnaires on searcher skills and experiences, 120 protocols of shorter verbal statements (e.g., the post-search interviews), and the 120 corresponding search transaction logs. The study found that in simulated work task situations, users' real information needs can be adequately represented by simulated information needs.
Our tasks were categorized into two groups: aspectual tasks and analytical search tasks. Aspectual tasks required the user to identify as many different aspects as possible for a given topic and save appropriate resources that cover all distinct aspects of that topic (Over 1997). Analytical search tasks were defined as tasks which need more goal-oriented and systematic analytical strategies (Marchionini 1995). Table 1 shows the topic or task description, type, and the corresponding node type in CiteSpace for each of these tasks. The CiteSpace node type indicates where the related information can be found on the CiteSpace system for this particular topic. It should be noted that in doing the tasks, the participants can use the function text search on the top of the resulting graph (see Figure 2) to help locate the right answers. This function is available to both tasks.
The following is an example analytical search task.
Scenario: As a graduate student, you want to write a paper about research on life on Mars. You are interested in how research has been done and what research has played an important role in this area during the past several years.
Task: You need to collect some papers for the literature review. You know that some papers published by Edwards HGM would be very helpful. Please find the author who has the most collaboration with Edwards HGM, then put your answer on the answer sheet.
The following is an example aspectual task.
Scenario: As a graduate student, you want to write a paper about research on life on Mars. You are interested in how research has been done and what research has played an important role in this area during the past several years.
Task: You want to identify all the countries which have many publications (>20) and also have collaborated with each other. Please put your answer on the answer sheet.
Table 1 shows the brief description of all the tasks.
| Task No. | Node Type | Task Type | Task |
|---|---|---|---|
| 1 | Institution | Analytical search | Find the name of the university that has collaborated with Caltech in 2009 and published papers. |
| 2 | Author | Analytical search | Find the author who has the most collaboration with Edwards HGM. |
| 3 | Category | Analytical search | List two subject areas/categories that only authors from the USA are involved. |
| 4 | Category | Analytical search | Identify two years that large groups (more than 20 people) have published papers. |
| A | Institution | Aspectual | Find all the institutions which collaborated on the topic in 2008. |
| B | Country | Aspectual | Identify all the countries which have many publications (>20) and also have collaborated with each other. |
| C | Keyword | Aspectual | List all the keywords that appear frequently with the word "life." |
| D | Category | Aspectual | Identify all the subject areas/categories that more papers were published in 2008 than in any other year. |
To address our research question, we designed a user-centered experiment, which collected data on cognitive styles by asking subjects to complete the ECSA-WA test first, and then to perform eight tasks shown in Table 1.
The subjects completed the cognitive test, and then performed eight tasks using the CiteSpace system. Tasks were randomly assigned using a Latin-Square design, which ensured that no subject was given the tasks in the same order.
Sixteen graduate students from different departments in the University at Albany, State University of New York, participated in the experiment. They were recruited through notices posted to several departmental listservs and by in-class announcements.
The dataset was constructed by searching the topic life on Mars, language English, document type articles, and published between the years of 2000-2009 in the ISI Web of Science. In total, 857 records were retrieved from the Web of Science system. All these documents were saved in a database, which was then uploaded to the CiteSpace sytem.
Cognitive style was measured by the Extended CSA-WA as described in the previous section. Subjects' task performance was measured by the following metrics: user satisfaction with the task results, time to task completion (in minutes), result correctness, aspectual recall, and number of mouse clicks during the task.
User satisfaction is one of the most popular performance measures (Harter and Hert 1997). As in other studies, user satisfaction was measured by asking each subject in the post-task questionnaire to rate his or her own satisfaction with the search results on a seven-point Likert Scale ranging from Not at all to Extremely (satisfied).
Time to task completion was computed from logs of the software Morae. It was measured starting from the time the user opened the visualization window until the user finished typing the answer into the answer sheet.
Result correctness, particularly in a question-answering task environment, has been widely accepted as important measure of retrieval effectiveness (Belkin et al. 2001; Yuan and Belkin 2007, 2010). In this study, result correctness was measured as the external assessor's judgment of the subject's saved answer(s). Answers were judged on a two-point scale: Incorrect (0), and Correct (1). An external assessor was used to judge the result correctness because we wanted to obtain relatively objective judgments.
Aspectual recall, a measure developed in the TREC Interactive Track (Dumais and Belkin 2005), is the ratio of aspects of the search topic identified by the subject to the total number of aspects of the topic.
Number of mouse clicks reflects a subject's actions during performing a task. It was measured by counting the total number of mouse clicks recorded in the logging software. Number of mouse clicks indicates to what extent the subject interacts with the visualization graph in the CiteSpace system.
The subjects read and signed a consent form and filled out an entry questionnaire (Appendix A) about their background, computer experience and previous searching experience. Next, they were given the Extended CSA-WA test. The test administrator launched the introductory, start up screen for the test and then selected Test/New. Users were given brief instructions about the test and were then asked to fill in the required demographic data (name, age, etc.). Once this information was entered into the system, the test began. Then they were given a tutorial of the CiteSpace system. In the tutorial, the subjects were taught how to set up the time slices and to choose the dataset to get the visualization graph. The subjects were then given information about the graph (meaning of nodes, lines, co-citation, etc). After the tutorial, the subjects did two training tasks of each task type. Before each task the subjects filled out a pre-task questionnaire (Appendix B). They were given up to ten minutes to conduct each task. The interaction between the subjects and the system was logged. After completing each task, they filled in a post-task questionnaire (Appendix C). After the subjects finished all the tasks, they were asked to complete an exit questionnaire (Appendix D). Each subject was paid $25 for his or her completion of the experiment. The experiment was conducted in a human-computer interaction lab at the University at Albany, and each subject was tested individually.
Morae 2.1 TechSmith logging software was used to log the interactions between the user and the system.
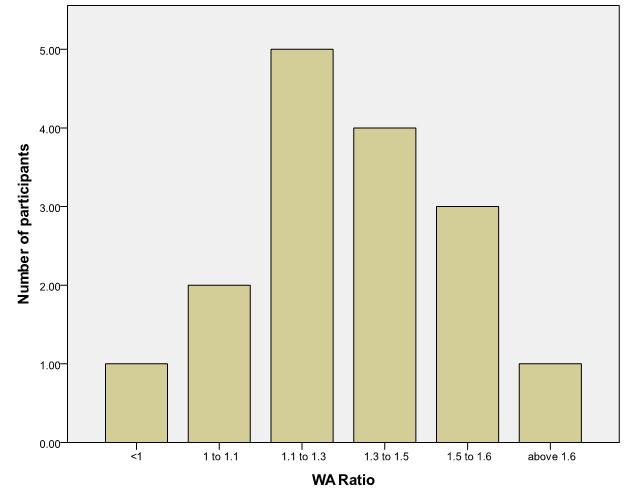
The wholistic-analytic ratio is calculated as the ratio of the median reaction time on the wholistic items to the median reaction time on the analytic items and was automatically shown in an Excel report after each subject completed the test. The minimum of the ratios is 0.96, and the maximum is 3.29. The median is 1.31. The mean is 1.42, and the standard deviation is 0.53. A lower ratio indicates a tendency toward a wholistic preference, and higher ratios indicate a tendency for an analytic preference.
Figure 3 displays the histogram of the wholistic-analytic ratio. The ratio bin of 1.1 to 1.3 has the most participants (5), closely followed by the bin of 1.3 to 1.5 which has 4 participants.
Results of task performance measures are presented in Table 2.
| Performance Measure | Minimum | Maximum | Mean | Standard Deviation |
|---|---|---|---|---|
| Time (mins) | 0.60 | 9.93 | 3.71 | 2.08 |
| User satisfaction (1-7) | 1 | 7 | 5.16 | 1.88 |
| Result correctness(for analytical search tasks)(0-1) | 0 | 1 | 0.69 | 0.47 |
| Number of mouse clicks | 3 | 146 | 38.87 | 24.71 |
| Aspectual recall (for aspectual tasks) | 0 | 1 | 0.56 | 0.37 |
As demonstrated in Table 2, in general, across all participants, the user satisfaction and the result correctness were relatively high, in comparison to other measures.
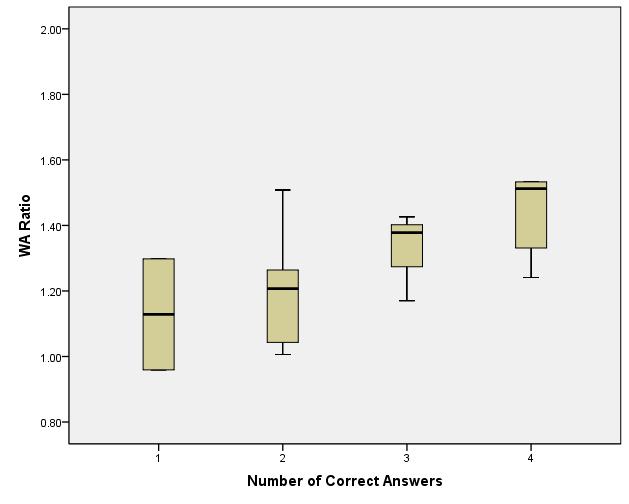
One way to investigate the effect of the cognitive styles is to see whether there were significant correlations between the cognitive styles and the performance measures. Pearson Correlation statistical analysis was performed to find the relationship between the cognitive styles and these measures. Results indicated that the wholistic-analytic ratio (mean=1.42, standard deviation =0.52) was significantly correlated with result correctness (mean=0.70, standard deviation=0.46 ), r=0.274, p=0.028. Figure 4 showed a clear trend that the group of subjects with more correct answers have higher median ratios. We did not find significant correlations between the ratio and other measures.
In order to further test the impact of the cognitive styles on task performance, subjects were divided into two groups based on their wholistic-analytic ratio: a higher ratio group (HWA group) and a lower ratio group (LWA group). Their performance measures were then compared between the two groups. The division of the higher ratio and lower ratio was chosen based on the median ratio: those whose ratios were higher than the median ratio were included in the higher ratio group and those whose ratios were lower than the median ratio were included in the lower ratio group.
Subject characteristics are shown in Table 3. Table 4 displays the computer and searching experience of the subjects. Subjects rated their computer and searching experience on a seven-point Likert Scale, from 1=low to 7=high. Subjects used computers very frequently (mean=7, standard deviation=0). They had high searching experience with the WWW (mean=6.44, standard deviation=0.81). Their computer expertise was relatively high (mean=4.56, standard deviation=0.81), and their searching expertise was also high (mean=4.88, standard deviation=0.96). Their searching experience with information visualization systems was low (mean=1.31, standard deviation=0.6). The average number of years of their searching experience was 8.94 years. Overall, the subjects in this experiment had high search experience, but little experience in searching information visualization systems.
| Characteristics | Value | LWA group | HWA group |
|---|---|---|---|
| Age | 20-29 | 4 | 3 |
| 30-39 | 3 | 4 | |
| 40-49 | 1 | 1 | |
| 20-29 | 4 | 3 | |
| Sex | Male | 3 | 4 |
| Female | 5 | 4 | |
| Highest Degree Earned | Bachelor | 6 | 6 |
| Master | 2 | 2 |
| Computer and Searching Experience | LWA group Mean (standard deviation) | HWA group Mean (standard deviation) |
|---|---|---|
| Computer daily use | 7.00 (0.00) | 7.00 (0.00) |
| Expertise of computer | 4.63 (0.74) | 4.50 (0.93) |
| Searching experience of Catalog | 5.38 (1.30) | 5.00 (1.07) |
| Searching experience of commercial systems | 3.00 (1.85) | 2.88 (1.73) |
| Searching experience of WWW | 6.63 (0.52) | 6.25 (1.04) |
| Searching experience with information visualization systems | 1.25 (0.71) | 1.38 (0.52) |
| Searching experience with Web of Science | 1.00 (0.00) | 1.00 (0.00) |
| Frequency of search | 5.75 (1.49) | 6.13 (1.13) |
| Search information found | 5.50 (1.20) | 6.25 (0.89) |
| Expertise of searching | 4.88 (0.99) | 4.88 (0.99) |
| Number of years of searching experience | 7.75 (4.20) | 10.13 (3.40) |
ANOVA results (see Table 5) did not find any significant differences between these two groups in terms of task completion time and number of mouse clicks.
the Pearson Chi-squared test showed that the HWA group got significantly more correct answers for analytical search tasks (mean=0.81, SD=0.40) than the LWA group (mean=0.56, standard deviation=0.50), Χ2=4.65, df=1, p=0.03. The LWA group identified more aspects (mean=0.58, standard deviation=0.37) for aspectual tasks than the HWA group (mean=0.54, standard deviation=0.37), the difference was not significant from the ANOVA test, F(1,62)=0.11, p=0.74.
Wilcoxon signed-rank test results showed that the LWA group felt significantly more satisfied with the results (mean=5.53, SD=1.70) than the HWA group (mean=4.80, SD=1.99), Z=-2.31, p=0.02.
| LWA group | HWA group | |
|---|---|---|
| Time (mins) | 3.68 (2.01) | 3.73 (2.17) |
| User satisfaction (1-7) | 5.53* (1.70) | 4.80 (1.99) |
| Result correctness (for analytical search tasks)(0-1) | 0.56 (0.50) | 0.81* (0.40) |
| Number of mouse clicks | 41.19 (27.39) | 36.55 (21.67) |
| Aspectual recall (for aspectual tasks) | 0.58 (0.37) | 0.54 (0.37) |
As mentioned earlier, the subjects were divided into HWA group and LWA group based on the median of their wholistic-analytic ratio. To further investigate the interaction effect of subject type and task type on such performance measures as time and mouse clicks, we performed MANOVA statistical analysis. A 2x2 MANOVA test was used to test the interaction effect of group type and task type on time and mouse clicks. Results showed that there was no significant effect on either of them.
We want to find out whether the order of the tasks had any impact on the task results. The impact of task order on time and mouse clicks was analysed using ANOVA analysis. No significant differences were found for either of them. The interaction effects of task order and wholistic-analytical ratio group on time and mouse clicks were also analysed using MANOVA, no significant differences were found.
Our results indicated that cognitive styles (wholistic versus analytic) had a significant impact on task performance measured by result correctness, but did not significantly affect other performance measures such as time, number of mouse clicks and aspectual recall. Subjects with high wholistic-analytic ratios (analytic preference) had identified significantly more correct answers than subjects of lower wholistic-analytic ratios (wholistic preference). Ford et al. (2002: 733) indicated that serialists preferred 'a more secure and predictable step by step approach' while holists showed more exploratory behaviour and 'are more likely to be open to indeed seek out such relatively unplanned encounters'. This may explain the above results. Our inference is that since the HWA group (analytic preference) tended to focus on more details of the resulting graph of the CiteSpace system and be less distracted by items of serendipity than the LWA group (wholistic preference), it is likely that the HWA group (analytic preference ) will find more correct answers.
Statistical difference was also shown that the LWA group with wholistic preference appeared to feel significantly more satisfied with the results than did the HWA group with analytic preference. This explanation can be further confirmed from the results of the post-task questionnaire, which showed that the LWA group (wholistic preference) claimed that they learned more new knowledge from the system than those of the HWA group (analytic preference). It could be that, as the LWA group felt they learned more new knowledge, they were more satisfied with the results. Satisfaction with new knowledge are also found for people with high domain knowledge. Yuan et al. (2010) found that people who have higher domain knowledge felt that they learned more new knowledge and felt more satisfied with results than those of lower domain knowledge. This may indicate, for information system design, that focusing on a global view of the system will lead to more satisfaction of people with wholistic preference.
Park and Black (2007) found out that cognitive styles (analytic versus intuitive) did not affect the searching time and the number of nodes. In our study, the cognitive styles did not have a significant impact on time and mouse clicks, which confirm Park and Black's (2007) findings. Some research on the effect of field dependence versus field independence on search performance has shown contradictory results. For example, Kim (2001) found that cognitive styles had an impact on search time, and Palmquist and Kim (2000) found that cognitive style significantly affected the search performance (measured as time and number of nodes) of novice users. This contradiction may be attributed to what has been found out from Kim and Allen (2002) that the search efficiency depends on how well each searcher fits with the specific task. Also, Palmquist and Kim (2000) identified that search experience is an important factor to consider.
We considered whether the results could have arisen from bias among the subjects with respect to their topic expertise or familiarity. The data on these factors (see Table 6) seem not to support this, as the subjects' mean self-reported expertise and familiarity, measured on a seven-point Likert Scale, are all uniformly low, for all topics, with rather low standard deviation, as well. No subject indicated topic familiarity or topic expertise of six or higher for any topic; these data are insufficient to investigate any possible interaction of familiarity with system.
| Topic No. | Topic | LWA group Mean (s.d.) | HWA group Mean (s.d.) | ||
|---|---|---|---|---|---|
| Topic familiarity | Topic expertise | Topic familiarity | Topic expertise | ||
| 1 | Find the name of the university that has collaborated with Caltech in 2009 and published papers. | 1.75 (1.16) | 1.50 (0.76) | 2.25 (1.83) | 2.00 (1.41) |
| 2 | Find the author who has the most collaboration with Edwards HGM. | 1.38 (0.52) | 1.25 (0.46) | 2.25 (1.58) | 2.13 (1.36) |
| 3 | List two subject areas/categories that only authors from the USA are involved. | 1.25 (0.46) | 1.13 (0.35) | 1.75 (1.16) | 1.63 (1.41) |
| 4 | Identify two years that large groups (more than 20 people) have published papers. | 1.25 (0.46) | 1.13 (0.35) | 1.63 (0.92) | 1.13 (0.35) |
| A | Find all the institutions which collaborated on the topic in 2008. | 1.25 (0.46) | 1.13 (0.35) | 2.25 (1.58) | 1.75 (1.16) |
| B | Identify all the countries which have many publications (>20) and also have collaborated with each other. | 1.25 (0.46) | 1.13 (0.35) | 2.38 (1.51) | 2.25 (1.28) |
| C | List all the keywords that appear frequently with the word "life." | 1.63 (1.06) | 1.50 (1.07) | 2.13 (1.25) | 1.50 (1.07) |
| D | Identify all the subject areas/categories that more papers were published in 2008 than in any other year. | 1.38 (0.74) | 1.25 (0.71) | 1.50 (0.53) | 1.25 (0.46) |
In comparison to the studies using text-based systems, we used a visualization system instead. This may explain the difference in findings between this study and some other studies, e,g., Kim (2001) and Palmquist and Kim (2000), in which cognitive style is found having impact on search time. Visualization systems work differently than text-based systems in terms of the interaction between the user and the system. It is possible that the time effect found in a text-based system would not hold for a visualization system. One factor that is worth investigation may be the user's spatial capability and its relationship with search performance using visualization systems. This will be investigated in our future studies.
In this study, we tested if and how cognitive styles would affect task performance of information visualization systems. Sixteen subjects participated in the experiment and each of them performed eight tasks using the CiteSpace information visualization system. We conclude that the cognitive styles (wholistic versus analytic) appear to have certain impact on users' task performance of information visualization systems:
For the first time, this study gives statistically significant empirical support that the subjects with analytic preference can get significantly more correct answers than subjects with a wholistic preference. The subjects with wholistic preference felt significantly more satisfied with the results than the subjects with analytic preference. It is acknowledged that the study also had limitations. We were constrained by a limited, and to some extent rather homogeneous set of subjects, and a limited number of task topics. The only realistic way to address this issue is to do more studies, which we intend to perform.
Despite the limitations, this study contributes to information science the findings of the impact users' cognitive styles (wholistic vs. analytic) have on their search performance. Information search is a very complex process, involving many cognitive and behavioural factors. It is our hope that with more and more similar studies being conducted, people's information seeking behaviour can be better understood. In the future, we aim to generalize the results of this study to other information visualization systems, for example, testing how can wholistic vs. analytical have an impact on user performance of other information visualization systems, and how wholistic vs. analytical will affect the user performance of textual-based systems. We believe that user performance of visualization systems can be improved by taking into account of different cognitive styles of information retrieval system users.
This project was funded by University at Albany Faculty Research Awards Program (FRAP).
Dr. Xiaojun Yuan is assistant professor in Department of Information Studies, College of Computing and Information, at University at Albany, State University of New York. She holds a Ph.D. degree in information science from Rutgers, The State University of New Jersey. Her research interests include interactive information retrieval, human information behaviour, information visualization, human computer interaction, user interface design and evaluation and usability testing. She can be contacted at xyuan@albany.edu.
Dr. Xiangmin Zhang is assistant professor in School of Library and Information Science, at Wayne State University. Dr. Zhang graduated from the University of Toronto with a PhD in information science, concentrating on Human-Computer Interaction. His research interests include user modelling, usability testing, user experience, personalization techniques in information retrieval, collaborative information retrieval, and digital libraries. He frequently presents at international conferences and has published in various academic journals and conference proceedings. He can be contacted at ae9101@wayne.edu
Dr. Chaomei Chen is associate professor at Drexel University. He is a Chang Jiang Scholar at Dalian University of Technology, China and was a visiting professor at Brunel University in the United Kingdom (2002-2008). He received his bachelors degree from Nankai University, China, his master's degree from the University of Oxford and his doctorate in computer science from the University of Liverpool. Dr. Chen is the author of Information Visualization: Beyond the Horizon (Springer 2004, 2006) and Mapping Scientific Frontiers: The Quest for Knowledge Visualization (Springer 2003). He is the founder and the Editor-in-Chief of the journal Information Visualization (Palgrave-Macmillan). He can be contacted at chaomei.chen@cis.drexel.edu
Joshua M. Avery graduated from the College of Computing and Information, at University at Albany, State University of New York. Joshua has a B.A. from the University of Cincinnati and an M.A. from Miami University. He is a librarian at the R.G. Flexon Memorial Library at God's Bible School and College in Cincinnati, OH and can be contacted at javery@gbs.edu.
| Find other papers on this subject | ||
Background information
1. What undergraduate or graduate degree(s) have you earned or do you expect to earn? Please list as many as applicable and the subject major associated with each degree.
_________________________________________________
Degree Major
_________________________________________________
Degree Major
_________________________________________________
Degree Major
_________________________________________________
Degree Major
2. What is your gender?
3. What is your occupation?
__________________________________
4. What is your age?
Computer and searching experience
How often do you use computer in your daily life?
| Never | Monthly | Daily | ||||
| 1 | 2 | 3 | 4 | 5 | 6 | 7 |
2. How do you rate your level of expertise with computers?
| Novice | Expert | |||||
| 1 | 2 | 3 | 4 | 5 | 6 | 7 |
3. Please circle the number that most closely describes your searching experience.
| How much experience have you had searching for information using... | None | Some | A great deal | ||||
| a. computerized library catalogs either locally (e.g., your library) or remotely (e.g., Library of Congress) | 1 | 2 | 3 | 4 | 5 | 6 | 7 |
| b. commercial online systems and databases (e.g., Dialog, Lexis-Nexis) | 1 | 2 | 3 | 4 | 5 | 6 | 7 |
| c. World Wide Web search engines (e.g., Google, Yahoo!) | 1 | 2 | 3 | 4 | 5 | 6 | 7 |
| d. CiteSpace or other systems for visualizing literatures/domains | 1 | 2 | 3 | 4 | 5 | 6 | 7 |
| e. ISI Web of Science system | 1 | 2 | 3 | 4 | 5 | 6 | 7 |
| f. other systems (please specify): _______________________________ |
1 | 2 | 3 | 4 | 5 | 6 | 7 |
| g. How often do you conduct a search (on any kind of system)? | Never | Monthly | Daily | ||||
| 1 | 2 | 3 | 4 | 5 | 6 | 7 |
| h. When you search for information, you can usually find what you are looking for. | Rarely | Sometimes | Often | ||||
| 1 | 2 | 3 | 4 | 5 | 6 | 7 |
4. How do you rate your level of expertise in searching for information?
| Novice | Expert | |||||
| 1 | 2 | 3 | 4 | 5 | 6 | 7 |
5. How many years have you been doing online searching? ______ years.
6. Please list your favorite search engine(s): ________________________.
7. Please list the operating systems (e.g., Windows) and software packages (e.g., Microsoft Office) you frequently use: __________________________________________________________________________.
Scenario: As a graduate student, you want to write a paper about research on life on Mars. You are interested in how research has been done and what research has played an important role in this area during the past several years.
Task: You need to collect some papers for the literature review. You know that some papers published by Edwards HGM would be very helpful. Please find the author who has the most collaboration with Edwards HGM, then put your answer on the answer sheet.
1. Please indicate how familiar you are with the topic of this task:
| Not at all | Somewhat | Extremely | ||||
| 1 | 2 | 3 | 4 | 5 | 6 | 7 |
2. Please indicate your level of expertise with the topic of this task:
| Novice | Extremely | |||||
| 1 | 2 | 3 | 4 | 5 | 6 | 7 |
3. If you think that you know any authors, please write them in the space below:
If you have answered this question, please circle the number that indicates how certain you are of the answer.
| Extremely uncertain | Neutral | Extremely certain | ||||
| 1 | 2 | 3 | 4 | 5 | 6 | 7 |
Please answer the following questions, as they relate to this specific task.
| Not at all | Somewhat | Extremely | |||||
|
1. Was it easy to get started on this task? |
1 | 2 | 3 | 4 | 5 | 6 | 7 |
| 2. Was it easy to complete the task? | 1 | 2 | 3 | 4 | 5 | 6 | 7 |
| 3. Was it easy to understand the system? | 1 | 2 | 3 | 4 | 5 | 6 | 7 |
| 4. Are you satisfied with your results? | 1 | 2 | 3 | 4 | 5 | 6 | 7 |
| 5. Did you have enough time to complete the task? | 1 | 2 | 3 | 4 | 5 | 6 | 7 |
| 6. How confident were you with your results? | 1 | 2 | 3 | 4 | 5 | 6 | 7 |
| None | Some | A great deal | |||||
| 7. How much information about the topic of this task has been conveyed to you by the system? | 1 | 2 | 3 | 4 | 5 | 6 | 7 |
| 8. Did your previous knowledge of the topic of this task help you? | 1 | 2 | 3 | 4 | 5 | 6 | 7 |
| 9. Have you learned anything new about the topic of this task? | 1 | 2 | 3 | 4 | 5 | 6 | 7 |
| 10. How much effort did you take to fully understand how to do the task? | 1 | 2 | 3 | 4 | 5 | 6 | 7 |
To gain a better understanding of your overall experience, we would like to ask you a few questions about your experience today.
| Not at all | Somewhat | Extremely | |||||
| 1. How easy was it to LEARN to USE this information system? | 1 | 2 | 3 | 4 | 5 | 6 | 7 |
| 2. How easy was it to LEARN to USE the resulting graph? | 1 | 2 | 3 | 4 | 5 | 6 | 7 |
| 3. How easy was it to use this information system in general? | 1 | 2 | 3 | 4 | 5 | 6 | 7 |
| 4. How easy was it to use the resulting graph? | 1 | 2 | 3 | 4 | 5 | 6 | 7 |
| 5. How well did you understand this information system? | 1 | 2 | 3 | 4 | 5 | 6 | 7 |
| 6. How well did you understand the resulting graph? | 1 | 2 | 3 | 4 | 5 | 6 | 7 |
| 7. How helpful was this system in accomplishing your tasks? | 1 | 2 | 3 | 4 | 5 | 6 | 7 |
| 8. Did you like the system? | 1 | 2 | 3 | 4 | 5 | 6 | 7 |
| 9. Did you feel lost when going through the system and performing assigned tasks? | 1 | 2 | 3 | 4 | 5 | 6 | 7 |
| 10. How did you like the system's resulting graph? | 1 | 2 | 3 | 4 | 5 | 6 | 7 |
| 11. How appropriate was the resulting graph? | 1 | 2 | 3 | 4 | 5 | 6 | 7 |
| 12. How well did labels represent the given concept, or tasks? | 1 | 2 | 3 | 4 | 5 | 6 | 7 |
| 13. How well did the navigational features (e.g., menus, panels, help) support you in completing the tasks? | 1 | 2 | 3 | 4 | 5 | 6 | 7 |
| None | Some | A great deal | |||||
| 14. How clearly did you perceive the purposes and various functions of the system? | 1 | 2 | 3 | 4 | 5 | 6 | 7 |
| 15. How satisfied were you with the system, including the navigation features and the resulting graph display? | 1 | 2 | 3 | 4 | 5 | 6 | 7 |
| Strongly Disagree | Partly | Strongly agree | |||||
| 16. Using this system was a very frustrating experience. | 1 | 2 | 3 | 4 | 5 | 6 | 7 |
|
17. I feel that this system allows me to achieve very high productivity. |
1 | 2 | 3 | 4 | 5 | 6 | 7 |
| 18. I worry that many of the things I did with this system may have been wrong. | 1 | 2 | 3 | 4 | 5 | 6 | 7 |
|
19. This system can do all the things I think I would need. |
1 | 2 | 3 | 4 | 5 | 6 | 7 |
| 20. This system is very pleasant to work with. | 1 | 2 | 3 | 4 | 5 | 6 | 7 |
| 21. I found the system unnecessarily complex. | 1 | 2 | 3 | 4 | 5 | 6 | 7 |
| 22. I think that I would need the support of a technical person to be able to use this system. | 1 | 2 | 3 | 4 | 5 | 6 | 7 |
|
23. I found the various functions in this system well integrated. |
1 | 2 | 3 | 4 | 5 | 6 | 7 |
| 24. I will use this system more in the future. | 1 | 2 | 3 | 4 | 5 | 6 | 7 |
| 25. I will recommend this system to others. | 1 | 2 | 3 | 4 | 5 | 6 | 7 |
| 26. Overall, the system was effective in helping me complete the tasks. | 1 | 2 | 3 | 4 | 5 | 6 | 7 |
27. What system features did you like most? Why?
28. What system features did you dislike most? Why?
29. What other features, that are currently unavailable, would you suggest be added to the system? Why?
30. Do you have any comments or suggestions about the display of resulting graph? Are there points that should be improved?
31. Do you have any additional comments or suggestions?
|
|
© the authors, 2011.
Last updated: 22 November, 2011 |
