Vol. 12 No. 2, January 2007
Vol. 12 No. 2, January 2007 | ||||
The availability of Internet technologies to a non-scientific or military audience has introduced fundamental changes in current societies. The generalized acceptance of such services as the World Wide Web and e-mail is fostering the diffusion of Internet-related technologies both for commercial and social purposes (Alba et al. 1997; Dickson 2000).
The Internet sector has experienced a tremendous growth in the past decade, both in terms of the development of digital infrastructures and total number of Internet users. Nevertheless, the existence of significant national and regional differences in Internet adoption, owing to deficiencies in technological infrastructures, citizens' reluctance, or lack of needed skills to take advantage of Internet technologies, limits the potential benefits provided by new information services (Hoffman et al. 1995; Hoffman & Novak 1996; White 1997). A central concern in this regard is clarifying why Internet usage varies across countries and regions.
A deeper understanding of the adoption rates, purposes and characteristics of Internet users in different nations should also be beneficial in two main areas: companies operating in domestic and international markets should account for current differences in customers' acceptance and adoption of digital services; a detailed analysis of citizens' Internet usage patterns should help public authorities develop policies aimed at further developing digital infrastructures and promoting the use of Internet-related services.
By gaining a stronger understanding of current uses of Internet services among European citizens, this paper makes three main contributions: (1) technology adoption theories are extended by means of a cross-cultural research of Internet usage; (2) European citizens are classified according to their Internet usage patterns; (3) the demographic and behavioural profiles of the identified groups are thoroughly examined, which clarifies citizens' Internet-related behaviour and how external variables are related to Internet uses.
Using as a starting point studies on the adoption of technological innovations and Internet services, this section reviews the main theoretical frameworks and factors related to individuals' use of Internet technologies. A special emphasis has been placed on reviewing the behavioural, demographic and geographic characteristics of people currently using the Internet services. This paper focuses on the analysis of such variables with regard to Europeans' Internet usage.
The use of technological innovations is influenced by diverse factors, such as technological and infrastructural factors, the economic and legal context, or dimensions related to individuals' perceptions, demographic and geographic characteristics (Korgaonkar and Wolin 1999; Rogers 2003; Venkatesh and Morris 2000). Diverse theoretical frameworks have been applied in previous studies to characterize the acceptance and use of technological services.
According to Rogers' Diffusion of Innovations Model (2003), the following factors determine the innovation adoption process: (1) innovation characteristics; (2) communication channels used to communicate its benefits; (3) elapsed time since the introduction of the innovation; and (4) the social system in which the innovation is going to spread. This model offered the following categorization of consumers, based on their adoption rates of technological innovations over time: Innovators (around 2.5%), Early Adopters (13.5%), Early Majority (34%), Late Majority (34%) and Laggards (16%).
The Technology Acceptance Model (TAM) (Davis et al. 1989) is the most-widely cited explanatory model of an individual's acceptance of a specific technological innovation. Because of the technological characteristics of the Internet, the Technology Acceptance Model is increasingly applied to account for the main antecedents and determinants (external, perceptual and attitudinal) of Internet usage (Venkatesh and Davis 2000; Venkatesh et al. 2002). In particular, several authors have selected the TAM to characterize individuals' perceptions and intentions toward the use of Internet services (Muthitacharoen and Palvia 2002; Pavlou 2003).
Recent studies especially show that more research is needed into the effect of external variables, such as demographics, geographic characteristics, previous experience with related technologies, etc., on individuals' use of technological innovations (Venkatesh and Morris 2000). This paper contributes to this stream of research by analysing how such external indicators influence the use of Internet services in a cross-national setting.
According to the purposes of this research, a review is provided of the main behavioural and socio-demographic characteristics, which have been found in previous studies to be significantly related to the use of Internet services. This review aims to provide the theoretical justification for the hypotheses in the present study's cross-national setting.
Consumers currently using the Internet show high behavioural differences compared to non-Internet users. Behaviour such as information searching have been found to be substantially different between current users of Internet technologies and non-Internet users (Peterson and Merino 2003). Among other behavioural differences, adopters of Internet services are likely to be more active information searchers (Dickerson and Gentry 1983) and have more previous experience in the use of computers and other related technologies (Bain 1999; Rogers 2003; Samiee 1998). Previous studies have also found a positive association between online shopping and variables related to previous experience and frequency of Internet usage (Loiacono et al. 2002).
Recent research has confirmed that both groups of current Internet users and non-Internet users are heterogeneous segments, which differ in their Internet-related behaviour, preferences and motivations to use diverse Internet services. A lifestyle segmentation analysis of Internet consumers identified four segments of online shoppers and four segments of online non-shoppers (Swinyard and Smith 2003). Three segments of online shoppers were identified in a recent study, according to individuals' purchase behaviour of several product categories (Bhatnagar and Ghose 2004).
Therefore, this research expects to identify different segments of European citizens on the basis of their online behaviour patterns. Variables reflecting different degrees of innovativeness in individuals' online behaviour are included in the segmentation analyses, which will enable to differentiate between more and less innovative Internet user segments. Therefore, the first hypothesis can be stated as follows:
Hypothesis 1. Different groups of European citizens will be identified on the basis of their Internet behaviour patterns.
Previous research on the use of technological innovations has found that demographic traits such as education, age, or income are significantly associated with usage rates of technological innovations (Dickerson and Gentry 1983; Zeithaml and Gilly 1987). Dickerson and Gentry showed that adopters of personal computers, an innovation with several similarities to Internet technologies since both require the establishment of new behaviour patterns, tend to be middle-aged, with higher income and highly educated.
In extensions of Technology Acceptance Model, demographic factors such as sex and age have also provided significant effects on the use of technology. Sex is a significant moderator of the relationship between TAM's core constructs (perceived usefulness, perceived ease of use and subjective norm) and the intention to use a technological innovation (Venkatesh and Morris 2000; Venkatesh et al. 2000). Age differences have also been identified in technology usage rates, suggesting that individuals' needs and preferences follow a life-cycle orientation. Age is argued to be negatively related to technology usage, usefulness perceptions and positively related to perceived difficulty (Morris and Venkatesh 2000).
Recent studies seem to confirm the existence of significant associations between user demographics and Internet usage patterns (Atkin et al. 1998). Web-users have been profiled on the basis of their demographic characteristics, suggesting the influence of sex, education, age and income on the use several Web-based services. Web-users were found to be male, highly-educated, with average income and middle-aged or young (Korgaonkar and Wolin 1999). Income and education levels are especially relevant in explaining the use of Internet services and other technological devices (Guillén 2002). For instance, the adoption of home Internet services involves several costs, both in terms of the financial resources and skills needed for the use of new technologies. Additionally to income, sex, age and education effects, there is also evidence of ethnic differences in Internet use (Katz and Aspden 1997).
With regard to the use of online shopping services, previous research has found significant sex, age and income influences (Bain 1999). Online shoppers have been found to be predominantly male, younger and wealthier than non-online shoppers (Swinyard and Smith 2003; Teo 2001).
Previous studies evidence concerns about the development and widening of a digital divide based on citizens' location. In this regard, a higher share of individuals currently using Internet services is usually located in metropolitan than in rural settings (Bell et al. 2004; Kehoe et al. 1999).
The preceding discussion suggests the existence of significant differences in Europeans' sex, age, income, location and education levels, with regard to their use of the Internet services analysed in this study and leads to the following hypotheses:
Hypothesis 2. The identified Internet user segments will show significant differences based on sex: more frequent and innovative Internet uses are expected among male respondents.
Hypothesis 3. The identified Internet user segments will show significant differences based on age: more frequent and innovative Internet uses are expected among middle-aged respondents.
Hypothesis 4. The identified Internet user segments will show significant differences based on education levels: more frequent and innovative Internet usage patterns are expected among respondents with higher education levels.
Hypothesis 5. The identified Internet user segments will show significant differences based on professional activity: more frequent and innovative Internet usage patterns are expected among respondents employed in service sectors.
Hypothesis 6. The identified Internet user segments will show significant differences based on location: more frequent and innovative Internet usage patterns are expected among respondents located in metropolitan areas.
Nevertheless, there is also conflicting evidence with regard to the demographic profiles of Internet users. For instance, a recent study did not find significant differences in Internet usage based on age or educational level and the use of several Internet services (i.e., messaging, browsing, downloading and purchasing services) did not show uniform relationships with demographic factors (i.e., sex, age and educational level). According to Rogers (2003), demographic differences of adopters and non-adopters of more mature media are becoming less and less significant. Because of the characteristics of the Internet as a communications medium in early stages of diffusion, it could be reasonable to expect that, as the use of Internet services in the population becomes more widespread, demographic traits become progressively less helpful in explaining Internet usage patterns (Korgaonkar and Wolin 1999).
Several studies confirm the existence of clear national and regional differences, with regard to the penetration of Internet technologies in the European Union (Guillén 2002; Ngini et al.2002; Quelch 1996). Although the use of Internet services is increasing rapidly in most countries, Internet markets are not developing at similar paces in all regions (Crosby and Johnson 2002). Such national and regional differences limit significantly the potential benefits offered by Internet technologies in certain countries.
Consistent with previous economical and technological trends, this study expects to find significant differences in Internet adoption between European countries. This can be stated in the following hypothesis:
Hypothesis 7: The relative distribution of the identified Internet user segments will show significant differences between European Countries: more frequent and innovative Internet usage patterns are expected in Northern European countries.
The following measures have been selected to clarify the research questions of this study:
(1) Behavioural segmentation of European citizens based on their Internet usage patterns. The following behavioural indicators of Internet usage have been selected to segment European respondents: frequency of access to the Internet, frequency of online purchases, use of eGovernment services and other uses of Internet technologies. The segmentation analyses will identify groups of European citizens with differentiated Internet usage patterns. The analysis of more advanced Internet uses, such as online shopping and eGovernment services, will enable to differentiate between more and less innovative Internet user groups.
(2) Demographic and geographic profiling of the identified segments. The previously identified segments will be profiled on the basis of demographic and geographic indicators (sex, age, education, professional activity, location and country), in order to clarify the relationship between external variables and Internet usage.
Several segmentation approaches can be applied to group Internet users or online consumers sharing certain characteristics. Researchers from the segmentation field illustrate the usefulness of a behavioural profiling of consumers, which enables the identification of consumer categories such as current users, non-users, light users, or heavy users (Ram and Jung 1990; Weinstein 2004). The purposes and frequency of product use are the principal dimensions used for behavioural segmentation. This approach has been selected to segment European citizens, according to their use of diverse Internet services. A detailed characterization of Europeans' Internet behaviour should be valuable both to private companies and public authorities, in order to ensure an effective implementation of Internet technologies in all European countries.
The empirical analyses are based on the survey data included in the Flash-Eurobarometer Nº 125 Internet and the general public, conducted on a representative sample of European citizens. The Eurobaromenter surveys are regularly carried out on behalf of the European Commission in the EU-15 countries and provide access to comparative and representative survey data in European countries, which are of great value for the analysis of international research questions. Without access to this kind of secondary data sources and due to the lack of needed financial and human resources, most researchers would not be able to carry out this kind of comparative research. Table 1 shows the characteristics of the sample and the sampling procedure.
| Sample |
|---|
| Universe: European citizens with fixed telephone lines in their households |
| Geographical scope: EU-15 countries |
| Sampling procedure: Telephone survey, using a "constant interval" procedure, in order to guarantee the representativity of each national sample for its universe |
| Sample size: 30,336 respondents (aprox. 2,000 per country) |
| Sampling error: 0.6% |
| Confidence level: 95% |
| Collected information: - Demographic variables: age, country, sex, professional activity, etc. - Behavioural indicators of the place of access, frequency and purposes of Internet usage |
| Dates: Interviews conducted between November 4th-19th, 2002 |
The constant interval sampling procedure was applied to the selection of numbers from each country's published telephone lists. First, the constant interval was determined by dividing the total number of telephone records by the desired sample size in each country (Statistics Canada 2006). Then, a group of telephone numbers, equaling the size of the constant interval, was selected from the initial records in the national telephone lists. This group of numbers represents the pool from which the first record in the national subsamples was randomly drawn. Finally, the constant interval was added to the number of the first and succeeding records, in order to obtain the country samples .
In this study, sampled telephone numbers include only fixed telephone lines. The increasing prominence of mobile phones ['cell phones' in the USA] in certain European countries, especially in Northern European and Scandinavian countries (e.g., Finland), might represent a threat to the representativeness of usual telephone surveys. A recent study carried out in the United States found individuals using only mobile phones to be significantly different in many ways from those reachable on a landline phone. According to this report, cell-only users have a considerably different demographic profile, especially with respect to sex, race, age, education and home ownership. Especifically, cell-only respondents are 'younger, less affluent, less likely to be married or to own their home and more liberal on many political questions'. With regard to their general opinion of computers and technology, these individuals are 'much more positive toward computers and technology than landline-only respondents and somewhat more positive than other cell phone users who are accessible on a landline' (The Pew Research Center 2006).
On most issues, landline samples resemble to a higher extent the characteristics of the general population (The Pew Research Center 2006). Therefore, not including cell-only users should not significantly affect the representativeness of the present study, which examines people with diverse demographic profiles. However, cell-only samples should be very useful in other studies focusing on certain kind of respondents, especially younger people.
To avoid potential biases in the national samples, χ2 difference tests were performed to compare the sample and national demographics (CIA 2006). Separate tests for each EU-country did not show statistically significant differences at the 95% confidence level, in terms of sex or age. Both the sample and national data show very similar sex and age structures. These results provided further evidence that each national subsample is representative of the population aged 15 and over.
In order to identify the different groups of European Internet users, the Two-Step Cluster procedure has been applied, as implemented in the SPSS v11.5 software. The algorithm included in the Two-Step Cluster method is very suitable for the segmentation analysis of this study for two main reasons (Chiu et al. 2001; Zhang et al. 1996): (1) It has been designed to handle very large data sets; (2) It provides great flexibility for dealing with continuous and categorical variables. Next, Discriminant Analysis has been applied to assess the internal validity of the identified segments. Finally, Correspondence Analysis has been selected to carry out the external validation of segments on the basis of socio-demographic variables.
Table 2 includes a demographic characterization of the sample, with regard to the Internet uses selected to identify the different Internet user segments. The analysis of the relative number of respondents currently using the Internet, online shopping services and eGovernment services in each country suggests the existence of significant national differences in Internet adoption in the European Union. The data evidence higher Internet adoption rates in Northern European countries. Respondents from different countries do not show uniform usage patterns of the diverse Internet services analysed in the study.
While several researchers have pointed out that demographic traits should become less relevant in explaining Internet uses (Korgaonkar and Wolin 1999), the demographic profiling of European Internet users suggests the following: (1) male respondents are more frequent users of practically all analysed Internet services; (2) middle-aged individuals are the most frequent Internet users, especially with regard to online shopping and e-government services; (3) the relative use of more innovative Internet services (i.e., online shopping and eGovernment services) increases among urban and metropolitan respondents, compared to rural citizens; (4) education (measured by the age respondents finished school) and professional activity provide some of the strongest associations with the use of digital services.
A preliminary review of the sample's socio-demographic characteristics confirms the results of previous research relating country, sex, age, education and professional category to the use of Internet services (Atkin et al. 1998; Dickson 2000; Morris and Venkatesh 2000; Swinyard and Smith 2003). The cluster and correspondence factor analysis will further clarify the existing relationships between these socio-demographic indicators and the analysed Internet-related uses.
| COUNTRY | Demographics | |||
| Total | Internet users |
E-commerce users |
E-Government users |
|
|---|---|---|---|---|
| Belgium | 6.56% | 5.43% | 3.16% | 5.58% |
| Denmark | 6.64% | 8.76% | 9.41% | 11.15% |
| Germany | 6.59% | 7.18% | 9.84% | 7.45% |
| Greece | 6.59% | 2.14% | 0.57% | 1.40% |
| Spain | 6.61% | 4.63% | 1.95% | 4.14% |
| France | 6.62% | 5.84% | 5.31% | 6.77% |
| Ireland | 6.59% | 6.68% | 5.95% | 4.63% |
| Italy | 6.60% | 4.95% | 2.49% | 4.20% |
| Luxembourg | 6.59% | 7.68% | 8.56% | 7.60% |
| Holland | 6.61% | 8.35% | 8.30% | 8.92% |
| Austria | 6.59% | 7.32% | 7.10% | 6.21% |
| Portugal | 6.59% | 3.78% | 1.44% | 2.78% |
| Finland | 6.59% | 7.45% | 6.82% | 6.17% |
| Sweden | 6.59% | 8.04% | 9.74% | 12.25% |
| United Kingdom | 7.62% | 11.79% | 19.33% | 10.76% |
| SEX | ||||
| Men | 46.09% | 52.20% | 57.99% | 55.42% |
| Women | 53.91% | 47.80% | 42.01% | 44.58% |
| AGE | ||||
| 15-24 | 15.54% | 24.14% | 19.29% | 18.39% |
| 25-39 | 28.80% | 36.56% | 42.62% | 40.53% |
| 40-54 | 24.51% | 26.31% | 27.71% | 28.93% |
| >55 | 30.99% | 12.89% | 10.28% | 12.09% |
| AGE FINISHING SCHOOL | ||||
| Not schooled | 1.78% | 0.39% | 0.33% | 0.42% |
| 15< | 22.56% | 8.65% | 5.58% | 5.17% |
| 16-20 | 44.74% | 48.79% | 46.05% | 43.24% |
| >21 | 29.18% | 41.20% | 47.05% | 50.30% |
| LOCALITY TYPE | ||||
| Metropolitan | 25.86% | 27.52% | 27.21% | 29.23% |
| Urban zone | 39.25% | 41.30% | 42.47% | 42.40% |
| Rural zone | 34.85% | 31.15% | 30.31% | 28.36% |
| PROFESSIONAL ACTIVITY | ||||
| Self-employed | 8.58% | 9.34% | 10.50% | 10.40% |
| Employee | 31.08% | 44.30% | 50.44% | 51.33% |
| Manual worker | 13.67% | 13.22% | 12.81% | 12.18% |
| Without professional activity | 46.11% | 32.53% | 25.66% | 25.55% |
In order to identify the optimal number of segments, the values of the Log-likelihood Distance measure and Schwarz's Bayesian Information Criterion (BIC) have been analysed. This information criterion weights both model fit and parsimony of different models (Magidson and Vermunt 2004). In clustering contexts, the BIC criterion has been found to outperform other classification criteria (Biernacki and Govaert 1999). A model with a lower BIC value should be preferred over a model with a higher BIC value. Nevertheless, when analysing large samples, it is difficult to identify a minimum in BIC. In such cases, researchers should examine the percentual reductions in BIC between different segment-solutions.
Table 3 shows the values of BIC for each of the fifteen potential cluster-solutions compared in this study. Each of the cluster-models is characterized by a different number of segments (i.e., cluster models including a number of groups between 1 and 15). Taking into account the existence of significant percentual reductions in BIC, as well as a high distance measure, which reflects the degree of dissimilarity between segments, a four-segment model was identified as the optimal classification of Europeans Internet users. Individuals currently not using the Internet were not considered in the cluster analyses. Including this group of Non-Internet Users, European citizens can be classified into five final segments, according to their current Internet usage patterns.
Therefore, Hypothesis 1 is supported: different groups of European citizens have been identified on the basis of their Internet behaviour patterns.
Rogers' classification is the most-widely known categorization of consumers with regard to technology adoption (Rogers 2003). Rogers' categories are related to the time needed for the adoption of technological innovations by different consumers. The present study, though, identifies segments by examining the innovativeness of citizens' Internet usage. The application of different criteria for the identification of segments limits the possibilities to draw comparisons between Rogers's and this study.
| Number of clusters |
BIC | BIC change |
BIC change % |
Distance measure |
|---|---|---|---|---|
| 1 | -926081.87 | |||
| 2 | -976801.49 | -50719.61 | 1 | 1.4523 |
| 3 | -1011542.14 | -34740.66 | 68.50% | 1.6517 |
| 4 segments (optimal solution) |
-1032344.38 | -20802.23 | 41.01% | 1.6111 |
| 5 | -1045034.21 | -12689.83 | 25.02% | 1.2023 |
| 6 | -1055490.56 | -10456.35 | 20.62% | 1.1658 |
| 7 | -1064376.40 | -8885.84 | 17.52% | 1.0612 |
| 8 | -1072716.27 | -8339.87 | 16.44% | 1.2706 |
| 9 | -1079155.62 | -6439.35 | 12.70% | 1.1649 |
| 10 | -1084600.62 | -5445.00 | 10.74% | 1.1484 |
| 11 | -1089266.25 | -4665.63 | 9.20% | 1.0033 |
| 12 | -1093914.41 | -4648.16 | 9.16% | 1.0406 |
| 13 | -1098358.57 | -4444.16 | 8.76% | 1.3373 |
| 14 | -1101534.28 | -3175.72 | 6.26% | 1.0947 |
| 15 | -1104384.87 | -2850.58 | 5.62% | 1.0265 |
In order to characterize the identified segments of Internet users, the intra-conglomerate variation has been analysed (95% confidence intervals). Next, a behavioural characterization of the identified segments is provided, based on the variables used for the identification of segments:
Segment 1: Laggards (16%)
Europeans included in the Laggards group are characterized by an occasional and infrequent use of Internet services. None of these respondents use Internet technologies to get in contact with the Public Administration (eGovernment services). The Internet is rarely used for private purposes.
Segment 2: Confused or Adverse (2%)
The frequency of Internet use among Confused or Adverse citizens is intermediate. These respondents' Internet behaviour is characterized by high variability. Confusion about Internet services seems to be another characteristic, as these respondents give Don't Know or No Answer as an answer very often. Internet technologies are rarely used for private purposes or for contacts with the Public Administration. With regard to the use of online shopping services, most of these users have never purchased online and it is the only segment showing previous negative experiences with online purchases.
Segment 3: Advanced users (19%)
Advanced Users are the most frequent users of the Internet among surveyed people. It is the group showing the most frequent use of eGovernment services, not only for administrative tasks (e.g., to search for administrative information, to fill up forms, or to carry out administrative transactions), but also for other purposes. The most frequent European online shoppers can also be found among Advanced Users.
Segment 4: Followers (19%)
Respondents included in the Followers segment use Internet technologies quite frequently, but not on a daily basis. Digital technologies are used to get in contact with the Public Administration, although not as frequently as Advanced Users. The main difference between this group and Advanced Users relates to the fact that Followers do not use Internet technologies for purchasing purposes.
Segment 5: Non-Internet users (44%)
It is important to emphasize the high share of Non-Internet Users among European citizens. Private companies and public authorities should account for the diverse factors related to the use of Internet technologies, in order to increase the Internet usage rates in the European Union.
Once the segments have been identified, the results need to be validated using the following types of variables: (1) Behavioural variables used in the segmentation process (internal validation); and (2) socio-demographic variables, not considered for the identification of segments (external validation).
In order to perform the internal validation of segments, Discriminant Analysis (stepwise estimation method) has been applied. The identified groups have been included in the analysis as the dependent variable, while the behavioural indicators used to form the groups have been included as independent variables. Five discriminant functions have been found, which classify 89.2% of cases correctly (see Tables 4 and 5). These results suggest that the identified cluster model is very suitable for predictive purposes. Sorted from higher to lower discriminant capacity, Table 6 shows all the variables included in the stepwise discriminant analysis.
| Cluster Number | |||||
| 1 | 2 | 3 | 4 | 5 | |
|---|---|---|---|---|---|
| Q6AR - Online contacts with a Public Administration to find administrative information | 15.712 | 15.932 | 15.875 | 15.993 | 0.000 |
| Q6BR - Online contacts with a Public Administration to send them an e-mail | 5.240 | 5.397 | 5.478 | 5.410 | 0.000 |
| Q6CR - Online contacts with a Public Administration to fill in forms or carry out procedures online | 7.684 | 7.849 | 7.948 | 8.013 | 0.000 |
| Q6DR - Online contacts with a Public Administration for other reasons | -3.376 | -0.539 | 9.424 | -4.041 | 0.000 |
| Q6ER - Never contacted a Public Administration through the Internet | 25.333 | 26.153 | 22.990 | 23.855 | 0.000 |
| Q6FR - DK/NA about contacts with a Public Administration | 31.679 | 376.852 | 21.456 | 29.802 | 0.000 |
| Q7BR - Occasionally purchases products or services through the Internet for private use | 43.173 | 43.934 | 42.859 | 43.252 | 0.000 |
| Q7CR - Rarely purchases products or services through the Internet for private use | 45.408 | 45.794 | 43.875 | 45.461 | 0.000 |
| Q7DR - 'I purchased, but I will never purchase again' products or services through the Internet for private use | 77.052 | 445.224 | 37.432 | 76.522 | 0.000 |
| Q7ER - Never purchased products or services through the Internet for private use | 87.712 | 79.460 | 41.811 | 91.665 | 0.000 |
| Q7FR - DK/NA about purchases of products or services through the Internet for private use | 74.874 | 271.248 | 41.862 | 78.126 | 0.000 |
| Q10AR - Private use of the Internet to send/retrieve e-mail | 10.247 | 13.581 | 16.403 | 16.126 | 0.000 |
| Q10BR - Private use of the Internet to carry-out online banking operations | 1.459 | 2.123 | 3.075 | 2.465 | 0.000 |
| Q10CR - Private use of the Internet to look for news or topical items | 4.905 | 4.763 | 6.867 | 6.212 | 0.000 |
| Q10DR - Private use of the Internet to seek health-related advice or information | 0.581 | 0.629 | 0.836 | 0.835 | 0.000 |
| Q10ER - Private use of the Internet to find job ads | 0.263 | 0.444 | 1.160 | 0.590 | 0.000 |
| Q10FR - Private use of the Internet to take part in forums or group discussions (chats) | 0.657 | 0.928 | 1.538 | 1.496 | 0.000 |
| Q10GR - Private use of the Internet to improve your training or education | 0.822 | 0.731 | 1.437 | 1.378 | 0.000 |
| Q10HR - Private use of the Internet to seek information on travels, plane tickets, etc. | 3.189 | 2.790 | 3.788 | 3.961 | 0.000 |
| Q10IR - Private use of the Internet to book tickets for shows or events | 1.047 | 0.973 | 1.763 | 1.401 | 0.000 |
| Q10JR - Use of the Internet for other private use | -5.825 | -3.278 | 6.367 | -7.702 | 0.000 |
| Q10KR - Do not use the Internet for private use | 17.042 | 24.196 | 17.576 | 15.353 | 0.000 |
| Q10LR - DK/NA about private use of the Internet | 9.319 | 284.180 | 21.839 | 14.172 | 0.000 |
| (Constant) | -61.438 | -224.293 | -46.355 | -70.864 | -1.609 |
| Predicted Group | |||||||
|---|---|---|---|---|---|---|---|
| Cluster Number | 1 | 2 | 3 | 4 | 5 | Total | |
| Original Group Cluster Number |
1 | 2585 | 0 | 277 | 1826 | 2 | 4690 |
| 2 | 27 | 571 | 7 | 9 | 0 | 614 | |
| 3 | 103 | 0 | 5382 | 219 | 164 | 5868 | |
| 4 | 643 | 0 | 0 | 5185 | 0 | 5828 | |
| 5 | 0 | 0 | 0 | 0 | 13336 | 13336 | |
| % | 1 | 55.12% | 0% | 5.91% | 38.93% | 0.04% | 100% |
| 2 | 4.40% | 93.00% | 1.14% | 1.47% | 0% | 100% | |
| 3 | 1.76% | 0% | 91.72% | 3.73% | 2.79% | 100% | |
| 4 | 11.03% | 0% | 0% | 88.97% | 0% | 100% | |
| 5 | 0% | 0% | 0% | 0% | 100% | 100% | |
| Cross Validation Cluster Number |
1 | 2585 | 0 | 277 | 1826 | 2 | 4690 |
| 2 | 27 | 571 | 7 | 9 | 0 | 614 | |
| 3 | 103 | 0 | 5381 | 219 | 165 | 5868 | |
| 4 | 643 | 0 | 0 | 5185 | 0 | 5828 | |
| 5 | 0 | 0 | 0 | 0 | 13336 | 13336 | |
| % | 1 | 55.12% | 0% | 5.91% | 38.93% | 0.04% | 100% |
| 2 | 4.40% | 93.00% | 1.14% | 1.47% | 0% | 100% | |
| 3 | 1.76% | 0% | 91.70% | 3.73% | 2.81% | 100% | |
| 4 | 11.03% | 0% | 0% | 88.97% | 0% | 100% | |
| 5 | 0% | 0% | 0% | 0% | 100% | 100% | |
| (1) Cross Validation only applies to the cases of the analysis. In this case, each case is classified based on the functions derived from the rest of cases. | |||||||
| (2) 89.2% of cases have been correctly classified. | |||||||
| Variables | Tolerance | F to delete | Wilks' Lambda |
|---|---|---|---|
| Q7ER - Never purchased products or services through the Internet for private use | 0.459 | 23464.231 | 0.00252693 |
| Q10AR - Private use of the Internet to send/retrieve e-mail | 0.865 | 2166.419 | 0.00079318 |
| Q6FR - DK/NA about contacts with a Public Administration | 0.447 | 20486.357 | 0.00228451 |
| Q7DR - "I purchased, but I will never purchase again" products or services through the Internet for private use | 0.398 | 16201.586 | 0.00193571 |
| Q10LR - DK/NA about private use of the Internet | 0.716 | 3917.686 | 0.00093574 |
| Q10CR - Private use of the Internet to look for news or topical items | 0.857 | 357.472 | 0.00064592 |
| Q7FR - DK/NA about purchases of products or services through the Internet for private use | 0.813 | 1918.008 | 0.00077296 |
| Q7CR - Rarely purchases products or services through the Internet for private use | 0.344 | 5018.137 | 0.00102533 |
| Q7BR - Occasionally purchases products or services through the Internet for private use | 0.364 | 4664.862 | 0.00099657 |
| Q10JR - Use of the Internet for other private use | 0.899 | 918.348 | 0.00069158 |
| Q6ER - Never contacted a Public Administration through the Internet | 0.301 | 2411.843 | 0.00081316 |
| Q6AR - Online contacts with a Public Administration to find administrative information | 0.416 | 1202.290 | 0.0007147 |
| Q6CR - Online contacts with a Public Administration to fill in forms or carry out procedures online | 0.623 | 337.060 | 0.00064426 |
| Q10KR - Do not use the Internet for private use | 0.832 | 441.566 | 0.00065277 |
| Q6DR - Online contacts with a Public Administration for other reasons | 0.940 | 239.458 | 0.00063632 |
| Q10HR - Private use of the Internet to seek information on travels, plane tickets, etc. | 0.839 | 121.367 | 0.0006267 |
| Q6BR - Online contacts with a Public Administration to send them an e-mail | 0.677 | 168.739 | 0.00063056 |
| Q10BR - Private use of the Internet to carry-out online banking operations | 0.918 | 117.150 | 0.00062636 |
| Q10FR - Private use of the Internet to take part in forums or group discussions (chats) | 0.940 | 38.751 | 0.00061998 |
| Q10GR - Private use of the Internet to improve your training or education | 0.920 | 31.500 | 0.00061939 |
| Q10IR - Private use of the Internet to book tickets for shows or events | 0.894 | 26.914 | 0.00061902 |
| Q10ER - Private use of the Internet to find job ads | 0.931 | 19.366 | 0.0006184 |
| Q10DR - Private use of the Internet to seek health-related advice or information | 0.905 | 8.181 | 0.00061749 |
Correspondence Analysis has been applied in order to perform the external validation of the identified segments. The following conclusions can be extracted with regard to the demographic characteristics of the Internet user groups:
Sex. The results of the correspondence analysis suggest that sex is still a useful variable to differentiate between more and less advanced Internet users. A higher share of men can be found in the Advanced Users group, whereas a higher relative number of women are included in the Non-Internet Users segment. As a result, Hypothesis 2 is supported: sex provides significant differences between the identified Internet user segments: more frequent and innovative Internet uses are found among male respondents.
Age. Very clear age trends can be identified with regard to Internet usage: older respondents report using the Internet less frequently than younger people. These results are consistent with several recent investigations suggesting the existence of age differences in Internet use.
Respondents between 20 and 29 years old can be regarded as the most advanced Internet users, followed by people between 30 and 39 years old. However, there is a significant share of Non-Internet Users among people in their thirties. Concerning the sophistication of Internet uses, it should also be noted that youngest respondents (teenagers under 19 years old) are not among the most advanced Internet users, accounting for a high share of the Laggards and Followers segments.
According to these results, Hypothesis 3 is supported: Internet user segments show significant differences based on age. Middle-aged respondents show the most frequent and innovative Internet uses among European citizens.
Education. European citizens' education also marks clear differences between segments of more and less innovative Internet users. While most Advanced Users hold college degrees, the majority of people without finished formal studies can be currently characterized as Non-Internet Users.
Hypothesis 4 is supported: Internet user segments differ greatly on the basis of respondents' education levels. More frequent and innovative Internet uses are observed among highly-educated citizens.
Professional activity. Consistent with the results based on respondents' education, Europeans show highly differentiated Internet usage patterns according to their occupation. A high number of Non-Internet Users can be found among unemployed people, which point to the existence of both financial and knowledge entry barriers in the use of Internet services. On the other hand, the highest percentage of Advanced Users has been found among service workers (white-collar employees).
These results confirm Hypothesis 5: Internet usage patterns show significant differences based on Europeans' professional activity. Service workers show the most frequent and innovative Internet uses.
Location. The results of this study suggest that location is also related to the frequency and innovativeness of Internet uses. Most advanced Internet users are usually located in metropolitan areas, whereas a higher share of Non-Internet Users can be found in rural surroundings. The importance of respondents living in smaller cities is also relatively higher among the Laggards and Confused/Adverse segments. These results confirm to a certain extent the concerns expressed in previous studies and reports related to the risk that location becomes a source for the development and widening of a digital divide between metropolitan and rural citizens (Bell et al. 2004; Kehoe et al. 1999).
Hypothesis 6 is also supported: The identified Internet user groups will show significant differences based on location. More frequent and innovative Internet users are usually located in metropolitan areas.
According to the demographic patterns identified in the Correspondence Analyses, the identified groups of European Internet users show the following demographic profiles:
Segment 1: Laggards
With respect to age, the relative number of respondents under 19 years of age is quite high in the Laggards segment (29.7% of under-19-year olds belong to this segment). Laggards tend to be manual (blue-collar) workers, with lower to middle education levels. These respondents are more likely to live in small cities and towns.
Segment 2: Confused or Adverse
The Confused or Adverse segment involves older people, with a high relative importance of citizens between 50-59 years old. These people are usually employed in non-manual jobs (white-collar workers) and are characterized by average education levels. They are also most likely to be found in smaller cities.
Segment 3: Advanced users
The Advanced Users segment is mostly composed of younger people, with respondents between 20-29 and 30-39 years old accounting for 52.7% of the segment. This segment is characterized by a greater presence of men (60%), non-manual workers (white collars), students and people with higher levels of university education. European citizens showing more advanced Internet usage patterns are mostly located in metropolitan areas.
Segment 4: Followers
The Followers segment is also mainly formed by young people (20-39 years old). Unlike in the Advanced Users segment, there is a high relative importance of teenagers (35.5% of under-19-year-olds belong to this segment). Followers can also be characterized by self-employed people, with average levels of university education and living in metropolitan areas.
Segment 5: Non-Internet users
European citizens not currently using Internet technologies are mainly people over 50 years old. The percentage of respondents not using the Internet increases with age. It should also be noted that 30.3% of people between 30 and 39 years old and 35.3% of people between 40 and 49 years old belong to the Non-Internet Users group. The Non-Internet Users segment is characterized by a higher share of women (60%), unemployed people and people without finished formal studies (87%) and with basic education levels. Non-Internet Users are to a high extent composed of citizens located in rural areas.
Country differences
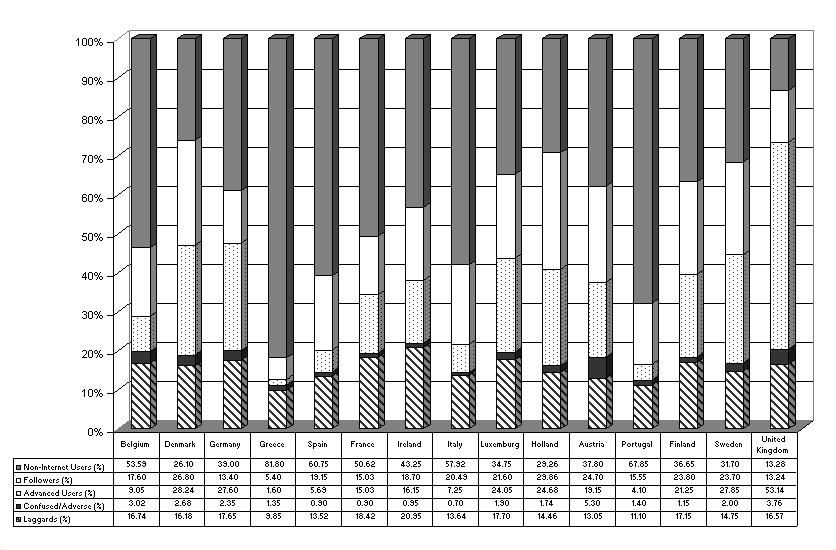
The segmentation of European citizens has been carried out without consideration of the countries where surveys were conducted (Steenkamp and Hofstede 2002). Nevertheless, it was hypothesized that the relative distribution of the identified segments in European countries would show significant differences. Figure 1 offers a graphical representation of the segments' relative weight in each European country and points to the existence of clear country trends with regard to Internet usage in Europe:
Backward countries. These countries are characterized by a high share of Non-Internet Users. The number of Advanced Users and Followers is still relatively low in comparison with other European countries. Greece, Portugal, Spain and Italy are in a backward situation with regard to Internet use.
Countries in average situation. European countries with an intermediate development of Internet usage are characterized by a moderate number of Advanced Users and a high number of Non-Internet Users. The following countries have been classified in this group: Germany (39% of Non-Internet Users and 27.6% of Advanced Users), Austria (Non-Internet Users, 37.8%; Advanced Users, 19.1%), Ireland (Non-Internet Users, 43.25%; Advanced Users, 16.1%), France (Non-Internet Users, 50.6%; Advanced Users, 15%) and Belgium (Non-Internet Users, 53.6%; Advanced Users, 9%).
Advanced countries. Countries with more advanced Internet usage patterns are characterized by a low share of Non-Internet Users and a very high number of Advanced Users. The United Kingdom is the leading EU-country with regard to Internet use (13.24% of Non-Internet Users and 53.4% of Advanced Users). Other advanced countries are Denmark (Non-Internet Users, 26.1%; Advanced Users 28.2%), Holland (Non-Internet Users, 29.2%; Advanced Users, 24.7%), Sweden (Non-Internet Users, 27.8%, Advanced Users, 31.7%), Luxembourg (Non-Internet Users, 34.7%; Advanced Users, 24%) and Finland (Non-Internet Users, 21.2; Advanced Users, 36.6%).
The analysis of the relative distribution of the identified segments and Internet usage patterns in each country (see Table 7 and Figure 1) confirms the existence of a North/South divide in the European Union, with regard to the frequency and innovativeness of Internet uses. These results provide support for Hypothesis 7, confirming more frequent and innovative Internet uses in Northern European countries. Besides the lower rates of Internet use in Southern European countries, the data show significant differences in the purposes of Internet use among Northern and Southern European respondents. Internet technologies are mostly used for communication purposes in Southern European countries, while Northern countries they are more attractive for both communications and commercial transactions.
| Southern Europe | Central Europe | Northern Europe | |||||||||||||
| Countries | Greece | Portugal | Spain | Italy | Germany | Belgium | Austria | France | Luxem-bourg | Holland | Ireland | United Kingdom | Denmark | Finland | Sweden |
| Sophistication of Internet uses | Low | Low | Low | Low | Middle | Middle | Middle | Middle | High | High | Middle | High | High | High | High |
| Relative distribution of identified clusters (%) | |||||||||||||||
| Advanced Users | 1.60 | 4.10 |
5.69 |
7.25 |
27.60 |
9.05 |
19.15 |
15.03 |
24.05 |
24.68 |
16.15 |
53.14 |
28.24 |
21.25 |
27.85 |
| Followers | 5.40 | 15.55 |
19.15 |
20.49 |
13.40 |
17.60 |
24.70 |
15.03 |
21.60 |
29.86 |
18.70 |
13.24 |
26.80 |
23.80 |
23.70 |
| Laggards | 9.85 | 11.10 |
13.52 | 13.64 |
17.65 |
16.74 |
13.05 |
18.42 |
17.70 |
14.46 |
20.95 |
16.57 |
16.18 |
17.15 |
14.75 |
| Confused / Adverse | 1.35 | 1.40 |
0.90 |
0.70 |
2.35 |
3.02 |
5.30 |
0.90 |
1.90 |
1.74 |
0.95 |
3.76 |
2.68 | 1.15 |
2.00 |
| Non-Internet Users | 81.80 | 67.85 |
60.75 |
57.92 |
39.00 |
53.59 |
37.80 |
50.62 |
34.75 |
29.26 |
43.25 |
13.28 |
26.10 |
36.65 |
31.70 |
| Internet usage patterns | |||||||||||||||
| Online shopping | 0.57 | 1.44 | 1.95 | 2.49 | 9.84 | 3.16 | 7.10 | 5.31 | 8.56 | 8.30 | 5.95 | 19.33 | 9.41 | 6.82 | 9.74 |
| Online contacts with the Public Administration | 1.40 | 2.78 | 4.14 | 4.20 | 7.45 | 5.58 | 6.21 | 6.77 | 7.60 | 8.92 | 4.63 | 10.76 | 11.15 | 6.17 | 12.25 |
| Internet use to send/retrieve e-mail | 12.4 | 24.7 | 29.5 | 32.0 | 47.6 | 34.6 | 54.1 | 37.1 | 52.9 | 64.8 | 46.7 | 73.7 | 63.7 | 51.4 | 58.5 |
| Online banking operations | 1.3 | 6.9 | 7.9 | 6.7 | 21.3 | 14.3 | 22.7 | 15.1 | 14.2 | 33.4 | 13.7 | 28.5 | 37.2 | 42.9 | 35.1 |
| Internet use to look for news or topical items | 6.5 | 24.5 | 34.7 | 34.9 | 46.2 | 28.3 | 51.6 | 32.6 | 47.4 | 54.3 | 41.3 | 59.1 | 60.4 | 41.6 | 52.4 |
| Internet use to seek health-related advice or information | 3.0 | 9.7 | 12.5 | 19.9 | 26.4 | 16.7 | 20.8 | 13.1 | 21.3 | 39.0 | 27.2 | 39.7 | 29.2 | 23.8 | 21.0 |
| Internet use to find job ads | 2.3 | 5.1 | 10.1 | 9.9 | 21.6 | 11.6 | 12.8 | 14.7 | 8.2 | 25.5 | 17.3 | 30.5 | 26.0 | 24.2 | 27.8 |
| Internet use to take part in forums or group discussions (chats) | 2.9 | 8.8 | 16.8 | 8.8 | 13.8 | 11.1 | 13.5 | 11.5 | 12.3 | 18.4 | 7.4 | 15.1 | 12.9 | 15.3 | 12.8 |
| Internet use to improve your training or education | 7.7 | 18.7 | 21.5 | 24.9 | 34.0 | 17.3 | 28.4 | 19.9 | 19.0 | 24.1 | 22.7 | 37.4 | 18.3 | 29.9 | 13.7 |
| Internet use to seek information on travels, plane tickets, etc. | 4.4 | 12.9 | 20.4 | 25.2 | 42.0 | 26.4 | 29.7 | 28.5 | 36.1 | 52.6 | 44.1 | 66.1 | 48.1 | 41.5 | 49.8 |
| Internet use to book tickets for shows or events | 0.9 | 4.8 | 8.1 | 8.3 | 19.3 | 12.5 | 13.2 | 11.5 | 15.9 | 24.6 | 23.3 | 33.0 | 27.5 | 15.2 | 30.8 |
As expected, different segments of European Internet users have been identified on the basis of behavioural variables related to the purposes, frequency and innovativeness of Internet uses. Five groups have been differentiated with regard to respondents' Internet usage patterns: Laggards, Confused or Adverse, Advanced Users, Followers and Non-Internet Users.
The segments have also been characterized based on external variables, such as country, sex, age, occupation, education and location. Significant differences between groups of European Internet users have been identified for sex, age, occupation, education and location. These results have confirmed all hypotheses related to the demographic characterization of European Internet users.
This study expected to find significant country differences in Internet usage in the European Union. Authors anticipating a fast generalization of Internet technologies in Europe will find that only Northern EU-countries are in an outpost situation, whereas Southern European countries still lag far behind. Therefore, the results have also provided support for the hypothesis related to the existence of a North/South divide in Europeans' Internet use. There are also differences in the role played by the Internet channel in Northern and Southern European countries. Internet technologies are mostly used for communication purposes in Southern European countries, while Northern countries are more attractive both for communications and commercial transactions.
The results confirm previous research into the existence clear age differences in Internet usage (Zeithaml and Gilly 1987). Older people report to use Internet services less frequently than younger people. Respondents in ages between 20 and 39 years old show the most frequent and advanced uses of Internet technologies. However, the higher importance of younger people among Advanced Users and lower Internet usage rates among older respondents could be regarded as a transitory situation, due to relatively recent introduction of Internet technologies in the European market. It should also be noted that teenagers (respondents under 19 years old) are not among the most advanced user segments. Two arguments could account for this behaviour: teenagers' lack of economic independence prevents them to use the Internet for purchasing purposes or contacts with the Public Administration; in addition, due to the high usage rates of mobile phones among teenagers, the cheap means of communication provided by fix Internet services (e.g., e-mail and instant messaging services) may be replaced by mobile communications (e.g., through SMS messages).
The characterization of Internet user segments also provides clear differences with regard to sex, occupation, education and location. Based on these variables, people showing more advanced and frequent Internet uses can be characterized as men, service workers, highly educated and living in metropolitan areas. On the other hand, a higher share of women, unemployed, illiterate and rural citizens is found among less advanced Internet-usage groups.
This research confirms the existence of diverse entry barriers to the use of digital services, arising from country, age, financial, educational and location-related factors. Such entry barriers are contributing to the development and widening of a digital divide among citizens of the European Union. Both private companies and public authorities should account for these factors, in order to reduce the number of European citizens currently not using Internet technologies (44%).
Internet skills are becoming a new type of general skill, which is increasingly needed to perform certain daily activities (OECD 2002). Thus, governments are implementing an array of policies targeting different segments of the population in order to promote basic and advanced Internet skills. In this regard, the behavioural and socio-demographic characterization of Internet usage patterns should be valuable both to companies and public authorities, in order to develop the suitable Internet promotion strategies targeted at each group of users and non users of Internet services.
While the patterns of Internet uptake have been similar everywhere, usage levels differ significantly across countries and regions (e.g., wide national differences exist in the share of online shoppers). Differences in access to Internet technologies and personal computers give rise to a digital divide between individuals able to benefit from the opportunities provided by Internet technologies and those who cannot. Additionally, as access issues are progressively reduced, social exclusion challenges are expected to arise from more complex use divide issues (OECD 2004). Such social differences may appear between skilled and non-skilled individuals to use the Internet for certain purposes (e.g., relevant Internet uses like e-learning and online job searching).
Digital divide issues should be regarded as main challenges in the diffusion of Internet technologies (Room et al. 2004). According to OECD reports, technology diffusion to individuals, IT education and training initiatives and the promotion of trust online are key policy areas for governments and private firms with regard to social inclusion issues (OECD 2002, 2004).
The segments identified in the present study could be very useful for European public authorities, where government initiatives, through technological training and promotion, are relatively more relevant in bridging the digital divide between users and non-users of Internet services. While public support is a characteristic of most countries in the promotion of Internet technologies, significant national differences in the extent of digital divide require different strategies to overcome the problems raised by social exclusion in Internet use.
Concerning Europeans' use of the Internet for commercial purposes, this paper has shown that the use of online shopping services is limited to one single segment (Advanced Users). The remaining segments are only willing to use the Internet for less-risky purposes (e.g., personal communications through e-mail and chats) and, in the Followers segment, for contacts with the Public Administration. Consumers may associate a smaller risk with e-Government services than with online shopping services. Therefore, e-Government services are likely to be a suitable way to introduce consumers into online shopping services, since the experience with e-Government services can help people feel confident to undertake e-commerce operations. It is important for European companies that the number of online shoppers reaches threshold levels in different countries, in order to increase the suitability of the Internet as a domestic and international distribution and purchasing channel.
With regard to Non-Internet Users and Laggards, governments should facilitate both training and easier of access to Internet technologies. These segments, which are composed mainly of people with little training, employed in basic jobs and located in rural or less-favoured areas, may be excluded from the huge advantages provided by the Internet. Unless these policies are implemented, Internet services may become a new source of social exclusion.
Governments should foster Internet education and training to face complex social exclusion challenges, mainly arising from access and use digital divides. General and specific policies may be needed to target socio-economic groups currently lagging in the use of Internet services.
The characterization of Internet user segments also provides clear differences with regard to sex, occupation, education and location. Based on these variables, people showing more advanced and frequent Internet uses can be characterized as men, service workers, highly educated and living in metropolitan areas. On the other hand, a higher share of women, unemployed, illiterate and rural citizens is found among less advanced Internet-usage groups.
Future research could overcome some of the main limitations of this study and further clarify how Internet adoption is evolving among European citizens:
The use of secondary data involves several limitations, mainly related to the lack of flexibility in the measures to include in the study. Nevertheless, this lack of flexibility in the study design stage is clearly balanced by the access to representative and comparative transnational survey data in all countries of the European Union.
Further research should check if demographic and geographic differences continue to exist between more and less advanced Internet-usage groups in the future. Among other topics, future studies should clarify if the age characterization of current Internet users continues to exist.
Two additional lines of investigation should be approached in the future. It should be analysed if country differences exist in the demographic characterization of Internet-usage segments. Additionally, the existence of potential differences on the regional level should also be examined. The relevance of such factors as the degree of economic development and location (differences between metropolitan and rural areas) in the configuration of segments also suggests the existence of regional trends in Internet usage.
The authors would like to thank the Central Archive for Empirical Social Research (University of Cologne, Germany) for their support and providing access to the database used in this study.
| Find other papers on this subject | ||
© the authors, 2007. Last updated: 18 December, 2006 |
|