Designing a business intelligence-based monitoring platform for evaluating research collaborations within university networks: the case of UNICA - the Network of Universities from the Capitals of Europe.
Muhammet Damar, Güzin Özdağoğlu, and Luciano Saso
Introduction. The scope of the study is to provide decision support for academic networks to reveal the efficiency of the collaborations among the researchers. This research proposes a monitoring environment to evaluate collaboration patterns in all research areas and foster innovative, interdisciplinary, and international research.
Method. The paper presents a novel application framework for the Network of the Universities from the Capitals of Europe (UNICA) based on business intelligence. The framework is applied by analysing co-authorships through data from the Web of Science (2015 and 2020).
Analysis. Co-authorships between member universities are queried from the large-scale bibliographic data. A new bibliometric data warehouse is created with the integrated use of database operations with text analytics. Dashboards associated with the data warehouse contain many performance indicators and statistics based on interactive filters.
Results. The findings cover many features of the monitoring environment and statistics in various research domains (Life Science and Biomedicine, Physical Sciences, Technology, Social Sciences, Arts, and Humanities). User-friendly geographical maps visualized the most significant collaborations in various domains.
Conclusions. The study provides an intellectual contribution by revealing the differences in collaboration levels of the research areas and indicating the policy requirements to close these gaps.
DOI: https://doi.org/10.47989/irpaper945
Introduction
Scientific collaborations globally emerge as the scientific capacities of the countries go beyond their borders, and thus the dissemination of knowledge also accelerates in the same direction (Leydesdorff and Wagner, 2008). National and international academic collaborations improve inter-institutional relationships and provide appropriate environments for creating values that increase scientific and industrial benefits by coming together from different perspectives. Policymakers should follow effective measures to reveal the collaborative linkages among the countries and thus create new policies to balance the asymmetric benefits from the collaborations (Chen et al., 2019).
Data regarding the number of papers that include authors from different countries may provide partial information about collaborations (Katz and Martin, 1997). Still, we need these data to initialize the investigation since co-authorships are more straightforward means of evaluating collaboration (Melin, 2000). Tsai et al. (2016) emphasized a similar idea by stating that revealing the big picture necessitates scientific research to make collaborations visible and increase their widespread impact. Methodologies such as bibliometrics and scientometrics (Jacobs, 2010; Wagner and Leydesdorff, 2005) are the approaches developed for this purpose. The methodologies reveal the basic patterns of a particular subject in the literature, the connection points with different topics and fields, and the bibliometric elements of particular techniques. Although the theories put forward in the past and the tools and techniques used by these theories are similar, differences exist in the subjects focused on and the dimensions within the scope of the analysis (Hood and Wilson, 2001; Björneborn and Ingwersen, 2004; Garfield, 2009; Yang and Yuan, 2017). The methodologies include metrics, basic statistical summary tables, charts, and advanced text and network analytics that enable these visualizations (Glänzel and Schubert, 2004; Liu et al., 2014).
The co-authorship aspect of bibliometrics is frequently used to identify research collaborations (Melin and Persson, 1996; Ponomariov and Boardman, 2016). In addition to the indicators, tabular reports and co-authorship networks (Glänzel and Schubert, 2004; Kumar, 2015) identify collaborations among the authors, institutions, organizations, journals, and other entities in the bibliometric datasets. It is also possible to add more dimensions as legends on these networks, e.g., time and clusters. Many studies investigate collaborative research within the selected frameworks, e.g., countries, research areas, and institutions; and the “Theoretical background” section exemplifies these publications.
International science arises as a communications network distinct from national systems with its own internal dynamics (Hicks and Katz, 1996). National systems have regulations and structures in place to facilitate scientific communication, whereas the network operates primarily as a self-organizing system at the global level (Leydesdorff and Wagner, 2008). This self-organizing nature and its dynamics should still produce outcomes based on common strategies and targets, which necessitate “strategic intelligence” from a managerial perspective. Science and technology foresight, innovation policy evaluation, and technology assessment are all typical strategic intelligence techniques (Rotolo et al., 2017), and scientometrics or related methodologies can serve as a complementary component for intelligence. Combining the abovementioned components and perspectives, this study proposes an application framework based on business intelligence to reveal collaboration patterns in academic or university networks, e.g., UNICA.
Bibliometric data can mediate the assessment of joint science and technology efforts to see the outputs of policies and activities carried out in strategic alliances in the scope of strategic intelligence if the relevant data is processed in a business intelligence framework. Business intelligence covers the processes and technologies that businesses have used to manage large-scale raw data in the past and current data and then turn them into meaningful information. Because of this significant information, businesses or institutions can see trends in operations and make predictions for the future. The institution can create a series of valuable strategies that will enable effective decisions with predicted results (Foley and Guillemette, 2010; Elena, 2011; Pham, 2016). Although the basic process of the business intelligence system is based on the transformation of data into knowledge, decisions, and, eventually, action, it also has a general architecture (Popovič et al., 2009; Sharda et al., 2015; Skyrius et al., 2018).
In this context, the proposed business intelligence application framework is developed to track the dynamics and patterns of collaborations. UNICA is a collaborative academic network with 55 universities from 37 European capitals, and this association is a strategic alliance with a clear mission, vision, and goals (UNICA, 2021). Universities and academic networks such as UNICA need decision support to maintain their activities; thus, business intelligence would provide a relevant set of tools and technologies for supplying the necessary support. For university networks in particular, the main goal is to improve collaborations among members, and the network executives should monitor the level of collaboration. For this purpose, bibliometric data provided by the scientific databases comprise a source for the raw data to be processed in business intelligence environments in order to develop such a monitoring platform. We created a data warehouse from pairwise co-authorships obtained from pre-processing the bibliometric data between 2015-2020 retrieved from the Web of Science. Collaboration maps and other dashboard components developed from this data warehouse provide interactive navigation between various visuals and enable querying according to the research areas and different dimensions.
In summary, the paper presents the procedure for handling a large-scale bibliometric dataset on the basis of the proposed approach for obtaining a relevant data warehouse for obtaining subsets in order to discover co-authorships and research areas according to geographical location. Accordingly, the system took its roots from BI to develop a customized monitoring and reporting platform. The application provides multidimensional insights into discovering collaborations while suggesting a process-monitoring approach for UNICA members and managers.
Theoretical background
This research presents an application framework that uncovers the collaborations between researchers in an academic network, i.e., UNICA, regarding business intelligence and co-authorship connections. The development process of the application framework and its monitoring platform has both socio-technical and methodological components. In this context, this section summarizes the related studies and ultimately explains the position of this study in the literature.
Scientific collaborations and networks
Since Francis Bacon, debate has continued regarding which knowledge domain is essential for the future of societies, which scientific research should be fostered, and how to choose science and technology policies (Stehr, 2005). The reason behind the current version of the debate is that the major economies of recent years have been developed based on knowledge (Dunning, 2000). Higher education institutions that provide strategic and transformational resources are among the key players in creating and growing this knowledge. The essence of knowledge policy and evaluation goes beyond traditional science and technology policies. There is a need for regulations and initiatives that will guide each nation on its path to becoming a knowledge society that will encourage the creation of essential resources (Schmidt, 2007). Creating relevant knowledge goes beyond institutions and even countries and has become one of the underlying reasons for establishing international networks.
Managing research collaborations between countries requires special efforts since research dynamics and conditions are not similar. Chen et al. (2019) investigated the phenomenon of international research collaboration in terms of its historical background. They emphasized the importance of such a review for discovering the dynamics of a research domain. Accordingly, Wagner et al. (2019) conducted in-depth research to investigate the novelty, creativity, and conventionality in internationally collaborated papers and isolated many factors that impact collaborative research efforts in basic areas. Academic networks provide the necessary environments to encourage and support collaborations by means of well-established research policies.
Literature discussing the increase in such international linkages or networks in science has been growing rapidly. These discussions take shape under three categories: quantitative approaches to reveal the co-authorship networks through scientometrics or related methodologies; social science research on the dynamics of collaborations; and policy research that analyses the contributions of collaborations for funding and outputs (Wagner and Leydesdorff, 2005).
Social and political research shows that higher education institutions are trying to maintain and improve their position in an increasingly competitive environment in responding to social, economic, and political changes (Daniel, 2015). In addition, countries that desire to maintain the intellectual developments growing at the global level in their own countries seek out new science and technology policies in this direction, and higher education institutions try to adapt to these policies (Skolnikoff, 1993). Although higher education institutions and individuals compete, it is observed that effective collaboration mechanisms have been established in the light of common strategies and objectives when the subject is to produce science and knowledge and to share funds and resources for this purpose. For example, special development assistance initiatives between Scandinavian, Latin American, and African countries have resulted in the formation of global linkages or networks between these countries. Project calls, in which the European Union has dramatically supported research proposals of two or more countries, also affect the growth of the network in the relevant regions (Wagner and Leydesdorff, 2005).
As scientific capacity increases and cooperation develops, information flows between institutions and countries also progress. In order to institutionalize these collaborations, networks are formed around specific common criteria, such as region, capitals, or research domains. The European University Association, the Asian University Association, the Latin-American Network of Universities, UNICA, and Association of African Universities are only a few examples of these networks. Countries within this sharing environment may need to produce more conscious policies and actions for the community they are members of, and scientifically more advanced members may need to support and encourage less developed members to improve cooperation and research quality in the entire network. At this point, the effectiveness of the established network comes to the fore. Investments in science, policies developed, economic gains, and global collaborations may all be measured (Leydesdorff and Wagner, 2008). Achievement of efficiency and effectiveness may only be possible by measuring the collective scientific productivity of community members. Such measurement requires large-scale data including many dimensions, e.g., bibliometric data with geographical dimensions.
Various qualitative and quantitative approaches, such as data visualizations, graph modelling, clustering, and cognitive mapping, can process these dimensions. The approaches in this research domain enable discovering, integrating, and reusing scientific productions from bibliometric data and play a crucial role in innovative research (Shotton et al., 2009; Osinska and Klimas, 2021). Domain knowledge graph modelling, for example, is one of the essential techniques used to express the crucial characteristics of a specific study field. It is necessary for the visualization, retrieval, bibliometric analysis, and findings of scientific publications. The information that represents academic production significantly aids this capacity. Title, author, publisher, subject keywords, and other elements traditionally describe metadata (Leydesdorff and Persson, 2010; Liu et al., 2014).
Designing an effective monitoring mechanism can be achieved with an information system (Chung and Zeng, 2016) structure for users at all levels. Such an information system should have data storage, pre-processing, visualization, analysis, and reporting capabilities. In this sense, researchers can embed data analytics in the scope of bibliometrics and related methodologies into a holistic information system that would serve as a monitoring platform for networks. Therefore, they need data-driven decision support mechanisms with the help of the significant portfolio of bibliometric data and the technological infrastructure of business intelligence.
Related work on research collaborations through co-authorships
Various research papers in the literature focus on identifying collaborations. The characteristics that make these studies original and allow them to be published in prestigious journals are that each research project has its own dynamics and setting for providing information in different dimensions within each framework. Therefore, these studies inspire and contribute to this paper in terms of their findings and research design.
For example, the scope of the studies that investigate collaborations regarding co-authorships has been organized depending on the research areas. Cunningham and Dillon (1997) identified authorship patterns in information systems in articles published in the selected journals by creating summary tables of authors’ collaborations, gender, location, institutions, and journals. Velden et al. (2010) evaluated the patterns of collaboration in co-authorship networks at the mesoscopic level by integrating the data collected from the interviews and the statistical data obtained from network analysis in three research fields of chemistry. Khasseh et al. (2017) investigated the relationship between researchers’ productivity and performance with their centrality measurements of researchers in infometrics by calculating the social network metrics in UCI.net to determine the rankings among journals and authors regarding the research area.
Many researchers have investigated the cooperation of various countries, for example, Chinese scientific collaboration between China and the US (Tang and Shapira, 2011), scientific collaboration in the tourism field between Australia and New Zealand (Benckendorff, 2010), and patterns of collaboration at the country and continental levels in Africa (Pouris and Ho, 2014).
Visualising and interpreting data on a particular network can become complicated due to the rapidly increasing data size. However, researchers in information technology have developed many tools and techniques (Miller, 2011) to facilitate these analyses, and advances in information enable new capabilities for network analysis such as identifying opinion leaders in discussion forums (Song et al., 2007); highlighting expertise in networks (Zhang et al., 2007); analysing the research trends and collaboration patterns in Iran (Nikzad et al., 2011), Spain (Ardanuy, 2012), and Hungary (Inzelt et al., 2009); evaluating the authorship trends and collaboration patterns with the help of VOSviewer software (Koseoglu et al., 2018); comparing collaborations in different field of science (Lariviere et al., 2006); discovering collaboration levels regarding the trends in authorship patterns and the authors’ collaborative research (Khaparde and Pawar, 2013); revealing business stakeholders (Chung et al., 2009); analysing inter-university and international collaboration networks (Olmeda‐Gómez et al., 2009); investigating collaboration patterns in national and international scientific databases, i.e., the Web of Science Social Science Citation Index (WoS-SSCI) and ULAKBIM; and visualizing research patterns of infectious disease transmission (Zeng et al., 2010).
Akakandelwa (2009) conducted informetric research on papers published by faculty members at the University of Zambia using the Thomson Scientific database to discover authorship patterns and collaboration. Abramo et al. (2009) investigated research collaboration between Italian universities and industry with the help of bibliometric analysis on the dataset retrieved from the Observatory of Public Research database. Abramo et al. generated a data warehouse based on their criteria and revealed collaboration patterns based on several dimensions, i.e., sectors, journals, and research areas.
A few papers exist where locational framing has been reduced to institutional levels. Perianes-Rodríguez et al. (2010) developed a method for detecting, identifying, and visualizing research structures through co-authorship networks along with the internal dynamics at the Carlos III University of Madrid. The implementation of the proposed approach was presented using a bibliometric dataset that was retrieved from Web of Science using the papers belonging to the academics at the selected unit. Cheng et al. (2013) identified the degree and type of research collaboration in Malaysia through co-authorships. Lundberg et al. (2006) focused on the role of co-authorships for identifying collaborations and evaluated the usability of co-authorships for university-industry collaboration by comparing the results with industrial funding information.
Researchers have also emphasized journal-level collaborations in other papers. For example, Hou et al. (2008) developed collaboration networks for the journal Scientometrics from records of its articles in Web of Science by conducting social network analysis, co-occurrence analysis, cluster analysis, and frequency analysis of title words. Hou et al. visualised the microstructure of collaboration networks in the field of scientometrics during the 1978-2004 period and presented the rankings among the authors, collaborative studies, and keywords. Mohammadamin et al. (2017) focused on the same journal to reveal collaborations through co-authorship networks and related metrics to reveal rankings among the authors and institutions. Elango and Rajendran (2012) demonstrated the authorship trends and collaboration patterns in marine science based on the bibliometric data retrieved from the Indian Journal of Marine Sciences. They applied metrics including a collaboration index, a collaboration co-efficient, and a dominance factor in addition to the test of Lotka’s law.
Although the focus of the studies included here is on collaborations investigated through bibliometric data and in the context of co-authorship, the element that distinguishes the reflections from each other is how the concept of co-authorship is handled. While metrics and basic statistics are clearly at the forefront in some studies, in others, network visuals and performance indicators of the cooperation density in these networks stand out.
Analysing co-authorships through bibliometrics requires special tools, e.g., Google Earth (Google Maps); visualising networks, e.g., Pajek and Gephi; or software packages, e.g., VOSviewer and CiteSpace; and reporting summaries, e.g., Web of Science and Scopus. These tools overlay the network of relationships among addresses in scientific publications and visualize patterns of international collaboration using a projection on a world map (Hicks and Katz, 1996). Each tool has different features, and each application has various constraints (Leydesdorff and Persson, 2010).
The originality of the paper
The culture of compliance with external stakeholders and policymakers has continually increased its importance (Olsen, 2014). Higher education institutions are under increasing pressure to be more accountable to their stakeholders (Macfadyen et al., 2014). When relevant data are achievable, analysts and decision-makers can gather key inputs which can develop knowledge with a higher future impact such as geographical distributions of key organisational actors in collaborative networks and revealing main scientific and technological fields (Rotolo et al., 2017). Business intelligence volume and scale of available data, visualisation, and reporting technologies have enabled higher education institutions to develop interactive decision support tools that facilitate institutional decision-makers to access information specific enough to support their decision-making needs (Daniel, 2015; McCoy and Rosenbaum, 2019; Williamson, 2016). In this context, this paper proposes a business intelligence framework with various dashboards that can serve as a decision support system for monitoring the level of research collaborations in networks.
Similar to other studies, this study measures collaboration levels by extracting and analysing co-authorship information from bibliometric data. Unlike existing studies, this research primarily offers an application framework for large networks where higher education institutions are members from various countries. This paper provides an efficient application framework designed in a business intelligence environment to monitor research collaboration levels in different dimensions, such as the main research and sub-areas, by using co-authorships, country, institutions, and other features observable in bibliometric datasets. Therefore, the platform provides decision support to users at different levels, e.g., member institutions and network executives, by offering customisable visuals where many more dimensions can be processed interactively with the help of business intelligence techniques and tools for efficiently managing information with relevant bibliometric data. In this sense, the findings revealed the intensity of collaborations in basic or main research areas and presented many insights about the areas in which collaborations are relatively few. Therefore, the results provided an information infrastructure for the network to develop the policies necessary to improve research impact.
Different platforms collect and process bibliographic data and produce reports for institutions including the Current Research Information System, InCites, and SciVal (EuroCRIS, 2022; Elsevier, 2022; Özel et al., 2020). In particular, the Current Research Information System has an integrated structure that can also monitor inter-institutional research (Sivertsen, 2019; Schlattmann, 2017). What makes this study different from the existing platforms is that it is a voluntary effort developed entirely for the specific needs of the relevant network, without requesting data from its members.
The president of UNICA participated in the dashboards’ requirement analysis and design processes prepared through a large-scale data set of 55 different institutions. The resulting design developed gradually according to feedback and recommendations. Although this business intelligence based monitoring platform processes large-scale and complicated data and analytics behind the scenes, its use does not require advanced skills in bibliometrics, scientometrics, or related methodologies. One of the critical features of the system design is its capacity for flexible expansion and development combining new dimensions and tables in the database and for setting new analytics and visuals by integrating institutional data with bibliometric data.
Materials and methods
Research questions
In this paper, we address the issue of monitoring research collaborations within academic networks and propose an application framework based on designing a business intelligence platform by using tools and techniques along with bibliometric data. Hence, the main research question here is to what extent can network executives monitor research collaborations via a business intelligence framework fed by a bibliometric dataset converted from a bibliographic data source? In this context, further questions that have arisen can be listed as follows:
- What are the collaboration levels between the UNICA members?
- What are the differences in the levels concerning the main research areas?
- What are the differences in the levels concerning the research sub- areas?
- What are the differences between itself and UNICA members by years, by main research area, by sub-research area, and by keywords?
- Which researchers are more active in collaborations?
- Which institutions are more active in research collaborations?
Dashboard designs in the proposed framework cover the following components and visuals to answer the questions above along with the filtering options listed below:
- visualisations of collaborations in a geographical context (flows on the world map)
- number of co-produced articles and collaborations by years,
- article metadata with collaborations by years (title, abstract, journal, researcher(s), used keywords, sub-research area, citation),
- scorecards for each member presenting productivity and collaborations,
- research area-based keyword clouds to better understand the collaborative topics.
Data source and dataset
We implemented the proposed application framework for UNICA to obtain the patterns of collaborations between 2015 and 2020 regarding research areas. Web of Science is our data source for retrieving data belonging to UNICA members. The collected bibliographic data was taken from Web of Science and converted into bibliometric data by operations performed on a set, as stated in Glänzel (2018). We collected the dataset between the 15th and 20th of March 2021.
Researchers can publish scientific papers with metadata in several formats for in-depth analysis, but full-text data may be unavailable or inaccessible in academic resources. For this purpose, scientific databases provide many features for papers with structural metadata classifiers. Liu et al. (2014) explained this phenomenon with the three primary sources: keyword content features, title context features, and abstract context features. We evaluated these recommendations and retrieved the related bibliographic data in plain text and spreadsheet formats. Figure 1 exhibits an example from Web of Science in plain text format.
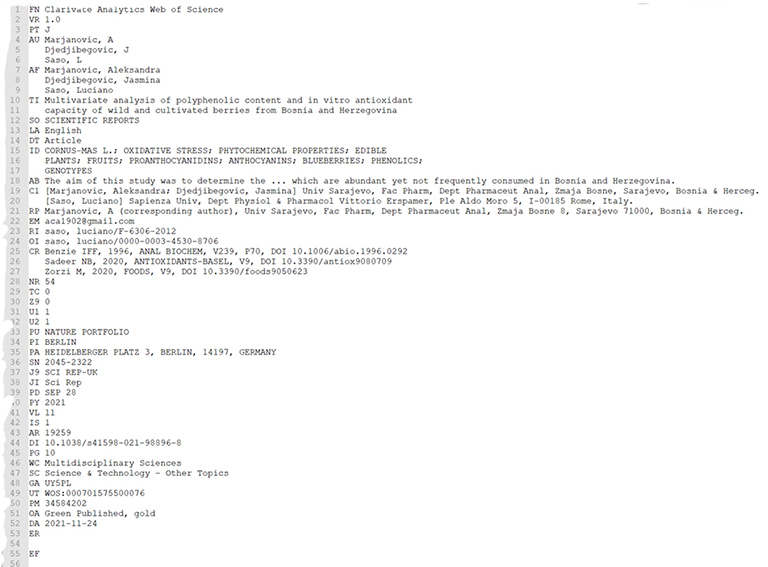
Figure 1: Sample record of an article in plain text form in Web of Science
When we examine the record with the Web of Science Accession Number “WOS:000597603400001” from the raw dataset, we can see that it is classified in sub-research fields such as chemistry, materials science, metallurgy, and metallurgical engineering, and physics. This research is a joint publication of UNICA members including Freie Universität Berlin (Berlin, Germany), Humboldt-Universität zu Berlin (Berlin, Germany) and the University of Lisbon (Lisbon, Portugal). The citation statement for this publication is “Schweitzer, L., Cunha, A., Pereira, T., Mika, K., Botelho do Rego, A. M., Ferraria, A. M., ... & Schoon, J. (2020). Preclinical in vitro assessment of submicron-scale laser surface texturing on Ti6Al4V. Materials, 13(23), 5342”
Therefore, particular data processing is required to infer a joint publication from the relevant academic network from the record in this detailed text data. In addition, although research areas are included in the record, in which of the five main areas it is classified is not specified; therefore, this information should be revealed in the table to be integrated into the data warehouse. When this integration is provided, this publication will cover the main areas of physical science and technology. The following section explains our approach in this study, which data processing steps we apply in the derived bibliographic data, and how we create bibliometric data that will provide input to the dashboards and reports we have developed.
Research design, data processing, and techniques
Generic workflow of the application framework
This study mapped relevant findings from the visualisations to the research questions to reveal various aspects of research collaborations. The proposed framework was designed within the scope of the steps in Figure 2. According to the setting summarized in Figure 2, the process starts by preparing the list of the institutions in the network and then collecting raw bibliometric data from the selected bibliometric databases for the UNICA members (coded as U1, U2, U3,…, U55); this system, which is put into use to provide decision support as a result of meetings and requirement analysis, has gone live with its data dashboards and so will provide a reference source for the progress of member universities, integration in the network, and support for academic collaboration. Through data visualisation and business intelligence reports, policy and decision-makers, e.g., the board of directors of UNICA, rectors, research institutes at universities, external stakeholders, and researchers, will be able to learn about the status of their institutions or other members regarding the main and sub-research areas they focus on.
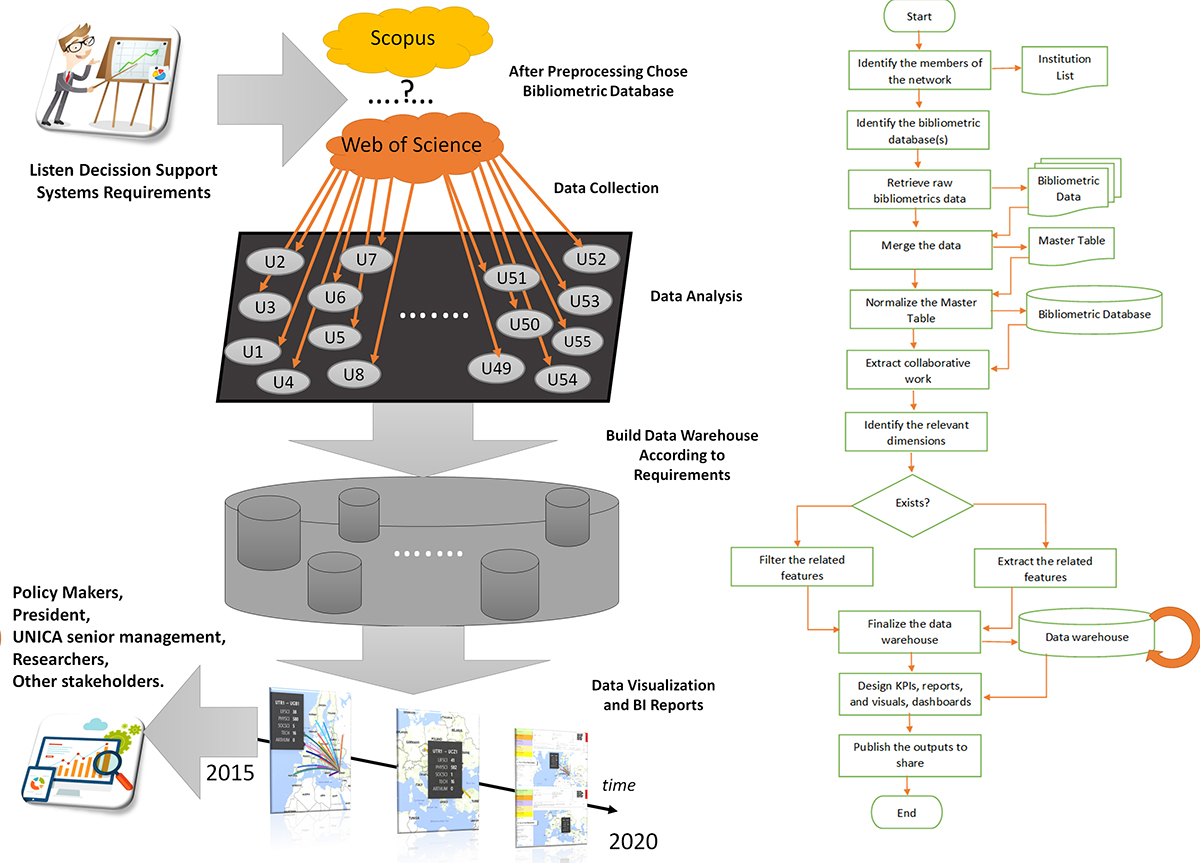
Figure 2: Workflow of the application development process
Database and data warehouse construction
After collecting raw bibliographic data, we organized this data into a relational table. In this context, we first designed our database in the Oracle platform by associating normalized tables, and then we extracted additional attributes for the information that we could not get directly from the data or added them to the database from other sources.
As an example of the operations performed at the data processing stage, we can explain the stages of extracting the information from the main research areas and adding the map location information (Figure 3). Figure 3a (1) exhibits a partial data table from the database, including the names of the institutions that are restructured regarding the expectations of UNICA executives, while Figure 3a (2) covers calculated attributes via hundreds of records. The last columns of the table are additional attributes, including the geographical locations of the members (Figure 3a (3)).
We extracted the main research areas (art and humanities, life sciences and biomedicine, physical sciences, social sciences, and technology) regarding the Web of Science subject category through queries and additional scripts developed via Structured Query Language (SQL) and Personal Home Page (PHP). Programming was presented in Figures 3b and 3c. Additional Python codes were used for double-checking the results.
These preliminary steps (in the workflow) produce detailed and large-scale data with 885058 records. The initial dataset is then reduced to the second dataset by keeping only the co-authors in the network and the selected features for the further steps. Hence, one more processing step is necessary for generating the pairwise matching of the articles between the institutions. The organization of these attributes in a relational table may be seen in Figure 3d.
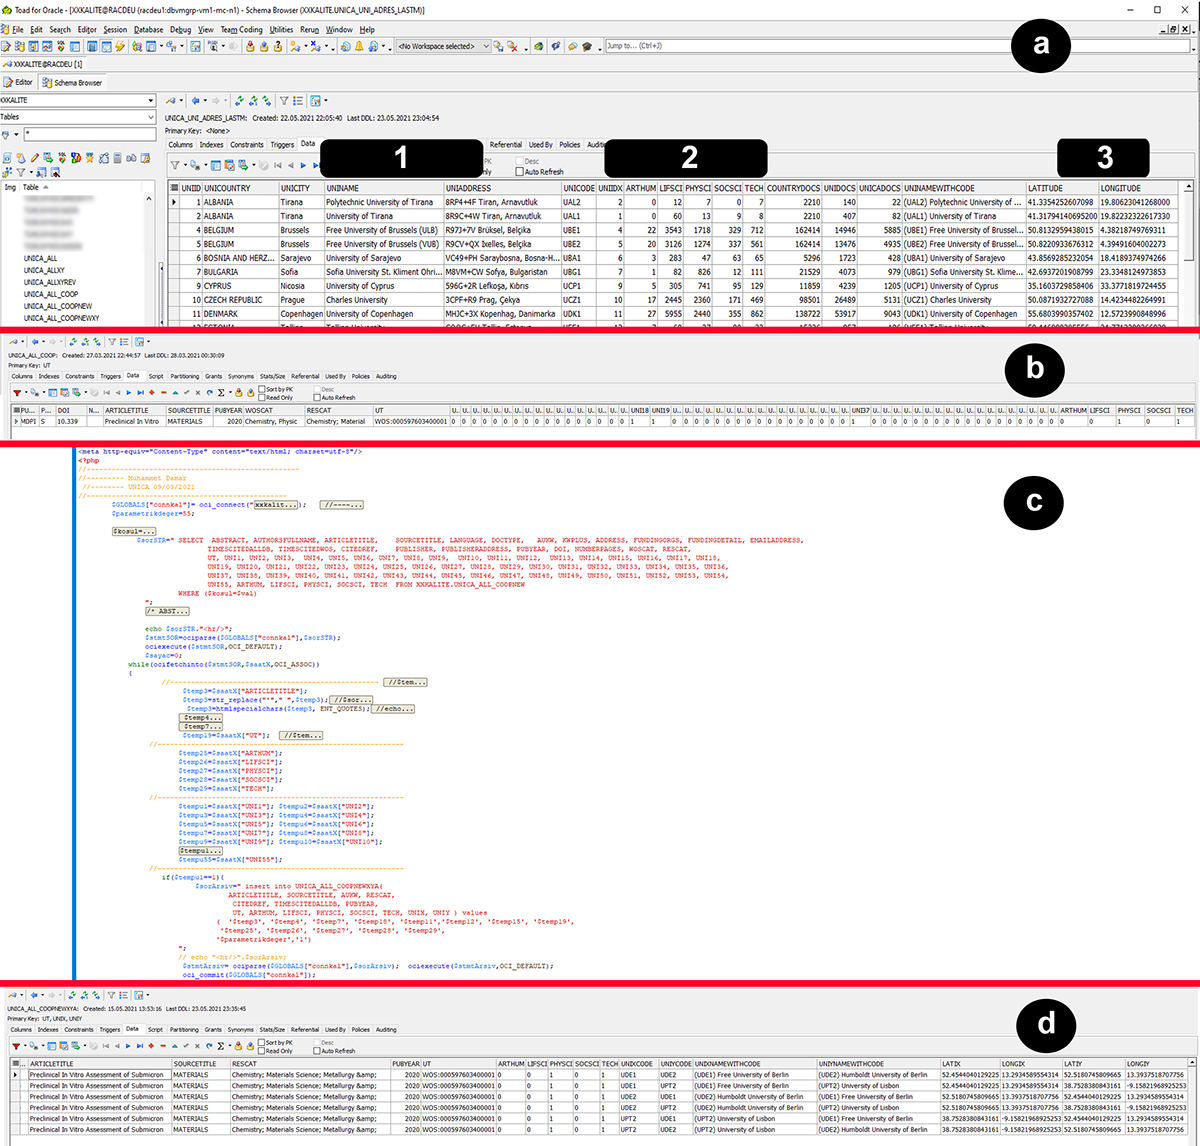
Figure 3: Examples of data processing and database components
The series of processing re-organizes the dataset and records to reflect the interactions between every member and other distinct members, as indicated in Figure 2. One of these processes is to constitute a data warehouse where we extracted the pairwise matchings and the related metadata of the papers. Figure 4 presents examples of the pair patterns and a flow map to visualise the associated data. We used purposive fields selected for the dashboards and created the flexibility to add the others from the database. The data processing steps merged hundreds of the batches and filtered the records including authors from UNICA members. This process resulted in 79849 records corresponding to a distinct number of articles.
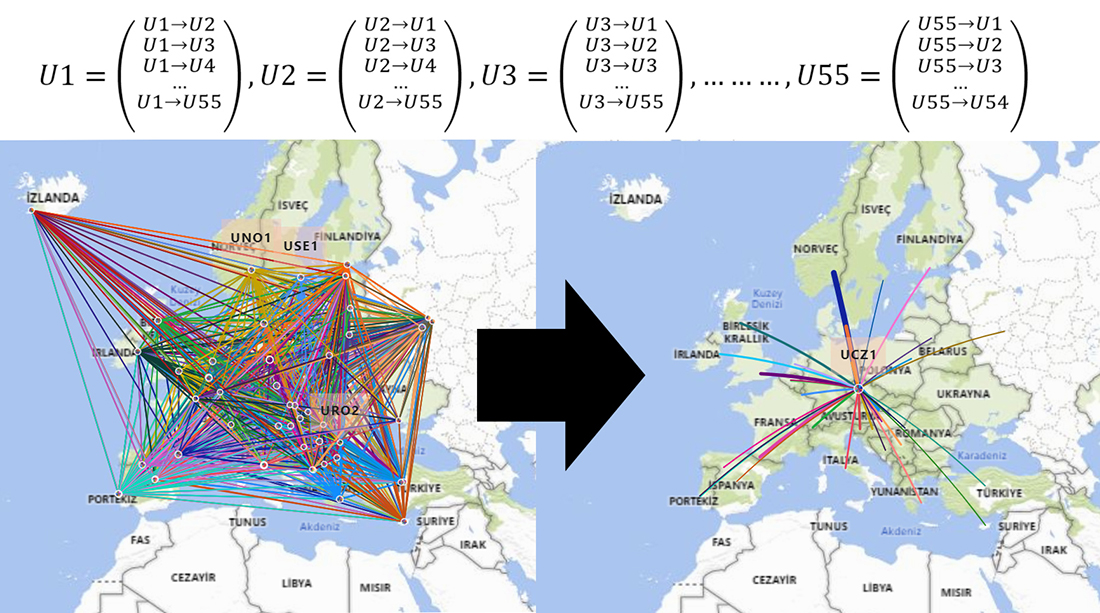
Figure 4: Mapping collaborations between the members of UNICA
Regarding the Web of Science subject category, an additional query classified all research sub-areas into the main research areas (art and humanities, life sciences and biomedicine, physical sciences, social sciences, and technology).
Enhancing business intelligence framework with other dashboards and related components
At the end of these data processing steps, a data warehouse is developed to generate reports, visuals, and thus dashboards that meet the needs of a decision support system. Ultimately, this data warehouse again became large, reflecting the relationships based on the research areas and articles repeated in the dataset. The data processing steps can be implemented in different environments, i.e., database-operating systems, coding platforms, or other software environments used for business intelligence. Interactive dashboards can be created in a business in similar domains using the data warehouses developed after the processing.
Finally, a standard bibliometric data has been transformed into different forms depending on the requirements, which were converted into the research questions. Many performance-oriented operations were performed on the data beforehand, and the data was made ready for further dashboard designs in the business intelligence application. Therefore, in the third phase, we designed the dashboards by adopting the methodology of bibliometrics to reveal collaborations regarding different institutions, institution groups, main research areas, and sub-areas. For reports and visuals in the dashboards along with network flow maps, we developed performance indicators and publication summary statistics to emphasise the levels of collaborations in UNICA. We could then enrich the reporting platform by adding filters in several dimensions such as institutions, countries, main research areas, and text-based filters for details about the areas. These applications produced a customized and interactive reporting environment to filter for different dimensions according to user preferences. Furthermore, the business intelligence platform provided navigation ability by publishing the dashboard on a web page. The dashboards included several filtering options as well as summary tables, indicators, and network flow maps. These dashboards also provided parametric and interactively navigable reports. We used Microsoft Power-BI (business intelligence) for the dashboards, and other report components, but the presented framework can easily be implemented in different software and database development platforms. The use of the platforms mentioned here or similar ones is entirely related to the experience and expertise of the researchers.
Implementation, results, and findings
In this section, we explain the components of the business intelligence application developed in line with the needs determined for UNICA and present the opportunities they provide, while at the same time, we give the summary statistics and findings on the research collaborations that have emerged with the application.
The need for monitoring system for UNICA
UNICA is an organization that brings together universities from Europe’s capital cities to form a network. It was formed in 1990 and currently consists of 55 institutions from 37 European capital cities. UNICA’s mission emphasizes the creation of a collaborative environment for its members to enable international partnerships and promote academic leadership (UNICA, 2021). Therefore, the level and diversity of these collaborations are the critical success factors for this formation. Joint research and co-authorship in publishing these studies are the most typical actions associated with the notion of academic collaboration. However, the publication portfolio, constantly changing with high acceleration, should be monitored in advanced networks such as UNICA with extensive data analysis and effective reporting mechanisms. Business intelligence architectures, the database, and analytical platforms that go along with them assist in providing monitoring mechanisms for managers. Dashboards appropriate for the needs of the relevant managers should be designed in this context.
Conducting requirement analysis on reporting platforms and developing dashboards and related report components in line with the needs is essential for any digital platform’s practical design and use. At this point, we designed and completed the report components of UNICA, considering the needs and feedback of the network representatives. In this context, easy accessibility, rapid screening, and intelligibility criteria also influenced the designs. For example, the representative selected the timeframe for the data for investigating long-term trends and patterns in the level of collaborations within the network. Hence, discovering the strengths and weaknesses in research collaborations in a year or less and a more extended period has become available to provide executives with more profound knowledge for developing efficient policies.
The bibliographic data given by scientific databases are the most relevant for creating inputs to these dashboards. In this context, this study proposes a framework to handle this process. Within the framework, we integrated many visuals, filters, and reports into dashboards to monitor collaborations regarding joint works within UNICA. The following sections explain the dashboards along with the findings that we obtained from the dashboards regarding collaborations.
The network flow map for thirty-seven countries and fifty-five distinct institutions
The network flow map dashboard presented in Figure 5a visualizes article counts on a network flow map. Many filters surround the map including institution selection, main and sub-areas of the papers concerning the Web of Science research categories (Clarivative Analytics, 2021), and table reports, including article names, years, and journal lists. Based on the selection for each filter, it is possible to see the institutions on a map along with the tooltips about the collaborations between them. Any user can follow the details with the help of the information that the table reports provide. The flow map in Figure 5a and its filters visualize the articles published by a university in the network with other members and statistics according to the main research areas, research sub-areas, journals, and years. Users can also apply the filters based on research sub-areas, and thus they can compare the portfolios created in different research areas. We selected Ankara University to illustrate how this dashboard works. As seen in Figure 5a, the total number of articles produced by Ankara University with UNICA members is 1148. The distribution of the articles by year is 177 in 2015, 186 in 2016, 167 in 2017, 194 in 2018, 205 in 2019, and 219 in 2020. The top five journals that publish these articles most frequently are The European Physical Journal C (165), The Journal of High Energy Physics (161), Physics Letters B (96), Physical Review D (95), and Physical Review Letters (43), respectively.
In the case of Ankara University, the most collaborative research areas are, in order, physics, astronomy and astrophysics, instruments and instrumentation, general and internal medicine, psychology, allergy, hematology, immunology, oncology, gastroenterology, and hepatology. The following situation occurs when the journals where the articles are most frequently published are examined. Suppose an institution, e.g., Charles University, is selected from the destination list (Figure 5b). In that case, all article counts in tables and charts are filtered by this selection and show the collaborative research portfolio between the two institutions.
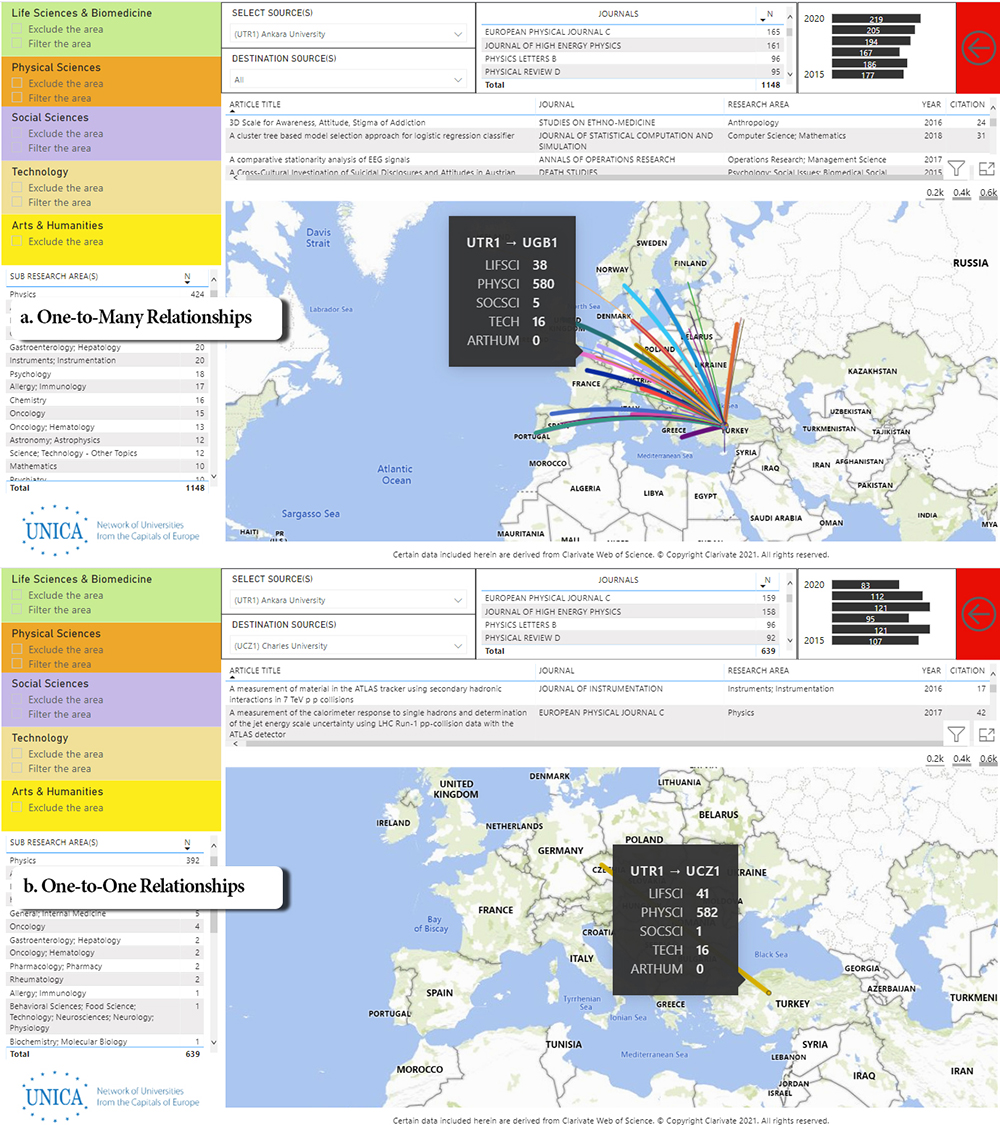
Figure 5: Network flow map (a. One-to-many relationships b. One-to-one relationships)
The findings highlighted a connection between a country’s degree of development and its university’s research production. Developing countries, in particular, prefer to work with institutions that rank high in the Times Higher Education or QS (Quacquarelli Symonds) World University Rankings systems. This fact backs up Wagner and Leydesdorff’s (2005) thesis that growing specialisation in research disciplines will stimulate international collaboration. Indeed, this circumstance will significantly impact the dissemination of scientific advancement in developed countries via a network, such as UNICA, which has reached practically every country in Europe, including the United Kingdom, Russia, Ukraine, and Turkey.
Article counts based on main research areas indicate joint works concentrated on physical sciences, life sciences and biomedicine, and technology. In contrast, there was no collaborative work in arts and humanities and social sciences. The distribution of the articles over the research sub-areas is physics (580), astronomy and astrophysics (188), instruments and instrumentation (15), hematology (9), and oncology (7). These values are the sum of the number of articles in the related research sub-areas. Each visual is navigable and filterable concerning any feature, and the selection interactively reflects the other visuals. In this way, for example, it is possible to focus on a single article and year or a research area. Another striking point in Figure 5a is that the thickness of the link between the two nodes in the sources and destinations shows the density of collaborations in terms of the number of collaboratively produced articles. Furthermore, if one clicks on the arrow between two institutions or places the mouse pointer on the link, tooltips will appear and give the number of articles categorized into the main research areas.
Another flow map was also developed to navigate the same map via research sub-areas, but because of its similarity, it was not presented in this paper.
Individual scorecards of UNICA members
Even if the study’s main purpose is to reveal the patterns of collaborative articles within UNICA (Figure 5), another dashboard page accompanies the flow map by presenting the general statistics of the articles. Along with these statistics, there is an introduction page to inform users about the project. Buttons in blue on the left provide direct links to the other dashboards. The dashboard-entitled scorecards evaluate countries and institutions based on their position in the network (Figure 6).
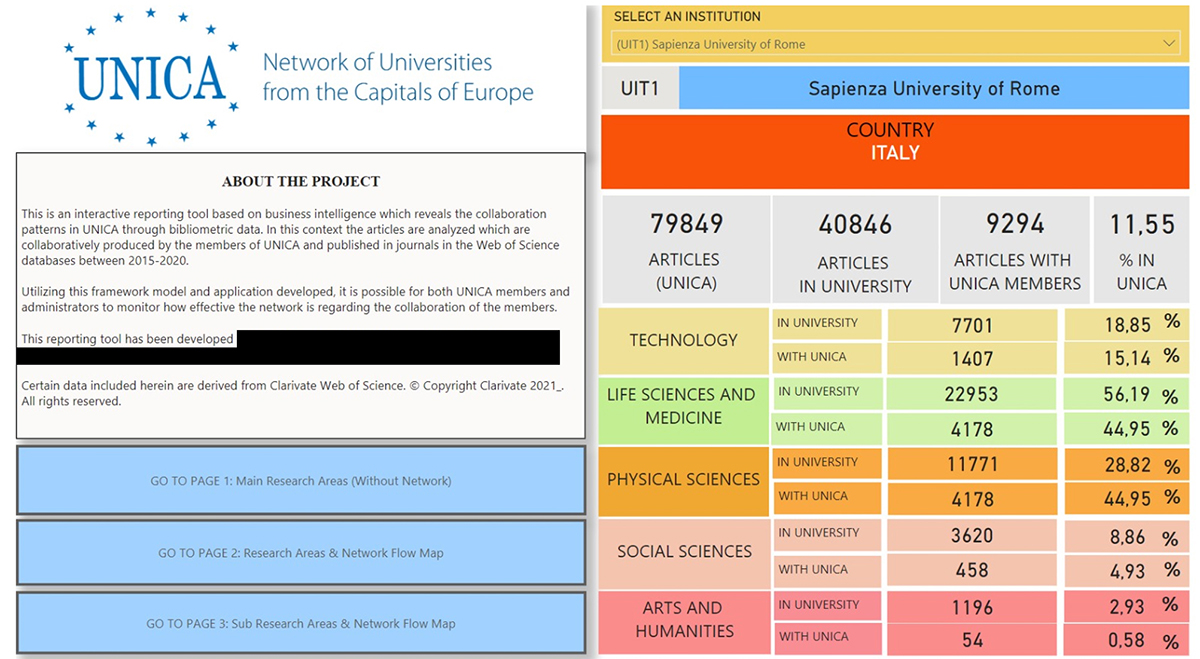
Figure 6: Introduction page of the reporting tool scorecard for network members
At the top, there is a filter where the user can select the institution, i.e., university. When selected, the university and the corresponding country appear along with several metrics listed as in the following:
• the number of articles in Web of Science produced by the institution,
• the number of Web of Science articles in which the selected university collaborates with the UNICA members, along with its percentage,
• the rate of articles published in collaboration with UNICA members in the university’s portfolio.
Additional portions are also given for each research sub-area to indicate its share in the total number of articles that the member produced with at least one other UNICA member.
The only filter used in Figure 6 is the institution list. When an institution is selected from this list, institutional information and indicator values appear on this part of the screen. This part exhibits the country where the institution is located, the total number of articles from the institution in Web of Science, the total number of articles in collaboration with UNICA members, and the percentage of articles of the institution in the article portfolio of UNICA in Web of Science.
This screen also provides additional information about the number of articles in different main research areas. It should be noted that an article can be assigned to more than one research area. Figure 6 exhibits Sapienza University, a member from Italy. 40846 of the articles were produced by faculty members of the university, and 9294 articles were collaboratively produced with at least one other UNICA member. This collaboration level corresponds to 11.55% of the UNICA collaborative work portfolio. This rate can also be interpreted as the contribution of this institution to the UNICA portfolio. Figure 6 also gives the distribution of 9294 articles over the main research areas and 40846 articles. It may be noted that an article can be assigned to more than one main research area; hence, the total of these article counts would not give the total number of articles, i.e., 9294.
From the dashboard or the visuals in Figure 6, a user can reveal that the number of papers involving UNICA members is relatively low at universities such as University of Tirana (UAL1), University Sorbonne Nouvelle (UFR3), the Polytechnic University of Tirana (UAL2), and Igor Sikorsky Kyiv Polytechnic Institute (UUA1). It is also worth noting that the ratio of collaborative publications to these institutions' total publication portfolio is higher than predicted. As a result, decision-makers should use the ratio as a critical indicator in their evaluations.
Details of collaborations based on research areas
The details of collaborations based on the research area are developed as another dashboard that enables us to navigate the collaborations regarding more bibliometric dimensions (Figure 7). It provides filters for excluding or including main research areas. The numbers below the main research area filters indicate the total number of articles produced by at least one other UNICA member and assigned to the corresponding area.
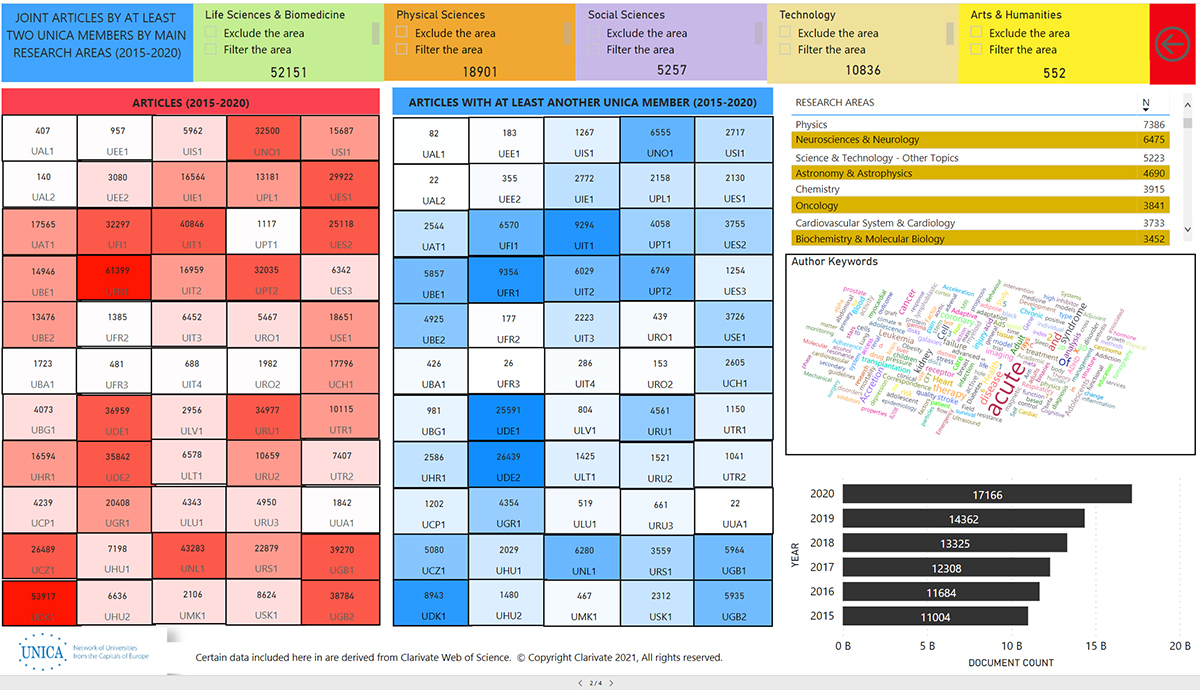
Figure 7: Detailed distribution of collaborative papers
The set of cards in shades of red represents the total number of articles produced by the university. The collection of cards in shades of blue represents the total number of articles produced with at least one other UNICA member. These sets of cards respond dynamically to the main research area filters. Filters enable obtaining additional indicators such as the related research sub-areas, the word cloud of the keywords in the selected area, and finally, a bar chart that exhibits the number of articles by year. A user can filter the main research areas and then see which members participated in the related papers and the total portfolio of the institution in the selected area. Using this proposed application framework, researchers can discover which universities stand out in certain areas at the macro-level and which academicians work at these institutions at the micro-level. Hence, the findings can play an essential role in university networks’ policy and strategy development processes to encourage collaborations and provide incentives.
As shown in Figure 7, we can filter the articles according to this parameter when we select any of the research sub-area from the main research areas. Thus, we can customise the visual based on the parameter selection and navigate the areas using this dashboard. Several filters enable the creation of multidimensional reports on this screen (Figure 7). In both cases, no restriction would be applied.
With regard to the results that the dashboard components in Figure 7 provide, some of the member universities’ statistics on collaboration in all areas are relatively low. The Polytechnic University of Tirana (UAL2), Igor Sikorsky Kyiv Polytechnic Institute (UUA1), and University Sorbonne Nouvelle (UFR3) are examples of this situation. Although Igor Sikorsky Kyiv Polytechnic Institute (UUA1) rates lower in general statistics, its collaborations in life sciences and biomedicine rank higher. In technology, several institutions have the same status. Sofia University St. Kliment Ohridski (UBG1) occupies a similar role in social sciences. Furthermore, because physical science has accounted for over 80% of UBG1’s collaborative publications, collaboration in other fields should be promoted.
The UNICA management identified the weaknesses in arts and humanities, and expected to show them by using statistics. The Free University of Berlin (UDE1), Humboldt University of Berlin (UDE2), NOVA University Lisbon (UPT1), the University of Lisbon (UPT2), Sapienza University of Rome (UIT1), Research University’s Higher School of Economics (URU2), and the University of Helsinki (UFI1) are the most collaborative institutions in this field, with over 50 papers. Even though the number of publications is minimal compared to other fields, the existence of such a potential is encouraging in terms of formulating policies to improve prospects for future research partnerships. Members with ten or fewer joint publications in arts and humanities but higher ranks in other subjects, such as the University of Sarajevo (UBA1), Sofia University St. Kliment Ohridski (UBG1), the University of Cyprus (UCP1), University Paris Dauphine - PSL (UFR2), Tallinn University of Technology (UEE2), the University of Iceland (UIS1), Foro Italico University of Rome (UIT4), the University of Latvia (ULV1), the University of Vilnius (ULT1), the University of Luxembourg (ULU1), Ss. Cyril and Methodius University of Skopje (UMK1), Comenius University in Bratislava (USK1), and the People’s Friendship University of Russia (URU3) have demonstrated this potential.
The number of publications distributed among the main research areas is similar. The life sciences and biomedicine publication portfolio leads the way, followed by physical sciences and technology. Research collaborations in social sciences and arts and humanities lag behind other fields. Only 552 of the total publications produced in arts and humanities need to be analysed from different perspectives. Policymakers should assess the possibilities for collaboration in this area and develop action plans to promote collaborative research. The dynamics of the field and the intensity of individual efforts, on the other hand, are facts to consider in this process.
Figure 7 shows a dashboard that focuses just on the number of publications depending on the main research areas. It contains basic information that allows users to visualise the overall situation by obliterating the details. However, for users who wish to examine a breakdown of the number of publications by other dimensions and get more extensive information about the filtered publications, we built a different composition, as illustrated in Figure 8. Figure 7 and Figure 8 exemplify the design of customized dashboards regarding the diverse needs of members, executives, or other stakeholders.
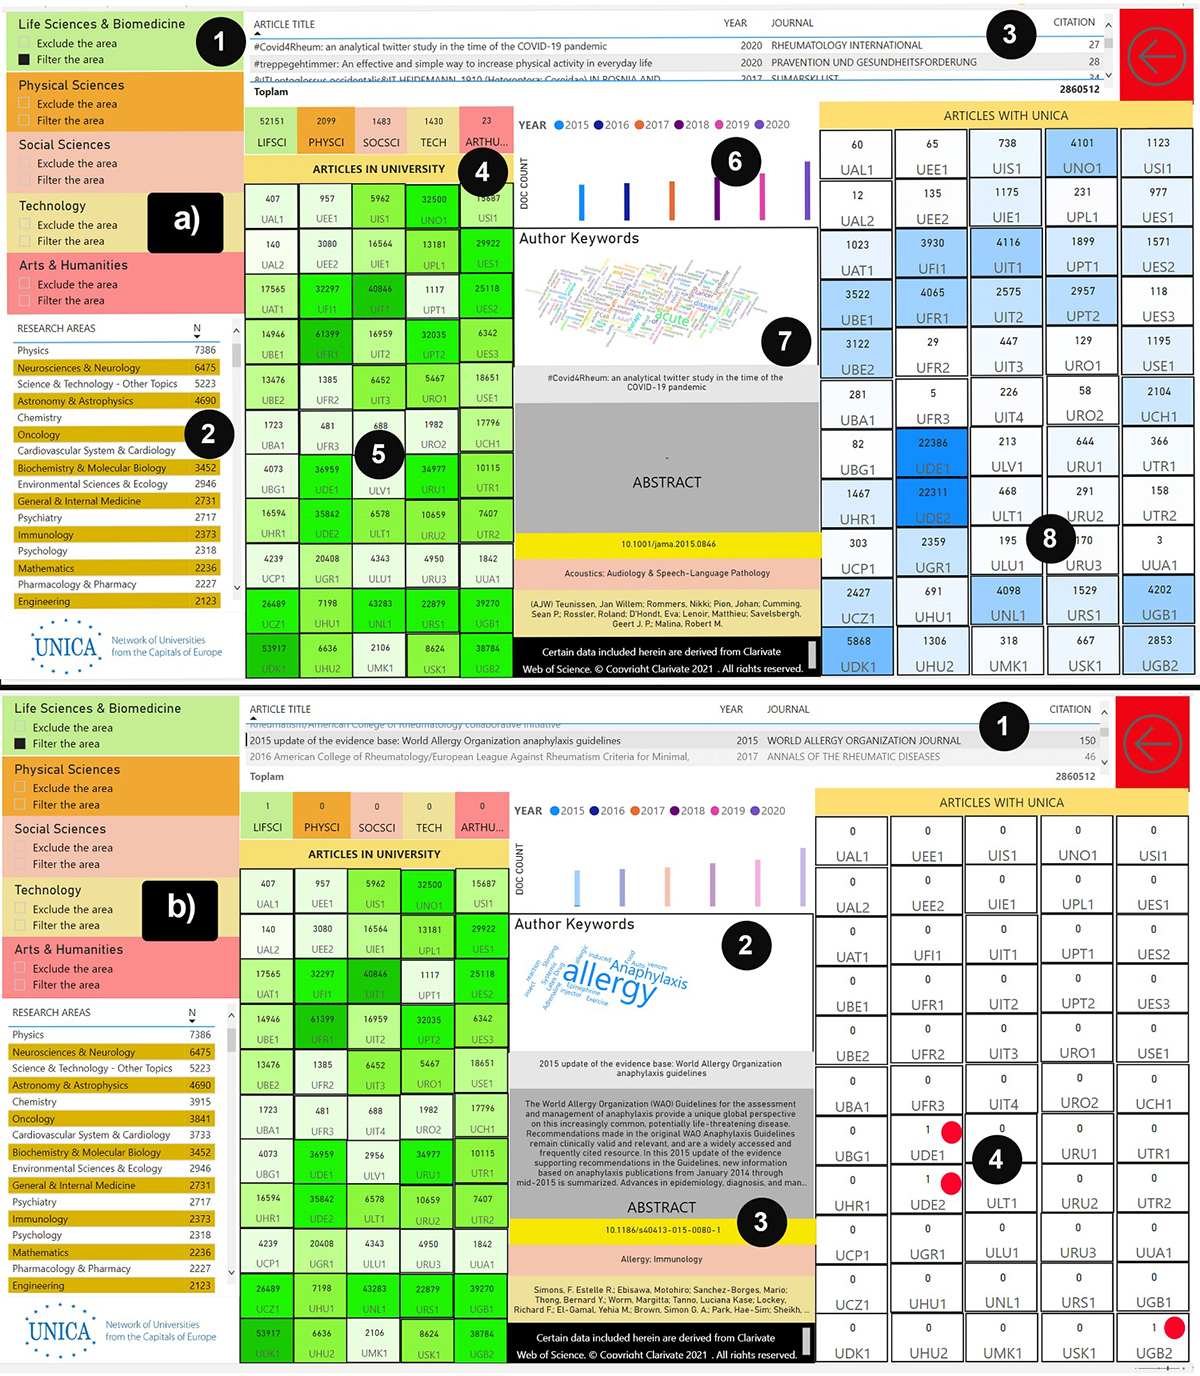
Figure 8: Collaborative papers details by main and sub-research areas
Although these boards appear to be static images in figures, they are actually live screens that the user can control using filters that can be applied to each dashboard component. We can simulate the screen in Figure 8 with a demonstration. In the area of life science, 52151 documents have been produced. Figure 8a (3) depicts the list of publications while Figure 8a (2) depicts the sub-research fields and paper counts as a summary table. The Free University of Berlin (UDE1) with 22386 publications, and Humboldt University of Berlin (UDE 2) with 22311 papers stand out among UNICA members (Figure 8a (8)) when we filter with the life science and biomedicine main research area on Figure 8a (1). The universities that highly collaborated in the UNICA after UDE1 and UDE2 are the University of Copenhagen (UDK1) with 5868 papers and King's College London (UGB1) with 4202. Figure 8a (5) also shows the number of papers published by universities within the relevant period. Physical science (2099), social science (1483), technology (1430), and art and humanities (23) are the other main research areas associated with life science (Figure 8a (4)).
The graphic image given in Figure 8a (6) comparatively presents the distribution of papers produced in life science by years. Accordingly, there are 7197 studies in 2015, 7472 studies in 2016, 7794 studies in 2017, 8638 studies in 2018, 9342 studies in 2019, and 11708 studies in 2020. Moreover, when the user selects any year, the research title, main research area, the word cloud, and other components on the screen are also filtered according to the selection (Figure 8b (2)). In Figure 8b, one can see the title, abstract, doi, researcher, and sub-research area(s) information for the paper entitled “2015 update of the evidence base: World Allergy Organization anaphylaxis guidelines,” as well as the UNICA members with whom the relevant study was conducted (Figure 8b (4)). With such simplicity of use, it is expected that UNICA members would be able to access the potential researcher portfolio more efficiently. This demonstration gives only a few results, and each dashboard developed in the application framework can be used for various purposes and views.
Strengths and limitations
A cross-sectional data collection encompassing the period 2015-2020 was studied as part of this study. The time frame was described during the requirement analysis phase. Furthermore, this dataset serves as an example of the proposed application framework. The data warehouse can be updated in a modular structure, and the new status can be reflected in the reports by automatically processing with the proposed techniques and applications.
Web of Science and Scopus databases were evaluated by considering their scope and journals’ impact. One of the most crucial elements in this evaluation is the ability to discern studies in art and humanities. Administrators from UNICA were particularly interested in obtaining statistics on research collaborations in the area. According to preliminary analyses, the Web of Science domain classification was more in line with UNICA administrators' expectations, and the related journals are included in social science in Scopus; hence Web of Science was chosen as the data source. This is a limitation of the study because it excludes joint research published in other journals.
The research collaborations reflected in the articles form the basis for the study. Collaborations are not limited to publications but also include joint education programs, student and teacher exchanges, and other initiatives. Given that it is not addressed in this study, it can be considered part of a much larger project that needs to be handled to make these research collaborations holistically traceable. The primary reason for developing all bibliometric reports through a data warehouse in a business intelligence environment rather than evaluating them in traditional bibliometric software tools appears at this phase. The data model may be easily modified, and other dimensions of collaborations may be integrated because these environments are fed with appropriate data.
With the rapid development of business intelligence and other technologies, commercial software that offers such reporting tools is also available. In comparison, the practice outlined in this research can also be open to improvement. However, it also has strengths such as flexibility, customisability, a direct response to stakeholder needs, and the ease of extensibility. It is important to note that this is a voluntarily designed application framework with the sole purpose of conducting scientific research.
Although Russia existed from 2020 to 2021, its disappearance in 2022 sets a precedent for other institutions in the future. In the reporting tool, this circumstance can be limited to show-to- display. It would, however, give reference information to both such network executives and relevant university management in order for this system to function properly and to monitor these kinds of circumstances.
Discussion and conclusion
This study proposed a framework to monitor and evaluate research collaborations in university networks that reveal both the big picture and details with user-friendly dashboards and a business intelligence driven approach. Dashboards can respond to instant reporting needs by automatically analysing and visualizing the data obtained from a data warehouse created from bibliometric data. Various software tools include advanced analysis and visualisation components in analysing bibliometric data. Those tools produce standard and ad-hoc reports and are executable at a certain level of expertise. Business intelligence environments enable creating an information system for everybody and offer a customizable analytical environment that appeals to users of all levels. From this point of view, the approach presented in this study is open to improvement according to user needs and managerial levels. It is easy to enrich the environment by integrating different data, analyses, and visuals.
All dashboards serve the particular needs of the decision-makers and stakeholders of UNICA. In a nutshell, this developed application framework and the related digital reporting platform highlight essential benefits for both network managers and stakeholders working in member institutions. We provided breakdowns to research sub-area and publication levels based on inter-institutional bilateral and multi-lateral collaboration; thus, we created a decision support mechanism for all network stakeholders. This mechanism provides concrete information for determining research policies and strategies and monitoring the network's effectiveness in research collaboration. For example, with the application developed specifically for UNICA, we observed that joint research in the network, especially in physics, medicine, and related fields, is more intense, and collaborations in art, the humanities, and the social sciences are relatively low. However, the visuals reflected the existence of institutions with a vast research portfolio in these areas. Reports also highlighted partnership potentials that will strengthen the information dissemination within the network in this direction. Network stakeholders and managers can enhance research collaborations by producing additional strategies for regions and subjects, detailing the breakdowns from the main research area level to the distributions in the dimensions of research sub-areas and institutions.
The data dashboards covered performance cards, charts, reports, and collaboration networks on maps and also behaved as interactive monitoring reporting tools that have multidimensional filtering mechanisms. With the proposed approach, the dashboard’s scope can be easily expanded in line with the accessible data and tools. Therefore, it is essential to emphasize that the dashboard had the infrastructure, flexibility, and diversity to answer various questions.
This paper presented the implementation of the framework for the case of UNICA with members from the universities in Europe. The knowledge gained empowers 55 UNICA member institutions, policymakers, researchers, stakeholders, and UNICA management to see institutional practices and initiative achievements through scientific outputs by utilising their technological potential. One of the exciting findings of the application was that UNICA members collaborate in particular research areas, and the level of collaboration has been improving in a similar context. In other words, there are no homogenous collaboration patterns between the members regarding the main research areas. For example, some institutions have collaborated more on physical sciences than social sciences or more on technology; thus, some actions are necessary to improve the collaboration levels in those areas or research sub-areas. Notably, arts and humanities and social sciences had the lowest collaboration level, so the executives of the network and universities can focus on those areas and affiliated schools to discover the main reasons behind these findings. Decision-makers can also use the tool to develop data-driven strategies and incentives to improve collaborations to create a balanced research impact on each area. Melin (2000) provided remarkable findings on the reasons for and benefits of research collaborations and, as a result of this research, developed suggestions for creating effective research policies. Decision-makers can evaluate our study's recommendations and findings to obtain a compromise approach for policy development and deployment.
Katz and Martin (1997) stated that international collaboration should associate the names and addresses of the authors from different countries on scientific publications, and how they collaborate should be further analysed, particularly behaviourally. They also noted that bibliometrics could only provide partial information about the collaborations. Accordingly, business intelligence environments are flexible enough to combine data from different sources. The additional features can also be added to this environment to monitor other performance indicators, including various aspects of research collaborations.
Consequently, this study differs from its counterparts in the literature on two points. First, bibliometric data belonging to a vast network, i.e., UNICA, are analysed in terms of co-authorship, year, research area, and geographical location information. No dataset containing this information is readily available and therefore involves a much more intense and progressive data warehouse development process. Second, this study uses business intelligence and related tools while producing the analysis and visuals obtained as a result. All tables and visuals obtained in this way can be navigated interactively and shared dynamically in web environments. Therefore, the results provide information regarding the discovery of collaborations while suggesting a process-monitoring platform for UNICA members and managers. The findings are also enriched by the generation of additional reports through the business intelligence platform. From this perspective, the study proposed a novel approach that blended the concepts and techniques of bibliometrics, research productivity, and business intelligence in a single framework; therefore, the approach can be a reference for future research in decision-making processes in higher education.
Future work
Working effectively with a data warehouse entails modelling the data, extracting data from numerous data sources in response to new research questions or requirements, and presenting it to stakeholders via visualisations developed through various processing. It is possible to integrate the other components of collaborations in this way. In addition, there exist other kinds of collaboration, including research education schools, teacher and student exchange, and other knowledge-intensive collaboration that does not end up in shared publications.
In future studies, UNICA and other university associations may be advised to build new data warehouses that will be fed from open-source data services or data sources that can be integrated into scientific publication collaborations and transform them into holistic information in business intelligence environments in accordance with stakeholder needs.
Academic institutions and networks can employ a variety of open-source data and application platforms to acquire publishing and citation information, successfully transfer it to publications, and track crucial statistics. For example, Crossref simplifies locating, evaluating, and reusing bibliographic data (CrossRef, 2022). Open Citations uses semantic web technologies to deliver available bibliographic data from web sources. Semantic Scholar has been enhanced with artificial-intelligence-driven capabilities to help scholars deduce current patterns in scientific publications. Open Alex provides an open catalog including papers, researchers, journals, and institutions, and OpenAIRE can be thought of as a service hub that provides researchers and affiliated organizations with tools and services to track and manage their scientific activities. As a result, the application framework can incorporate these data sources and services.
Acknowledgments
We would like to express our deep appreciation to UNICA for this joint research. This research was carried out purely for scientific purposes with the synergy created by the UNICA President and the voluntary efforts of the researchers.
Additionally, certain data included herein are derived from the Clarivate Web of Science, © copyright Clarivate 2021, all rights reserved.
About the authors
Muhammet Damar is a computer engineer and instructor at the Information Center of Dokuz Eylul University (DEU) in Izmir, Turkey. He gained MSc in Management Information Systems at DEU and MBA at Sakarya University. He has just completed his Ph.D. in Business Administration at DEU Graduate School of Social Sciences. His research interests are health informatics, information systems, system analysis design, data mining, scientometrics, and business intelligence. He can be contacted at: muhammet.damar@deu.edu.tr.
Güzin Özdağoğlu is an associate professor of quantitative methods and currently a faculty member at Dokuz Eylul University (DEU) Dept. of Business Administration. She holds bachelor’s, master’s, and Ph.D. degrees in Industrial Engineering. Her fields of interest cover data mining, decision support systems, business intelligence, bibliometrics, and system dynamics. She can be contacted at guzin.kavrukkoca@deu.edu.tr.
Luciano Saso is a Professor in the Faculty of Pharmacy and Medicine, Sapienza University of Rome, Italy. He is currently Vice-Rector for the European University Networks UNICA and CIVIS at Sapienza University of Rome. He can be contacted at luciano.saso[at]uniroma1.it.
References
Note: A link from the title, or from "Internet Archive", is to an open access document. A link from the DOI is to the publisher's page for the document.
- Abramo, G., D’Angelo, C. A., Di Costa, F., & Solazzi, M. (2009). University-industry collaboration in Italy: a bibliometric examination. Technovation, 29(6-7), 498-507. https://doi.org/10.1016/j.technovation.2008.11.003
- Akakandelwa, A. (2009). Author collaboration and productivity at the University of Zambia, 2002-2007. African Journal of Library, Archives & Information Science, 19(1), 13-23. https://doi.org/10.1007/s11192-011-0552-1
- Ardanuy, J. (2012). Scientific collaboration in library and information science viewed through the Web of Knowledge: The Spanish case. Scientometrics, 90(3), 877-890. https://doi.org/10.1007/s11192-011-0552-1.
- Benckendorff, P. (2010). Exploring the limits of tourism research collaboration: A social network analysis of co-authorship patterns in Australian and New Zealand tourism research. In CAUTHE 2010. Official proceedings of the 20th annudal CAUTHE conference “Tourism and hospitality: Challenge the limits”, 8-11 February 2010, Hobart, Tasmania, Australia, (pp.151-174). CAUTHE.
- Björneborn, L., & Ingwersen, P. (2004). Toward a basic framework for webometrics. Journal of the American Society for Information Science and Technology, 55(14), 1216-1227. https://doi.org/10.1002/asi.20077
- Chen, K., Zhang, Y., & Fu, X. (2019). International research collaboration: an emerging domain of innovation studies? Research Policy, 48(1), 149-168. https://doi.org/10.1016/j.respol.2018.08.005
- Cheng, M. Y., Hen, K. W., Tan, H. P., & Fok, K. F. (2013). Patterns of co-authorship and research collaboration in Malaysia. In Aslib Proceedings: New Information Perspectives, 65(6) 659-674. https://doi.org/10.1108/ap-12-2012-0094
- Chung, W., & Zeng, D. (2016). Social‐media‐based public policy informatics: Sentiment and network analyses of US Immigration and border security. Journal of the Association for Information Science and Technology, 67(7), 1588-1606. https://doi.org/10.1002/asi.23449
- Chung, W., Chen, H., & Reid, E. (2009). Business stakeholder analyzer: An experiment of classifying stakeholders on the Web. Journal of the American Society for Information Science and Technology, 60(1), 59-74. https://doi.org/10.1002/asi.20948
- CrossRef, (2022). About us. https://www.crossref.org/about/ (Internet Archive).
- Cunningham, S. J., & Dillon, S. M. (1997). Authorship patterns in information systems. Scientometrics, 39(1), 19-27. https://doi.org/10.1007/BF02457428
- Daniel, B. (2015). Big data and analytics in higher education: Opportunities and challenges. British Journal of Educational Technology, 46(5), 904-920. https://doi.org/10.1111/bjet.12230
- Dunning, J. (2000). Regions, globalisation & the knowledge-based economy. Oxford University Press.
- Elango, B., & Rajendran, P. (2012). Authorship trends and collaboration pattern in the marine sciences literature: a scientometric study. International Journal of Information Dissemination and Technology, 2(3), 166-169.
- Elena, C. (2011). Business intelligence. Journal of Knowledge Management, Economics, and Information Technology, 1(2), 1-12.
- Elsevier. (2022). Why you need a research information management system (RIMS). https://www.elsevier.com/research-intelligence/rims-and-cris-systems. (Internet Archive).
- EuroCRIS, (2022). Membership information. https://eurocris.org/membership-information. (Internet Archive).
- Foley, É., & Guillemette, M. G. (2010). What is business intelligence? International Journal of Business Intelligence Research, 1(4), 1-28. https://doi.org/10.4018/jbir.2010100101
- Garfield, E. (2009). From the science of science to Scientometrics visualizing the history of science with HistCite software. Journal of Informetrics, 3(3), 173-179. https://doi.org/10.1016/j.joi.2009.03.009
- Glänzel W., & Schubert A. (2004). Analysing scientific networks through co-authorship. In H.F. Moed, W. Glänzel, & U. Schmoch, (Eds.). Handbook of quantitative science and technology research (pp. 257-277). Springer. https://doi.org/10.1007/1-4020-2755-9_12
- Glanzel, W. (2018). Introduction to bibliometric data sources. In Proceedings 2nd International Summer School. Modern trends in science: scientometrics, September 26-29, Yerevan, Armenia. (21 pp.). http://csiamconf2018.sci.am/lec/Data%20sources.pdf. (Internet Archive).
- Hicks, D., & Katz, J.S. (1996). Science policy for a highly collaborative science system. Science and Public Policy, 23(1), 39-44. https://doi.org/10.1093/spp/23.1.39
- Hood, W.W., & Wilson, C.S. (2001). The literature of bibliometrics, scientometrics, and informetrics. Scientometrics, 52(2), 291-314. https://doi.org/10.1023/a:1017919924342
- Hou, H., Kretschmer, H., & Liu, Z. (2008). The structure of scientific collaboration networks in Scientometrics. Scientometrics, 75(2), 189-202. https://doi.org/10.1007/s11192-007-1771-3
- Inzelt, A., Schubert, A., & Schubert, M. (2009). Incremental citation impact due to international co-authorship in Hungarian higher education institutions. Scientometrics, 78(1), 37-43. https://doi.org/10.1007/s11192-007-1957-8
- Jacobs, D. (2010). Demystification of bibliometrics, scientometrics, informetrics and webometrics. In D.N. Ochola and N. Evans, (Eds.). Proceedings of DLIS 11th Annual Conference “Demistifying and popularising LIS research in modern times”, 2-3 September, Richardsbay, University of Zululand, South Africa (pp. 30-43). University of Zululand.
- Katz, J.S., & Martin, B.R. (1997). What is research collaboration? Research policy, 26(1), 1-18. https://doi.org/10.1016/S0048-7333(96)00917-1
- Khaparde, V., & Pawar, S. (2013). Authorship pattern and degree of collaboration in Information Technology. Journal of Computer Science & Information Technology, 1(1), 46-54. https://doi.org/10.1.1.1038.8171
- Khasseh, A.A., Soheili, F., & Chelak, A.M. (2017). Co-authorship network analysis of iMetrics researchers. Library Philosophy and Practice . https://digitalcommons.unl.edu/cgi/viewcontent.cgi?article=4256&context=libphilprac.
- Koseoglu, M. A., Okumus, F., Putra, E. D., Yildiz, M., & Dogan, I. C. (2018). Authorship trends, collaboration patterns, and co-authorship networks in lodging studies (1990-2016). Journal of Hospitality Marketing & Management, 27(5), 561-582. https://doi.org/10.1080/19368623.2018.1399192
- Kumar, S. (2015). Co-authorship networks: a review of the literature. Aslib Journal of Information Management, 67(1), 55-73. https://doi.org/10.1108/AJIM-09-2014-0116
- Lariviere, V., Gingras, Y., & Archambault, É. (2006). Canadian collaboration networks: a comparative analysis of the natural sciences, social sciences, and the humanities. Scientometrics, 68(3), 519-533. https://doi.org/10.1007/s11192-006-0127-8
- Leydesdorff, L., & Persson, O. (2010). Mapping the geography of science: Distribution patterns and networks of relations among cities and institutes. Journal of the American Society for Information Science and Technology, 61(8), 1622-1634. https://doi.org/10.1002/asi.21347
- Leydesdorff, L., & Wagner, C.S. (2008). International collaboration in science and the formation of a core group. Journal of Informetrics, 2(4), 317-325. https://doi.org/10.1016/j.joi.2008.07.003
- Liu, X., Guo, C., & Zhang, L. (2014). Scholar metadata and knowledge generation with human and artificial intelligence. Journal of the Association for Information Science and Technology, 65(6), 1187-1201. https://doi.org/10.1002/asi.23013
- Lundberg, J., Tomson, G., Lundkvist, I., Skr, J., & Brommels, M. (2006). Collaboration uncovered: exploring the adequacy of measuring university-industry collaboration through co-authorship and funding. Scientometrics, 69(3), 575-589. https://doi.org/10.1007/s11192-006-0170-5
- Macfadyen, L.P., Dawson, S., Pardo, A., & Gaševic, D. (2014). Embracing big data in complex educational systems: The learning analytics imperative and the policy challenge. Research & Practice in Assessment, 9, 17-28.
- McCoy, C., & Rosenbaum, H. (2019). Uncovering unintended and shadow practices of users of decision support system dashboards in higher education institutions. Journal of the Association for Information Science and Technology, 70(4), 370-384. https://doi.org/10.1002/asi.24131
- Melin, G. (2000). Pragmatism and self-organization: Research collaboration on the individual level. Research policy, 29(1), 31-40. https://doi.org/10.1016/S0048-7333(99)00031-1
- Melin, G., & Persson, O. (1996). Studying research collaboration using co-authorships. Scientometrics, 36(3), 363-377. https://doi.org/10.1007/bf02129600
- Miller, G. (2011). Social scientists wade into the Tweet stream. Science, 333(2011), 1814-1815.https://doi.org/10.1126/science.333.6051.1814
- Mohammadamin, E., Ali, R. V., & Abrizah, A. (2017). Co-authorship network of scientometrics research collaboration. Malaysian Journal of Library & Information Science, 17(3), 73-93.
- Nikzad, M., Jamali, H. R., & Hariri, N. (2011). Patterns of Iranian co-authorship networks in social sciences: A comparative study. Library & Information Science Research, 33(4), 313-319. https://doi.org/10.1016/j.lisr.2011.01.005
- Olmeda‐Gómez, C., Perianes‐Rodriguez, A., Ovalle‐Perandones, M.A., Guerrero‐Bote, V.P., & de Moya Anegón, F. (2009). Visualization of scientific co‐authorship in Spanish universities. Aslib Proceedings, 61(1), 83-100. https://doi.org/10.1108/00012530910932302
- Olsen, J. P. (2014). Accountability and ambiguity. In M. Bovens, R.E. Goodin, & T. Schillemans (Eds.). The Oxford handbook of public accountability (pp. 10-124). Oxford University Press.
- Osinska, V., & Klimas, R. (2021). Mapping science: tools for bibliometric and altmetric studies. Information Research, 26(4), paper 909. https://doi.org/10.47989/irpaper909.
- Özel, C., Ersoy, B., & Arus, O. (2020). Akademik değerlendirme ürünleri: InCites ve SciVal. [Academic assessment products: InCites and SciVal]. Türk Kütüphaneciliği, 34(2), 275-284.
- Perianes-Rodríguez, A., Olmeda-Gómez, C., & Moya-Anegón, F. (2010). Detecting, identifying, and visualizing research groups in co-authorship networks. Scientometrics, 82(2),307-319. https://doi.org/0.1007/s11192-009-0040-z
- Pham, Q. T., Mai, T. K., Misra, S., Crawford, B., & Soto, R. (2016). Critical success factors for implementing business intelligence system: empirical study in Vietnam. In International Conference on Computational Science and Its Applications (pp. 567-584). Springer. https://doi.org/10.1007/978-3-319-42092-9_43
- Ponomariov, B., & Boardman, C. (2016). What is co-authorship? Scientometrics, 109(3), 1939-1963. https://doi.org/10.1007/s11192-016-2127-7
- Popovič, A., Coelho, P. S., & Jaklič, J. (2009). The impact of business intelligence system maturity on information quality. Information Research, 14(4), paper 417. http://informationr.net/ir/14-4/paper417.html. (Internet Archive)
- Pouris, A., & Ho, Y. S. (2014). Research emphasis and collaboration in Africa. Scientometrics, 98(3), 2169-2184. https://doi.org/10.1007/s11192-013-156-8
- Rotolo, D., Rafols, I., Hopkins, M. M., & Leydesdorff, L. (2017). Strategic intelligence on emerging technologies: Scientometric overlay mapping. Journal of the Association for Information Science and Technology, 68(1), 214-233. https://doi.org/10.1002/asi.23631
- Schlattmann, S. (2017). Capturing the collaboration intensity of research institutions using social network analysis. Procedia Computer Science, 106, 25-31. https://doi.org/10.1016/j.procs.2017.03.005
- Schmidt, J. (2007). Knowledge politics of interdisciplinarity. Specifying the type of interdisciplinarity in the NSF’s NBIC scenario. Innovation: The European Journal of Social Science Research, 20(4), 313-328. https://doi.org/10.1080/13511610701760721
- Sharda R., Delen, D., & Turban, E. (2015). Business intelligence and analytics: systems for decision support. 10th Edition. Pearson,
- Shotton, D., Portwin, K., Klyne, G., & Miles, A. (2009). Adventures in semantic publishing: Exemplar semantic enhancements of a research article. Plos Computational Biology, 5(4), e1000361. https://doi.org/10.1371/journal.pcbi.1000361
- Sivertsen, G. (2019). Developing Current Research Information Systems (CRIS) as data sources for studies of research. In: Glänzel, W., Moed, H.F., Schmoch, U., Thelwall, M. (eds) Springer handbook of science and technology indicators, (pp. 667-683). Springer. https://doi.org/10.1007/978-3-030-02511-3_25
- Skolnikoff, E.B. (1993). The elusive transformation: science, technology and the evolution of international politics. Princeton University Press.
- Skyrius, R., Nemitko, S., & Talocka, G. (2018). The emerging role of business intelligence culture. Information Research, 23(4), paper 806. http://informationr.net/ir/23-4/paper806.html. (Internet Archive)
- Song, X., Chi, Y., Hino, K., & Tseng, B. (2007, November). Identifying opinion leaders in the blogosphere. In M.J. Silva, A.A.F. Laender, R. Baeza-Yates, D.L. McGuinness, B. Olstad, Ø.H. Olsen, & A.O. Falcão, (Eds.). CIMK2007: Proceedings of the 16th ACM Conference on Conference on Information and Knowledge Management, November 6-8, 2007, Lisboa, Portugal, (pp.971-974). Association for Computing Machinery.
- Stehr, N. (2005). Knowledge politics: governing the consequences of science and technology. Routledge.
- Tang, L., & Shapira, P. (2011). China–US scientific collaboration in nanotechnology: patterns and dynamics. Scientometrics, 88(1), 1-16. https://doi.org/10.1007/s11192-011-0376-z
- Tsai, C.C., Corley, E.A., & Bozeman, B. (2016). Collaboration experiences across scientific disciplines and cohorts. Scientometrics, 108(2), 505-529. https://doi.org/10.1007/s11192-016-1997-z
- UNICA, (2021). Network of universities from the capitals of Europe. https://www.unica-network.eu/. (Internet Archive).
- Velden, T., Haque, A. U., & Lagoze, C. (2010). A new approach to analyzing patterns of collaboration in co-authorship networks: mesoscopic analysis and interpretation. Scientometrics, 85(1), 219-242. https://doi.org/10.1007/s11192-010-0224-6
- Wagner, C. S., & Leydesdorff, L. (2005). Mapping the network of global science: comparing international co-authorships from 1990 to 2000. International Journal of Technology and Globalisation, 1(2), 185-208. https://doi.org/10.1504/ijtg.2005.007050
- Wagner, C. S., Whetsell, T. A., & Mukherjee, S. (2019). International research collaboration: Novelty, conventionality, and atypicality in knowledge recombination. Research Policy, 48(5), 1260-1270. https://doi.org/10.1016/j.respol.2019.01.002
- Williamson, B. (2016). Digital education governance: Data visualization, predictive analytics, and ‘real-time’ policy instruments. Journal of Education Policy, 31(2), 123-141. https://doi.org/10.1080/02680939.2015.1035758
- Clarivative Analytics. (2021). Web of Science core collections help: research areas. https://bit.ly/3DSSpNY. (Internet Archive).
- Yang, S., & Yuan, Q. (2017). Are scientometrics, informetrics, and bibliometrics different? In J. Qiu, R. Rousseau, C.R. Sugimoto, & F. Xin, (Eds.). Proceedings of the 16th International Conference on Scientometrics and Informetrics, ISSI 2017, Wuhan, China, October 16-20, 2017 (pp.107-1518). ISSI Society.
- Zeng, D., Chen, H., Castillo-Chavez, C., Lober, W.B., & Thurmond, M., (Eds.). (2010). Infectious disease informatics and biosurveillance. Springer Science & Business Media.
- Zhang, J., Ackerman, M.S., & Adamic, L. (2007). Expertise networks in online communities: structure and algorithms. In WWW '07: Proceedings of the 16th international conference on World Wide Web, 2007, 08-12 May, 2007, Banff, Alberta, Canada, (pp.221-230). Association for Computing Machinery. https://doi.org/10.1145/1242572.1242603