The effect of visualisation on user experience in recommender systems
Wen-Yau Liang, Chun-Che Huang, Tzu-Liang (Bill) Tseng, and Zih-Yan Wang.
Introduction. Measuring user experience, though natural in a business environment, is often challenging for recommender systems research. How recommender systems can substantially improve consumers’ decision making is well understood; but the influence of specific design attributes of the recommender system interface on decision making and other outcome measures is far less understood.
Method. This study provides the first empirical test of post-acceptance model adaption for information system continuance in the context of recommender systems. Based on the proposed model, two presentation types (with or without using tag cloud) are compared. An experimental design is used and a questionnaire is developed to analyse the data.
Analysis. Data were analysed using SPSS and SmartPLS (partial least squares path modeling method). Statistical methods used for the questionnaire on user satisfaction were a reliability analysis, a validity analysis and T-tests.
Results. The results demonstrate that the proposed model is supported and that the visual recommender system can indeed significantly enhance user satisfaction and continuance intention.
Conclusions. In order to improve the satisfaction or continuance intention of users, it is required to improve the perceived usefulness, effectiveness and visual attractiveness of a recommender system.
DOI: https://doi.org/10.47989/irpaper906
Introduction
One of the most valuable and distinguishing assets that an organization possesses is its knowledge (Jasimuddin, 2012). Organizational growth and survival, increased and more effective performance, sustained competitive advantage and improved quality of service are some of the benefits that successful handling of knowledge may bring. The utilisation of knowledge is key to production, power and advancement (Jasimuddin, 2012). With the advent of knowledge economy, the core of enterprises has been shifting from being labour or capital intensive to becoming technology intensive, and currently is now becoming knowledge intensive (Lu and Tseng, 2009). Knowledge management is a critical issue for enterprise management and has been the subject of both academic and industrial research (Rouse, 2002). Parent, et al. (2014) also demonstrates the importance of knowledge management and knowledge sharing. However, the huge amount of created knowledge can also lead to the problem of information overload (Li, et al., 2014). In recent years, recommender systems have expressively reduced the information overload (Portugal, et al., 2017; del Carmen Rodríguez-Hernández and Ilarri, 2021).
Gedikli, et al. (2014) reveals that the content-based tag cloud explanations are particularly helpful to increase the user-perceived level of transparency and to increase user satisfaction. Such tag clouds can be found on a number of popular Social Web sites such as Delicious and Flickr10 where they are used as a visualisation and interaction technique. Incorporating visualisation into recommender systems is beginning to be studied and makes the systems far easier to understand, and provides an effective means of permitting users to interact with systems. Wongsuphasawat, et al. (2016) seek to complement manual chart construction with interactive navigation of a gallery of automatically-generated visualisations. Visualisation techniques have been used by many researchers, and investigators combine a number of different graph layouts for more convincing systems (Saket, et al., 2019; Dimara, et al., 2017; Alsalemi, et al., 2020). Besides, most recommender systems focus on features of the methods and appropriateness, but lack explanations (Wang, et al., 2019). There are significant challenges to conducting human-centred research, including the difficulty of finding and maintaining user communities for research.
This study focuses on the assessment of user experience, thereby gaining information on how to improve user satisfaction and continuance intention through various visual designs. Post-acceptance model of information system continuance has proved to be effective to evaluate user satisfaction and continuance intention (Hadji and Degoulet, 2016; You, et al., 2020). This study proposes a research model to explain the successful adoption of recommender systems by extending post-acceptance model of information system continuance and empirically validating the relationships among the constructs in the model with experimental study. The impact of visual attractiveness is explored by proposed model. The remainder of this paper is organized as follows. First, literatures related to recommender system, information visualisation, tag cloud and post-acceptance model of information system continuance are surveyed. Then, the research methodology and the proposed questionnaire are described. Third, the experiments and the summarised survey results are illustrated. Finally, conclusions are drawn.
Literature review
Recommender systems
Recommender systems are filters which suggest items or information that might be interesting to users. These systems analyse the past behaviour of a user, build a user profile that stores information about user interests, and then analyse that profile to find potentially useful items (de Gemmis, et al., 2015). Some of these systems provide the end user with a personalised item list and an explanation that describes why a specific item is recommended and why the system supposes that the user will like it (Gedikli, et al., 2014). A number of studies have already demonstrated that recommender systems can subtly steer consumer decision (Nanou, et al., 2010; Xiao and Benbasat, 2018; Köcher, et al., 2019).
Survey papers on recommender systems have been published in recent years. There are a few studies of system effectiveness and evaluation criteria from users’ perspectives. Product recommendation agents and other web-based decision aids are deployed extensively to provide online shoppers with virtual advice services. Though the design of product recommendation agents’ functional features has received a substantial amount of attention in academic studies, the social aspects of human–product recommendation agents’ interactions have been studied less (Qiu and Benbasat, 2010). That recommendation agents can substantially improve consumers’ decision making is well understood; but the influence of specific design attributes of the interface on decision making and other outcome measures much less so (Xu, 2014). Konstan and Riedl (2012) reviewed the key advances in collaborative filtering recommender systems, focusing on the evolution from research that concentrates purely on algorithms to research that concentrates on the rich set of questions around the user experience with the recommender. As recommender technology is now becoming widely accepted, the ability to characterise user experience and users’ affective attitudes toward this technology has become extremely important (Pu, et al., 2011). However, several studies argue that there are other factors influencing the user experience. Situational or personal aspects (e.g., product expertise and privacy concerns) can also influence how people interact with and evaluate a system (Knijnenburg and Willemsen, 2009, 2010; Knijnenburg, et al., 2011).
User experience issues are increasingly being studied, in an effort to understand and identify effective methods to elicit preferences and to design guidelines to enhance a recommender’s interface layout (Ozok, et al., 2010). An integrated view of the user experience of recommender systems can be obtained by means of user-centric development and evaluation (Pu, et al., 2011). To understand and improve user experience with recommender systems, it is necessary to conduct empirical evaluations that consider the entire process that defines the user experience (Knijnenburg, 2012). This can provide a better understanding of why and how certain aspects of the system result in better user experience and others do not, thereby helping to further user-centric research and the development of recommender systems (Knijnenburg, 2012). Although, Pu, et al., (2011) had suggested a wide range of criteria regarding users’ experiences (e.g. usability, diversity, user satisfaction), in this research, the user experience is defined as a substitute for usability or user satisfaction without following the theoretical concepts.
Information visualisation
Display designers and content producers are currently soliciting users’ attention in a time when people have tended to develop a degree of immunity against the steady information overload. The main goal for designers is to find the essential features that can implement visualisation that will attract users’ attention (Meyer, 2010). With the rapid growth of knowledge resources and the increasing individual demands of users, the problem of how to spend less effort in finding desired knowledge is becoming increasingly important. By using knowledge mapping techniques, a large and complex set of knowledge resources can be assimilated and navigated more easily (Li and Song, 2011). Abstracting and implementing the visual presentation of views as products of very complex system models is nearly as important to the effectiveness of these efforts to inform decision-making, as the technical competency and completeness of those models. However, the information visualisation of data from complex system models is often considered secondary to technical considerations (Sindiy, et al., 2013).
Explanations in recommender systems have gained increasing importance in the last few years. It has been found that explanations can help increase user acceptance of collaborative filtering recommender systems, helping users to make decisions more quickly, convincing them to buy and even developing trust as a whole (Al-Taie and Kadry, 2014). While most research on website design has focused on functional tasks, the Internet offers many opportunities for leisure as well as experiential activities. Following the evolution of more developed society toward an experience economy, analysing the role of technologies in the presence of prior user experiences makes sense (Pallud and Straub, 2014).
Visualisation is very important in any simulation activity and it is important to use the most appropriate representation techniques to match users’ real needs (Boton, et al., 2013). Existing network analysis tools, however, often lack intuitive interfaces to support the exploration of large scale data. Verbert, et al. (2013) presented a visual recommender system to help guide users during the navigation of network data. Collaborative filtering, similarity metrics, and relative importance are used to generate recommendations of potentially significant nodes for users to explore. In addition, graphic layout and node visibility are adjusted in real-time to accommodate recommendation display and to reduce visual clutter.
Parra (2012) aimed to understand how different visualisations and some personal traits might influence users’ assessment of recommended items, particularly in domains where multidimensional data or contextual constraints are involved. Eppler and Pfister (2013) conducted on-site observations, focus groups, and interviews, together with analysis of the site, documents, tools and software within police headquarters. One main result of the empirical investigation was that the police force’s practice of hybrid (i.e., both digital and physical) knowledge visualisation offers a useful strategy for corporate knowledge management as well.
Verbert, et al. (2013) presented the use of information visualisation techniques to interact with recommender systems. More specifically, both the effectiveness and probability of item selection increase when users are able to explore and interrelate multiple entities, that is, items bookmarked by users, recommendations and tags. One study presented a human cognition framework for information visualisation. This framework emphasises how top-down cognitive processing enables the induction of insight, reasoning, and understanding, which are key goals of the visual analytics community (Patterson, et al., 2014). Visualisation techniques have been used by many researchers who combine a number of different graph layouts for more convincing systems in different domains. Saket, et al. (2019) found the effectiveness of these visualisation types significantly varies across task, suggesting that visualisation design would benefit from considering context-dependent effectiveness. Alsalemi, et al. (2020) presented an overview of the micro-moment based energy efficiency framework that aims to integrate behaviour change theories, effective data visualisation via the end-user application, and personalised recommenders.
Tag cloud
A tag cloud is one type of visual presentations of a set of words, typically a set of tags selected according to some rationale, in which attributes of the text such as size, weight, or color are used to represent features, such as frequency, of the associated terms. Rivadeneira, et al. (2007) describes two studies to evaluate the effectiveness of differently constructed tag cloud for the various tasks they can be used to support, including searching, browsing, impression formation and recognition. A word cloud is a special visualisation of text in which the more frequently used words are effectively highlighted by more prominence in the representation. Word clouds can be a useful tool for preliminary analysis and for validation of previous findings (McNaught and Lam, 2010). Al-Taie and Kadry (2014) focused on the visualisation of explanations in recommender systems and learned what modalities (e.g. text, graphs, tables, and images) can better present explanations to users, through the review of a selection of papers in the literature over the last few years. The results show that explanations with simple graphs and descriptions can better present explanations. Gedikli, et al. (2014) found that the content-based tag cloud explanations are particularly helpful to increase the user-perceived level of transparency and to increase user satisfaction, even though they demand higher cognitive effort from the user. Yoon and Chung (2016) reviewed Boston Bombing related tags from a tag-cloud result and aimed to understand how images are used in communication practices in the Twitter environment.
Two studies evaluated the effectiveness of differently constructed tag cloud for the various tasks they can be used to support, including searching, browsing, impression formation and recognition. Based on these studies, a paradigm was proposed for evaluating tag cloud and ultimately guidelines for tag cloud construction (Rivadeneira, et al., 2007). Romero, et al. (2013) proposed a tag cloud generation module designed to help users to more fully comprehend the retrieved information. As hypertext learning environments are widely used in education, it is important to study and understand the effects and consequences of its use. Hypertext learning environments are non-linear, which means that users must develop ways to navigate through them. Thus, developing interfaces that facilitate and guide navigation is important for learning (Walhout, et al., 2015).
Post-acceptance model of information system continuance
Expectation-confirmation theory is widely used in the consumer behaviour literature to study consumer satisfaction, post-purchase behaviour (e.g., repurchase, complaining), and service marketing in general (Oliver, 1980). Expectation confirmation theory is adapted from the consumer behaviour literature and integrated with theoretical and empirical findings from previous information system use research to theorise a post-acceptance model of information system continuance (Bhattacherjee, 2001).
The model suggests that users' continuance intention is determined by their satisfaction with information system use and perceived usefulness of continued use (Figure 1). User satisfaction, in turn, is influenced by their confirmation of expectation from previous use and perceived usefulness. Post acceptance perceived usefulness is influenced by users' confirmation level.
The perspective of exit-voice theory (Hirschman, 1970) posits that satisfaction will increase customers’ loyalty to a product or service, while dissatisfaction may lead customers to leave or to voice their complaints and seek compensation. Likewise, Bhattacherjee (2001) and Oliver (1980) also suggest that satisfied customers will develop their repurchase intention, whereas dissatisfied customers may discontinue subsequent use. Past studies have provided empirical evidence to support the influence of satisfaction on behavioural intention (Zheng, et al., 2013; Hadji and Degoulet, 2016; You, et al., 2020).
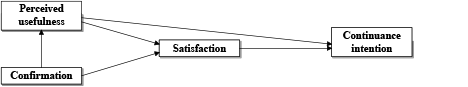
Figure 1: Post-acceptance model of information system continuance
Chiu, et al. (2007) found that students with higher satisfactions to use an online learning system had a greater intention to continue using it. Zhao, et al. (2008) reported that customer satisfaction is positively linked to the behavioural intention to continue using a self-service machine. Oh, et al. (2013) focused on tourists’ adoption of self-service technologies at resort hotels, and found that perceived usefulness is positively related to intention to use. In addition, many other studies have provided evidence of the significant positive effect that perceived usefulness has on the behavioral intention to continue using something (Ku and Chen, 2013), and that satisfaction can increase the technology-related or Internet-related behavioural intentions of customers (Fang, et al., 2011; Zheng, et al., 2013; Hsu, et al., 2014; Qu and Kim, 2019; You, et al., 2020).
Research method
Research model and hypotheses
In this study, post-acceptance model of information system continuance is extended to elucidate successful adoption of the recommender system. The relationship between visualisation effect and continuance intention is also identified and explored. Post-acceptance model of information system continuance is adapted as the basis for modifications. The construct of confirmation is defined in the post-acceptance model as: 'Users expect the system to provide its actual performance with perceived consistency' (Bhattacherjee, 2001, p. 353) However, since this study is for a recommender system, not a general information system, it is not necessary for each subject to have the same familiarity with the system. Therefore, this study removes this construct from the model to avoid the subject's misunderstanding. In addition, Gedikli, et al. (2014) stated that the effectiveness of a recommender system may affect the level of satisfaction, which needs to be studied in greater depth. This study also aims to explore the impact of visual attractiveness. Consequently, the two constructs of effectiveness and visual attractiveness have been added to the proposed model. The model consists of five dimensions: perceived usefulness, effectiveness, visual attractiveness, user satisfaction, and continuance intention. The research model is shown in Figure 2.
Figure 2: Research model
Tag clouds were introduced by Gedikli et al. (2011) as another way of visualising explanations in the recommender systems. The assumption is that each recommendable item can be characterised by a set of tags or keywords. Several researchers have found that tag clouds are effective and useful. Romero, et al. (2013) tested the design of a tag cloud generation module algorithmically with no users involved which indicated that it can help users to retrieve information. Through the presentation type of tag cloud, users can easily search the database (Torres-Parejo, et al., 2013). Tag cloud is expressed by its font size (relative to the other tags) and is therefore easily recognised (Batman, et al., 2008). A tag cloud can improve the learning process (Walhout, et al., 2015) and increase user satisfaction (Gedikli, et al., 2014). Saket, et al. (2019) found the effectiveness of visualisation types significantly varies across tasks, suggesting that visualisation design would benefit from considering context-dependent effectiveness. Hence, the following hypotheses:
H1: The use of a tag cloud in a recommender system has higher perceived usefulness than no use.
H2: The use of a tag cloud in a recommender system has higher effectiveness than no use.
H3: The use of a tag cloud in a recommender system has higher visual attractiveness than no use.
H4: The use of a tag cloud in a recommender system has higher user satisfaction than no use.
Perceived usefulness
Usefulness is defined as the user's subjective probability that using a particular information system will enhance his/her performance (Davis, et al., 1989). This in turn influences the user's intention to continue using the system. Kim and Ong (2005) noted that perceived usability and satisfaction are highly correlated. Flavian, et al. (2006) analysed the role of satisfaction and website perceived usability in developing customer loyalty in the e-banking business. The data showed that website perceived usability has a positive effect on customer satisfaction.
Wang and Liao (2008) provided the first empirical test for an adaptation of DeLone and McLean's information system success model in the context of government to consumer eGovernment. The hypothesised relationships between use and user satisfaction is significantly supported by the data. Liaw and Huang (2013) investigated learner self-regulation in e-learning environments. Their statistical results showed that satisfaction of e-learning will be influenced by perceived usefulness.
Numerous research studies provide empirical support for the positive association between usefulness and information technology use intention (Premkumar and Bhattacherjee, 2008; Lee and Lee, 2009; Boakye, et al., 2014). Multiple studies also attempt to identify the antecedents and drivers of post-adoption human behavioural intention and usage behaviour. A few significant antecedents are consumer satisfaction, perceived usefulness, perceived ease of use, subjective norms and perceived enjoyment. Nearly half of the studies (43%) used satisfaction and perceived usefulness as key intrinsic factors to empirically establish the influence of these antecedents on continuous behavioural intention and usage (Shaikh and Karjaluoto, 2015).
Stefanovic, et al. (2016) further evaluated the effectiveness of the Government Information System from the perspective of government employees, and found that perceived usefulness and user satisfaction have a significant, direct relationship. Ramírez-Correa, et al. (2017) used the information system success model to explore the success of a learning management system. The study confirmed that perceived usefulness and satisfaction are highly correlated. Numerous research studies have provided empirical support for the positive association between usefulness and continuance use intention (Hadji and Degoulet, 2016; Hadji, et al., 2016; Demoulin and Coussement, 2020; Al-Fraihat, et al., 2020). Hence, we present the following hypotheses:
H5: Perceived usefulness has a significant positive impact on user satisfaction.
H6: Perceived usefulness has a significant positive impact on continuance intention.
Effectiveness
The definition of effectiveness is, the ability to help users make better decisions; that is, it can help users accurately assess the quality of the recommendation and thus make better decisions (Gedikli, et al., 2014). In a study of which factors will affect e-learning user satisfaction, effectiveness was found to have a positive impact for user satisfaction and perceived usefulness (Calli, et al., 2013). Gedikli, et al. also found that the effectiveness of the system is influential for user satisfaction. This leads to the following hypotheses:
H7: Effectiveness has a significant positive impact on user satisfaction.
H8: Effectiveness has a significant positive impact on perceived usefulness.
Visual attractiveness
Heijden (2003) explored the impact factor of using websites and proposed a new concept (visual attractiveness), defining it as, 'a person thinks the web site looks aesthetic' (p. 544), which is a subjective feeling. Liu, et al. (2013) investigated the relationship between different websites and consumer impulse buying behaviour. The results show that visual attractiveness influences the purchasing behaviour. Cyr, et al. (2010) also found that the configuration of a website is an important factor for user satisfaction. Therefore, the current study considers presentation type as a variable factor, in order to better understand how visual attractiveness will impact user satisfaction. This leads to the hypothesis:
H9: Visual attractiveness has a significant positive impact on user satisfaction.
User satisfaction
The topic of customer satisfaction has held a significant position in the marketing literature since satisfied customers can generate long-term benefits for companies, including customer loyalty and sustained profitability (Homburg, et al., 2006). Customer satisfaction is highly related to behavioural intentions and is regarded as one of the key antecedents of post-purchase behavioural intentions because customer satisfaction has a positive effect on the customer's attitude towards the product or service and it can reinforce the customer's conscious effort to purchase the product or service again in the future (Oliver, 1980, 1999; Liu and Jang, 2009).
In the mobile banking context, continuous intention is found to be solely dependent on the satisfaction of customers (Reji and Ravindran, 2012). In another empirical study, students’ intentions to continue are directly and meaningfully influenced by their satisfaction and perceived usefulness of electronic textbooks (Stone and Baker-Eveleth, 2013); user satisfaction with Web 2.0 applications (Facebook, iGoogle, Plurk, Twitter, and YouTube) and online knowledge groups significantly affects electronic word-of-mouth, which in turn significantly influences their intention to continue (Chen , 2012).
Similarly, satisfaction and perceived usefulness were found to play a significant role in the continuance intention and usage of web analytical services (Park, et al., 2010), Internet-based learning technologies (Limayem and Cheung, 2011) and online communities (Apostolou et al., 2017). Numerous research studies have provided empirical support for the positive association between user satisfaction and continuance intention (Bae, 2018; Li and Fang, 2019; Alalwan, 2020). This leads to the hypothesis:
H10: User satisfaction has a significant positive impact on continuance intention.
Experimental design
This study uses laboratory experimentation and adopts C# as the programming language to construct the experiment platform. Microsoft Visual Studio Express 2013 for the Web is the development environment. The database is built by referring to the information on the job bank's website. The database contains 300 users in 120 types of knowledge rated between 1–10 for a total of 36,000 records. The knowledge includes the relation between a job offering and a skill. The algorithm that is used in the recommender system is adapted from a centring-bunching based clustering algorithm that is used for hybrid personalised recommender systems (Shinde and Kulkarni, 2012). The experimental process is shown in Figure 3.
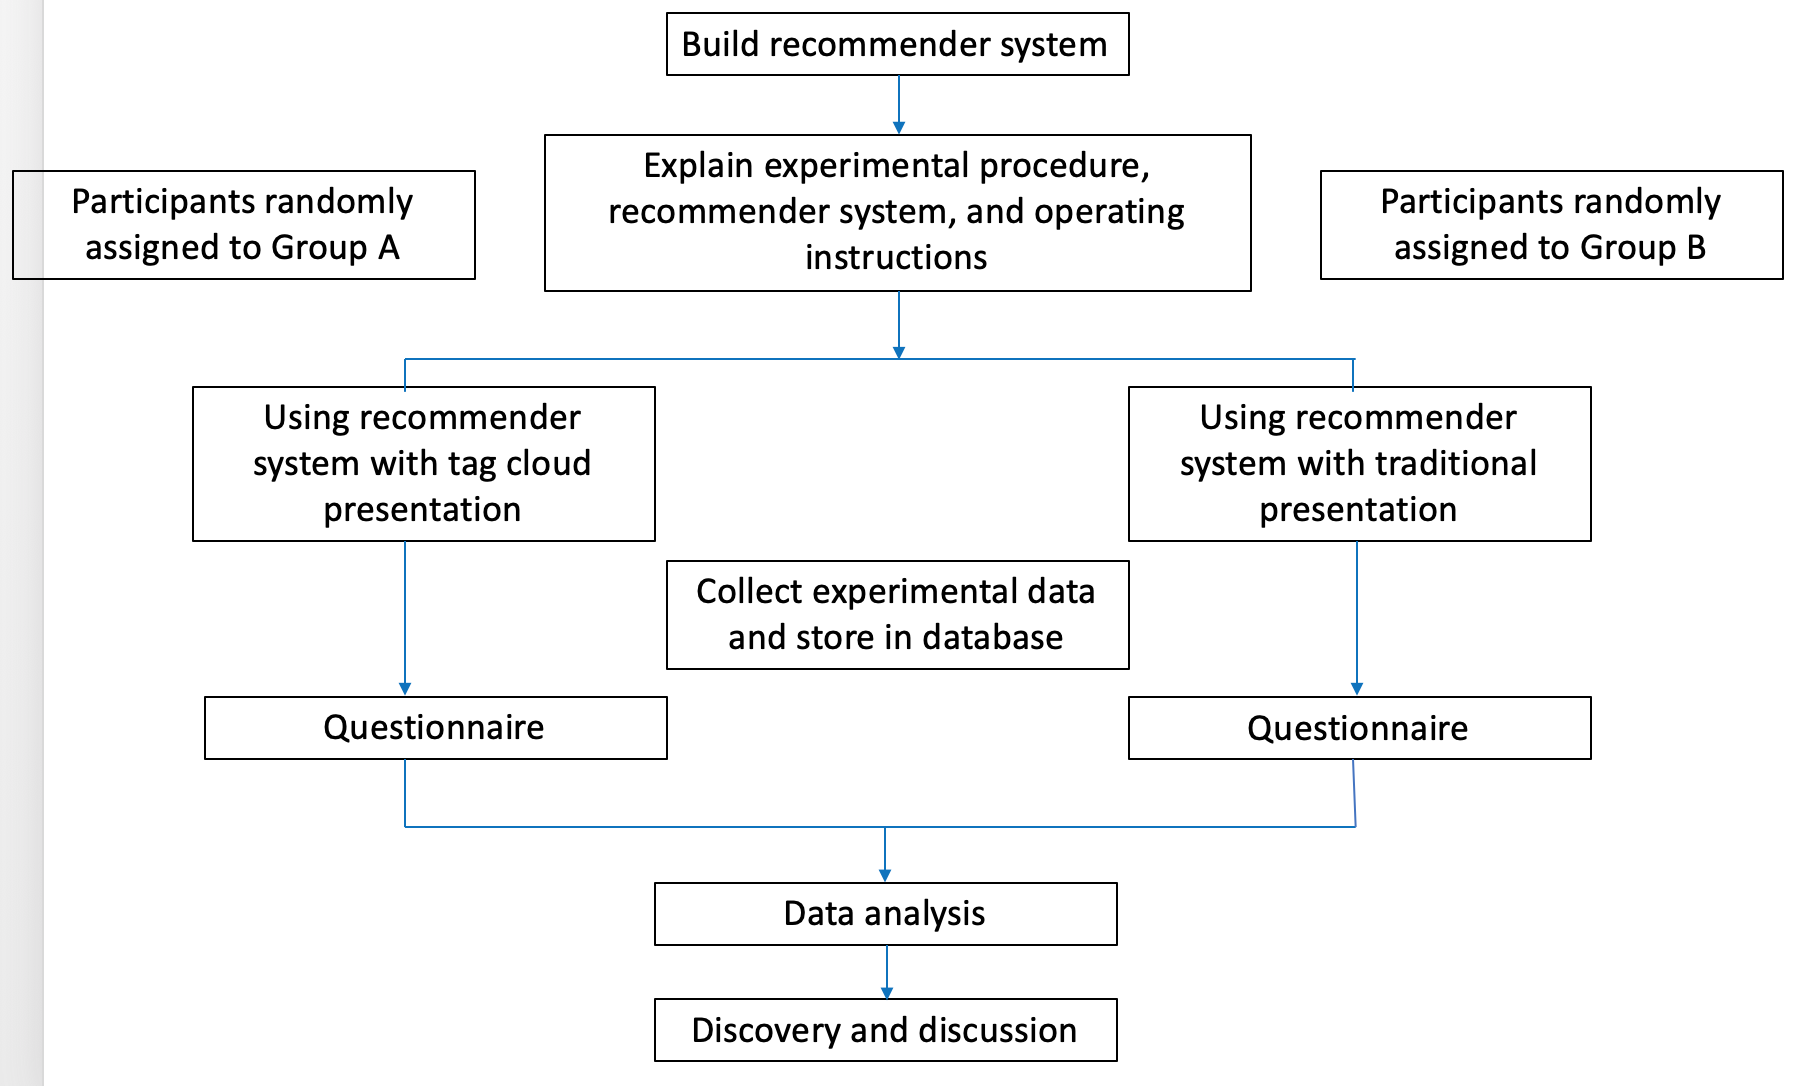
Figure 3: The experimental process
This study asked participants to use recommender systems to search for a software engineer job. The job bank has a job openings repository, knowledge base, and historical knowledge score data in its database. The software engineers can be divided into four different categories by programming languages: C #, C ++, JAVA and python. What a participant needs to do is to navigate the system and input necessary information, this information will then be used by the system for subsequent recommendations to acquire the most interconnected jobs. Roscoe (2004) noted that as a rule of thumb, between 30 and 500 is an appropriate sample size.
The participants in this research were all graduate students from an information management department, and all had a basic understanding of a recommender system. The total of 120 participants was randomly divided equally into two groups, A and B. Randomly assigning the participants means that the perception of the recommender system is not affected by extraneous factors. All participants (both Group A and Group B) used the same recommender system interface and algorithm to search and browse. The only difference between Group A and Group B was the presentation type of search results. Group A used the tag cloud type of presentation (Figure 4) and Group B did not (traditional type) (Figure 5).

Figure 4: Screen shot of the tag cloud presentation
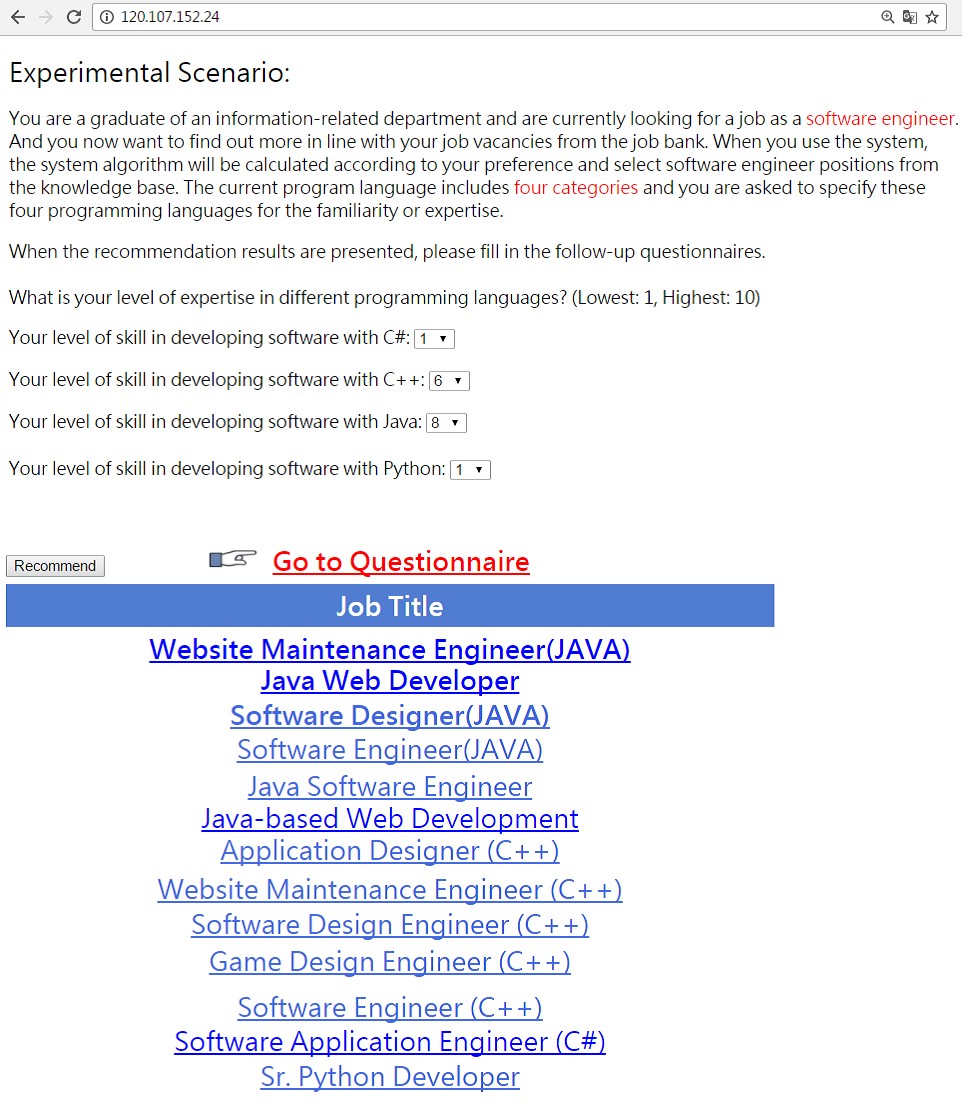
Figure 5: The screen shot of traditional type of presentation
A tag cloud generator was built to analyse a set of jobs, and immediately discover jobs that users mention most often, as well as what they value most. Group A’s results will be presented in tag cloud in which words are shown in varying sizes depending on how often they appear in the data with predefined layouts and colour. On the other hand, group B’s results will be presented in traditional type in which words are shown in same sizes. All participants could spend ten minutes to view the job details, and then fill in the questionnaire.
Measures of the constructs
To ensure the content validity of the scales used in a study, the items selected for the constructs should represent the concepts about which generalisations are to be made. Hence the items selected for the constructs in this study were mainly adapted from prior studies to ensure content validity. Four items, selected from Calli, et al. (2013) and Kwabena, et al. (2014) were adapted and used in this study to measure perceived usefulness. Three items, selected from Tintarev and Masthoff (2012) and Lin, et al. (2010) were adapted and used in this study to measure effectiveness. Five items selected from Loiacono, et al. (2007), Cyr, et al. (2010) and Liu, et al. (2013) were adapted and used in this study to measure visual attractiveness. Four items, selected from Belanche, et al. (2012) and Aversano and Tortorella (2013) were adapted and used in this study measure to user satisfaction. Three items, selected from Kwabena, et al. (2014), Bhattacherjee (2001) and Premkumar and Bhattacherjee (2008) were adapted and used in this study to measure continuance intention.
Each item was adapted to specifically reference recommender systems. Likert scales (1–5), with anchors ranging from “strongly disagree” to “strongly agree,” were used for all questions. After the retesting of the measures, these items were modified to fit the recommender system context studied. The scale was tested for various reliability and validity properties. Cronbach’s alpha was used to assess the reliability of the scale, which provides an indication of the internal consistency of the items measuring the same construct. Construct validity was assessed by both convergent and discriminant validity using factor analysis.
Data analysis
Data were analysed using SPSS version 12.0 and SmartPLS (partial least squares path modelling method) 2.0. Statistical methods used for the questionnaire on user satisfaction were a reliability analysis, a validity analysis and T-tests. A total of 120 responses were obtained. 57% of the respondents were male. Subjects were also asked to consider their own familiarity with the recommender system. 57% subjects considered themselves to be very familiar, and 35% subjects were familiar. Thus most subjects in this study have a reasonable degree of understanding of, and experience with recommender systems.
Results
Measurement model
In SmartPLS, the consistent PLS algorithm, usually called just the PLS algorithm, is the default standard partial least squares modelling procedure. After the path model is created, output reports (Table 1-4, Figure 7) are available after running the PLS algorithm. These questionnaires are considered to be reliable because their Cronbach α values are within a range of 0.811-0.927 (Table 1) and thus are greater than the 0.70 threshold, which indicates that the scales are reliable (Nunnally, 1975).
| Construct | Item count | Cronbach's Alpha |
|---|---|---|
| Perceived usefulness (PU) | 4 | 0.811 |
| Effectiveness (E) | 3 | 0.900 |
| Visual attractiveness (VA) | 5 | 0.883 |
| User satisfaction (US) | 4 | 0.899 |
| Continuance intention (CI) | 3 | 0.927 |
The questionnaire is based on the literature and then amended by experts, so it has content validity. Finally, this paper uses factorial analysis to assess construct validity. Factor analysis is considered one of the strongest approaches to establishing construct validity and is the most commonly used method for establishing construct validity measured by an instrument. Convergent validity is evaluated by factor loading and average variance extracted (AVE). Convergent validity is established if individual factor loadings are greater than 0.7 and average variance extracted exceeds 0.5 (Hair, et al, 1992).
Table 2 presents the factor loading values of individual measurement items and the average variance extracted of each construct. All the factor loadings values are greater than 0.8 and the average variance extracted values exceed 0.7. The measurement scales exhibit convergent validity. Discriminant validity is determined through an examination of a cross loading table. A cross loading table must indicate that the measurement items load highly on their theoretically assigned factors and not highly on other factors (Gefen and Ridings, 2003).
| Measure | Item | Factor loadings | AVE |
|---|---|---|---|
| Perceived usefulness | Q1 This recommender system can help me decide what I need. | 0.872 | 0.740 |
| Q2 This recommender system can improve my efficiency when searching for a job. | 0.824 | ||
| Q3 This recommender system let me easily search for a job. | 0.859 | ||
| Q4 Overall, I think this recommender system is useful. | 0.884 | ||
| Effectiveness | Q5 This type of presentation can help me determine how much I like this recommendation result. | 0.857 | 0.725 |
| Q6 I can accept this recommendation result provided by this system | 0.841 | ||
| Q7 I like the interactive features of this recommender system. | 0.856 | ||
| Visual attractiveness | Q8 This recommender system is visually pleasant. | 0.883 | 0.775 |
| Q9 The presentation type of this recommender system is pleasant. | 0.921 | ||
| Q10 The visual design of this recommender system is attractive to me. | 0.899 | ||
| Q11 I like the presentation type of this recommender system. | 0.831 | ||
| Q12 The overall interface of this recommender system looks professional. | 0.864 | ||
| User satisfaction | Q13 Using this recommender system is the right decision. | 0.869 | 0.768 |
| Q14 I am satisfied with my experience using this recommender system to find job vacancies. | 0.895 | ||
| Q15 Overall, I think the results recommend by this recommender system are in line with my expectations. | 0.862 | ||
| Q16 I will continue to use this recommender system to search for a job. | 0.879 | ||
| Continuance intention | Q17 If possible, I intend to use this recommender system in the future. | 0.932 | 0.833 |
| Q18 If possible, I will continue to use this recommender system in everyday life. | 0.892 | ||
| Q19 I will continue to use this service in the future. | 0.914 |
Table 3 shows that the loadings of individual items on its assigned construct are higher than with other construct.
| Item | Perceived usefulness | Effectiveness | Visual attractiveness | User satisfaction | Continuance intention |
|---|---|---|---|---|---|
| Q1 | 0.872186 | 0.662247 | 0.532362 | 0.734873 | 0.687684 |
| Q2 | 0.824312 | 0.553576 | 0.42428 | 0.606283 | 0.577528 |
| Q3 | 0.859644 | 0.645536 | 0.548647 | 0.689423 | 0.675959 |
| Q4 | 0.884224 | 0.727819 | 0.611642 | 0.761497 | 0.725597 |
| Q5 | 0.639497 | 0.857374 | 0.638467 | 0.635974 | 0.615525 |
| Q6 | 0.675947 | 0.841242 | 0.538156 | 0.730706 | 0.66536 |
| Q7 | 0.613891 | 0.856328 | 0.688948 | 0.624674 | 0.624037 |
| Q8 | 0.617502 | 0.689102 | 0.88309 | 0.706401 | 0.747376 |
| Q9 | 0.576752 | 0.680589 | 0.921308 | 0.713563 | 0.711884 |
| Q10 | 0.640072 | 0.699306 | 0.898692 | 0.710932 | 0.730337 |
| Q11 | 0.402687 | 0.48946 | 0.831731 | 0.548943 | 0.567746 |
| Q12 | 0.457427 | 0.608746 | 0.863639 | 0.625116 | 0.652918 |
| Q13 | 0.724626 | 0.784259 | 0.716441 | 0.86864 | 0.7329 |
| Q14 | 0.736211 | 0.672399 | 0.627583 | 0.894589 | 0.754297 |
| Q15 | 0.678356 | 0.666891 | 0.594657 | 0.862236 | 0.723668 |
| Q16 | 0.717528 | 0.619406 | 0.706415 | 0.879011 | 0.790407 |
| Q17 | 0.752663 | 0.730072 | 0.722719 | 0.821612 | 0.931683 |
| Q18 | 0.686608 | 0.639559 | 0.661015 | 0.769475 | 0.892366 |
| Q19 | 0.691068 | 0.67381 | 0.752941 | 0.752969 | 0.914127 |
The square root of average variance extracted can also be used to determine discriminate validity, which is confirmed if the square root of average variance extracted is greater than the off-diagonal elements of a correlation matrix (Fornell and Larcker, 1981). Table 4 shows that all constructs satisfy this criterion and demonstrate adequate discriminant validity.
| Measure | Perceived usefulness | Effectiveness | Visual attractiveness | User satisfaction | Continuance intention |
|---|---|---|---|---|---|
| Perceived usefulness | 0.860 | ||||
| Effectiveness | 0.757 | 0.851 | |||
| Visual attractiveness | 0.621 | 0.726 | 0.880 | ||
| User satisfaction | 0.816 | 0.783 | 0.756 | 0.876 | |
| Continuance intention | 0.779 | 0.747 | 0.780 | 0.857 | 0.913 |
Structural model
The t-test compares two sample means by calculating Student’s t-value and displays the two-tailed probability of the difference between the means. This study compared the results of the SPSS analysis from two groups, presentation with tag cloud and presentation without tag cloud, to test the hypotheses examining the effect of visualisation (H1-H4). The SPSS analysis is shown in Table 5 and Figure 6. These results clearly indicate that Group A (using tag cloud presentation) was superior to Group B (not using tag cloud presentation), since the five constructs all reached significance levels of 0.01. Thus, hypotheses: H1, H2, H3, H4, H5 are supported.
| Measure | Group | Means | St. dev. | T value | P value |
|---|---|---|---|---|---|
| Perceived usefulness | A | 4.0417 | 0.68142 | 3.556 | 0.001*** |
| B | 3.6125 | 0.64016 | |||
| Effectiveness | A | 3.8889 | 0.66855 | 3.752 | 0.000*** |
| B | 3.4389 | 0.64511 | |||
| Visual attractiveness | A | 3.6900 | 0.82538 | 3.698 | 0.000*** |
| B | 3.1400 | 0.80364 | |||
| User satisfaction | A | 3.9500 | 0.72894 | 3.814 | 0.000*** |
| B | 3.4458 | 0.71913 |
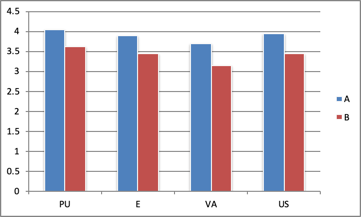
Figure 6: Graphical comparison of groups A and B
After running the PLS algorithm, the report of R-squared was found (Figure 7). R-squared is a goodness-of-fit measure for linear regression models. This statistic indicates the percentage of the variance in the dependent variable that the independent variables explain collectively. The results account for 57.3% of the variance in perceived usefulness, 77.9% of the variance in user satisfaction, and 75.3% of the variance in continuance intention. Thus the results indicate that the research model significantly explains the successful adoption of recommender systems, and all six hypotheses (H5–H10) are significant and supported. The strongest relationship exists between user satisfaction and continuance intention. Perceived usefulness is an important factor that explains user satisfaction. The effect size is relatively small for the relationship between effectiveness and user satisfaction, though the relationship is significant.
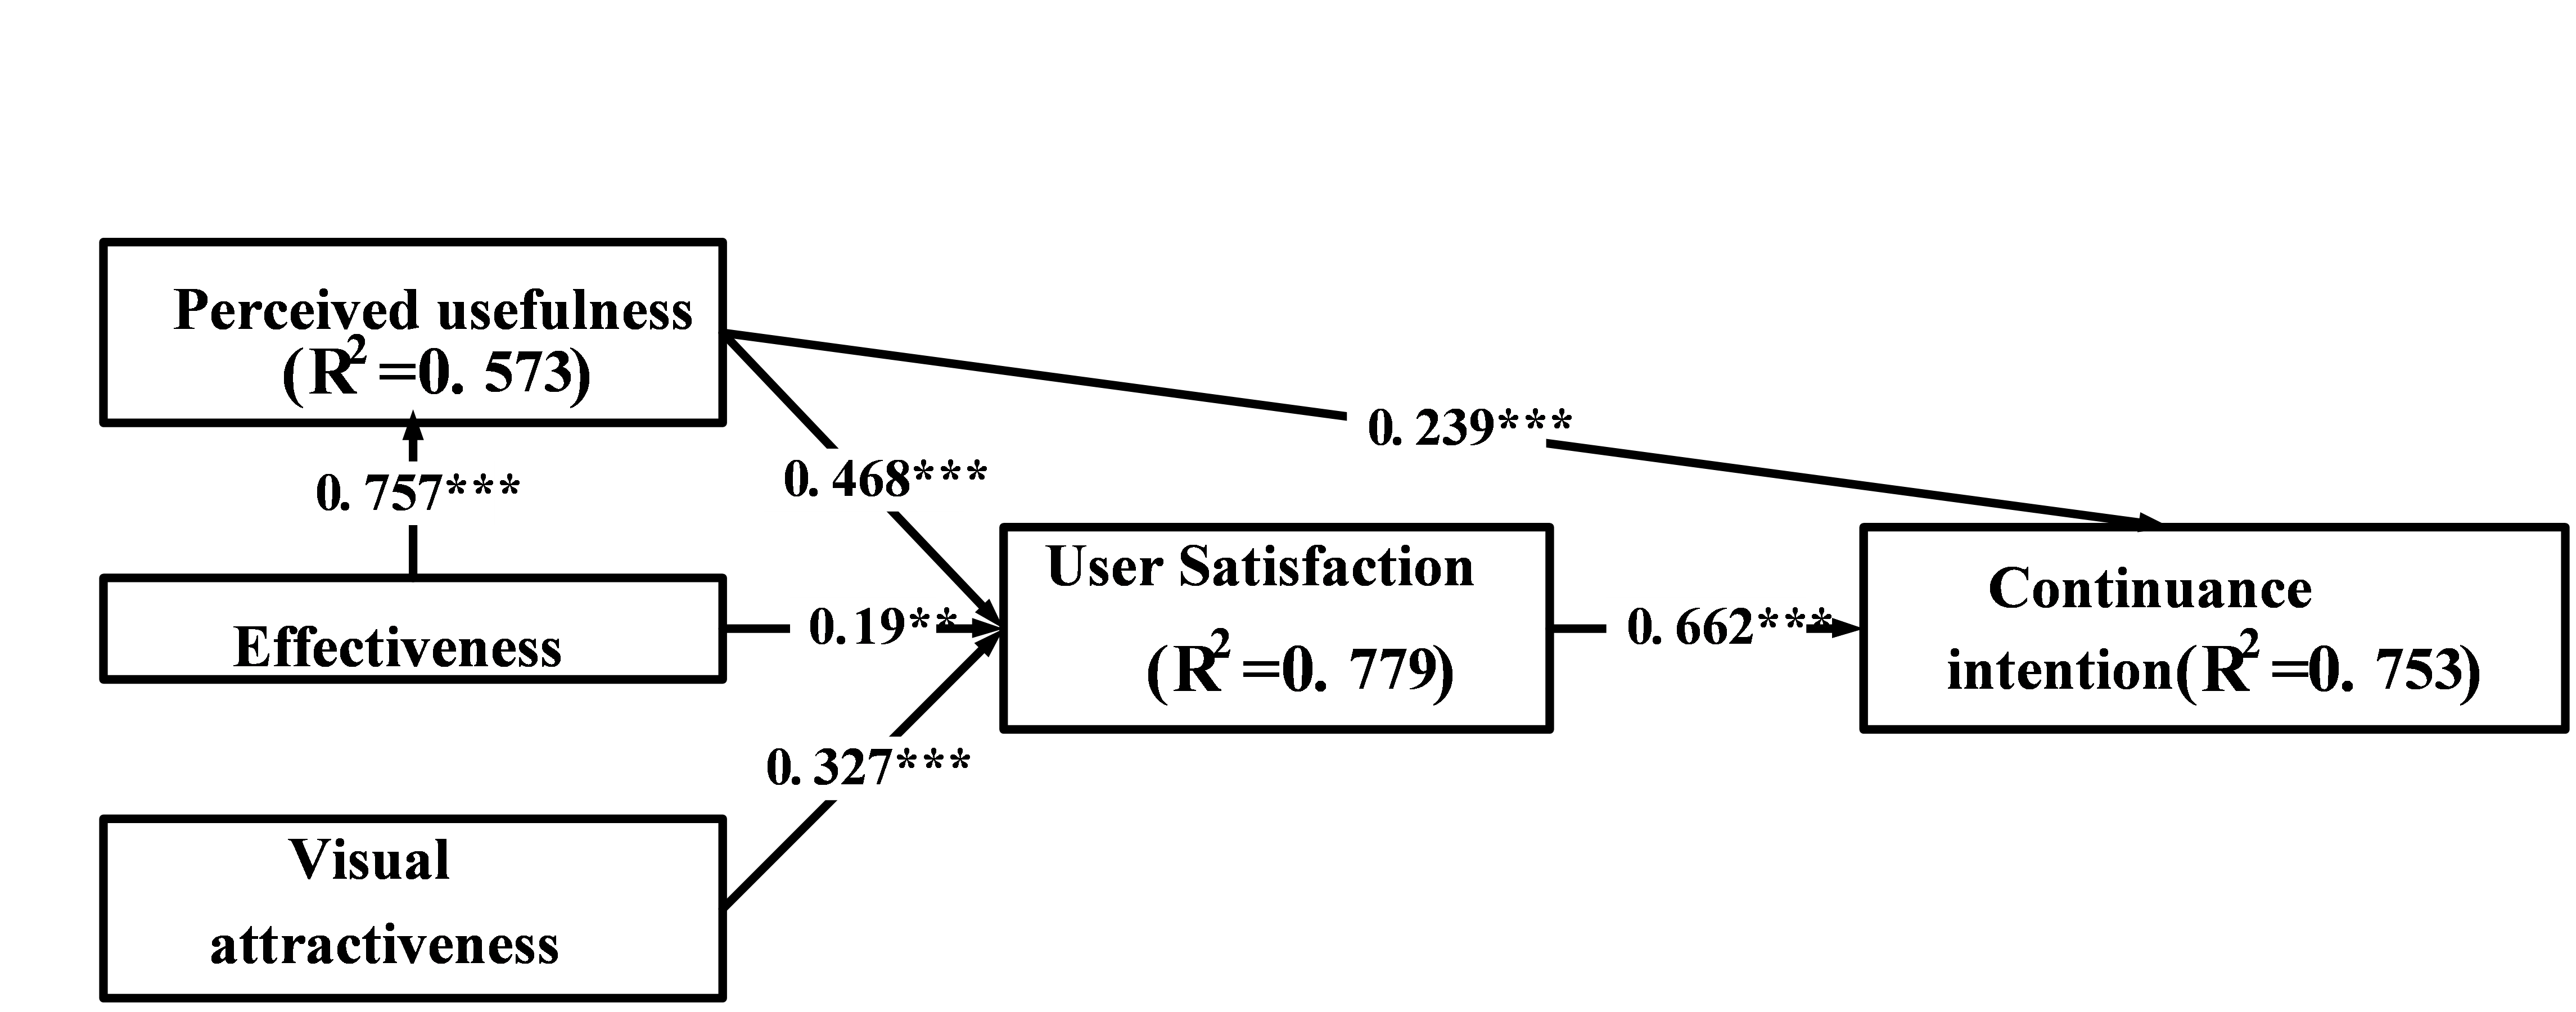
Figure 7: PLS results of the structural model. **p < 0.05. ***p < 0.01.
This study further compared the results of the PLS analysis from two groups, presentation with tag cloud (Group A) and presentation without tag cloud (Group B), to examine the moderating effect of presentation type (H5 - H10). Table 6 presents a comparison of the results between the path coefficients. However, different presentation types would not lead to significantly different impacts between perceived usefulness, effectiveness, visual attractiveness, user satisfaction and continuance intention. We infer that the reason why the representation type is not significant is that the main effect is very substantial when evaluating a recommender system. Whether different representation types are used to determine the main effect seems to be relatively insignificant and the result of moderating effect is not apparent.
| Path | Path coefficient | t-value | Result |
|---|---|---|---|
| Perceived usefulness➔Continuance intention | 0.156 | 0.467 | Not significant |
| Perceived usefulness➔User satisfaction | -0.293 | 0.956 | Not significant |
| Effectiveness➔Perceived usefulness | -0.043 | 0.143 | Not significant |
| Effectiveness➔User satisfaction | -0.012 | 0.036 | Not significant |
| Visual attractiveness➔User satisfaction | 0.314 | 1.114 | Not significant |
| User satisfaction➔Continuance intention | -0.004 | 0.010 | Not significant |
| *Not significant if t-value < 1.64 | |||
Implications
This study proposes a research model to explain the successful adoption of recommender systems by extending post-acceptance model of information system continuance and empirically validating the relationships among the constructs in the model with experimental study. All hypotheses are supported and the visualisation effort (tag cloud) positively affects perceived usefulness, effectiveness, visual attractiveness, and user satisfaction. Implications of this study for researchers and practitioners are discussed below, together with its limitations, which point to opportunities for future research.
This study confirms the influence that perceived usefulness has on user satisfaction and continuance intention with recommender systems. Perceived usefulness is a key aspect of the user's subjective probability to use recommender systems and enhance his/her performance. This result implies that the field study on features of recommender systems from industry /users is essential to find factors in promoting recommender system success. This study also finds that effectiveness has significant influence in the perceived usefulness and user satisfaction with recommender systems. Site developers should focus on enhancing effectiveness to raise user satisfaction in recommender systems since user satisfaction is a highly influential variable for business success (Chen, 2012). This study also finds that visual attractiveness is a critical factor for user satisfaction with recommender systems. Appearance, configuration and presentation type are key aspects of recommender systems which have a significant, positive relationship with visual attractiveness. In our study, the use of tag cloud indeed has higher effectiveness. For practical suggestions, several points are addressed:
- At present, the software engineer positions in the job bank are not categorised according to different programming languages, so job-seekers can only search by manually inputting keywords. If the job bank could categorise jobs, as done in this study and provide recommendations to users, that might improve job-seekers' satisfaction with this website.
- The visual presentation of the recommender system can improve user satisfaction. Therefore, website designers should not only consider the algorithm behind the recommender system, but also visual presentation of the recommender system.
- Industries developing recommender systems should also promote these benefits to prospective adopting organizations. Researchers are encouraged to continue using continuance intention in future recommender system research since this is an important construct.
This study is limited by the laboratory setting. The external validity could be enhanced by designing an experimental setting that reflects relevant aspects of real decision tasks and by using a task that has real-world data. For example, because this laboratory experiment involves one decision aid that is designed to support an individual performing a single function, generalising the results to recommender system usage in a broader sense requires more experiments to determine the effect on different types of recommender system.
Conclusions
The research model was developed and validated through utilising the extended post-acceptance model of information system continuance adapted to the context of recommender systems. This study examined the impact that factors relevant to recommender systems have on continuance intention. Perceived usefulness, effectiveness, visual attractiveness, and user satisfaction were used to measure continuance intention. The results demonstrate that the proposed framework for the evaluation of recommender systems is established and successfully implemented. From the results of this study, we observe that in order to improve the satisfaction or continuance intention of users, it is necessary to improve the perceived usefulness, effectiveness and visual attractiveness of a site. Moreover, regardless of which indicators are considered, the visual presentation (tag cloud) is significantly better than the non-visual presentation (traditional), which indicates that the visualisation presentation of the recommender system can indeed significantly improve the user’s satisfaction and continuance intention. Therefore, good visual design is essential for end users. If we only focus on slight changes of the algorithm, users may not be able to perceive a substantial difference. However, direct improvements to the user interface may greatly enhance user willingness to continue using this recommender system.
Acknowledgements
This research has been partially supported by funds from the Taiwan Ministry of Science and Technology (MOST MOST 107-2410-H-260 -014 -MY3 ; MOST 109-2410-H-018-015-).
About the authors
Wen-Yau Liang is Professor of Information Management at National Changhua University of Education, Taiwan. His research interests are object-oriented design, artificial intelligence, intelligent agent and electronic commerce. His contact address is wyliang@cc.ncue.edu.tw
Chun-Che Huang, corresponding author, is a Professor in the Department of Information Management at National Chi Nan University, Taiwan and directs the Laboratory of Intelligent Systems and Knowledge Management. His contact address is cchuang@ncnu.edu.tw.
Tzu-Liang (Bill) Tseng is Professor of Industrial, Manufacturing and Systems Engineering at The University of Texas at El Paso. His research focuses on the computational intelligence, data mining, bio- informatics and advanced manufacturing. He has been serving as a principle investigator of many research projects, funded by the National Science Foundation, NASA, the Department of Education, and Kentucky Engineering and Science Foundation. He can be contact at btseng@utep.edu
Zih-Yan Wang received his Master degree in Information Management from the National Changhua University of Education, Taiwan. His e-mail address is az8546@hotmail.com
References
Note: A link from the title is to an open access document. A link from the DOI is to the publisher's page for the document.
- Alalwan, A. A. (2020). Mobile food ordering apps: An empirical study of the factors affecting customer e-satisfaction and continued intention to reuse. International Journal of Information Management, 50(1), 28-44. http://doi.org/10.1016/j.ijinfomgt.2019.04.008
- Al-Fraihat, D., Joy, M., & Sinclair, J. (2020). Evaluating E-learning systems success: An empirical study. Computers in Human Behavior, 102, 67-86. http://doi.org/10.1016/j.chb.2019.08.004
- Alsalemi A., Himeur, Y., Bensaali, F., Amira, A., Sardianos, C., Varlamis, I. & Dimitrakopoulos, G. (2020). Achieving domestic energy efficiency using micro-moments and intelligent recommendations. IEEE Access, 8, 15047-15055. http:// doi.org/10.1109/ACCESS.2020.2966640
- Al-Taie, M. Z. & Kadry, S. (2014). Visualization of explanations in recommender systems. Journal of Advanced Management Science, 2(2), 140-144. http://doi.org/10.12720/joams.2.2.140-144
- Apostolou, B., Bélanger, F. & Schaupp, L.C. (2017). Online communities: satisfaction and continued use intention. Information Research, 22(4), paper 774. http://informationr.net/ir/22-4/paper774.html (Archived by WebCite at http://www.webcitation.org/6vNzMX8Jq)
- Aversano, L. & Tortorella, M. (2013). Quality evaluation of floss projects: application to ERP systems. Information and Software Technology, 55(7), 1260-1276. http://doi.org/10.1016/j.infsof.2013.01.007
- Bae, M. (2018). Understanding the effect of the discrepancy between sought and obtained gratification on social networking site users' satisfaction and continuance intention. Computers in Human Behavior, 79, 137-153. http://doi.org/10.1016/j.chb.2017.10.026
- Bateman, S., Gutwin, C. & Nacenta, M. (2008). Seeing things in the clouds: the effect of visual features on tag cloud selections. In Proceedings of the 19th ACM conference on Hypertext and Hypermedia, Pittsburgh, USA, June 19-21, 2008 (pp. 193-202) Association for Computing Machinery. http://doi.org/10.1145/1379092.1379130
- Belanche, D., Casaló, L. V. & Guinalíu, M. (2012). Website usability, consumer satisfaction and the intention to use a website. The moderating effect of perceived risk. Journal of Retailing and Consumer Services, 19(1), 124-132. http://doi.org/10.1016/j.jretconser.2011.11.001
- Bhattacherjee, A. (2001). Understanding information systems continuance: an expectation-confirmation model. MIS Quarterly, 25(3), 351-370. http://doi.org/10.2307/3250921
- Boakye, K. G., McGinnis, T., Prybutok, V. R. & Paswan, A. K. (2014). Development of a service continuance model with IT service antecedents, Journal of Retailing and Consumer Services, 21(5), 717-724. http://doi.org/10.1016/j.jretconser.2014.05.004
- Boton, C., Kubicki, S. & Halin, G. (2013). Designing adapted visualization for collaborative 4D applications. Automation in Construction, 36, 152-167. http://doi.org/10.1016/j.autcon.2013.09.003
- Calli, L., Balcikanli, C., Calli, F., Cebeci, H. & Seymen, O. (2013). Identifying factors that contribute to the satisfaction of students in e-learning. Turkish Online Journal of Distance Education, 14(1), 85-101. http://doi.org/10.17718/tojde.50678
- Chen, S. C. (2012). To use or not to use: understanding the factors affecting continuance intention of mobile banking. International Journal Mobile Communications, 10(5), 490-507. http://doi.org/10.1504/IJMC.2012.048883
- Chiu, C.M., Sun, S.Y., Sun, P.C. & Ju, T.L. (2007). An empirical analysis of the antecedents of web-based learning continuance. Computers & Education, 49(4), 1224-1245. http://doi.org/10.1016/j.compedu.2006.01.010
- Cyr, D., Head, M. & Larios, H. (2010). Colour appeal in website design within and across cultures: A multi-method evaluation. International Journal of Human-Computer Studies, 68(1), 1-21. http://doi.org/10.1016/j.ijhcs.2009.08.005
- Davis, F. (1989). Perceived usefulness, perceived ease of use and user acceptance of information technology. MIS Quarterly, 13(3), 319-340. http://doi.org/10.2307/249008
- de Gemmis, M., Lops, P., Semeraro, G. & Musto, C. (2015). An investigation on the serendipity problem in recommender systems. Information Processing & Management, 51(5), 695–717. http://doi.org/10.1016/j.ipm.2015.06.008
- del Carmen Rodríguez-Hernández, M. & Ilarri, S. (2021). AI-based mobile context-aware recommender systems from an information management perspective: progress and directions. Knowledge-Based Systems, 215, 106740. http://doi.org/10.1016/j.knosys.2021.106740
- Demoulin, N. T. & Coussement, K. (2020). Acceptance of text-mining systems: The signaling role of information quality. Information & Management, 57(1), 103120. http://doi.org/10.1016/j.im.2018.10.006
- Dimara, E., Bezerianos, A. & Dragicevic, P. (2017). Conceptual and methodological issues in evaluating multidimensional visualizations for decision support. IEEE Transactions on Visualization and Computer Graphics, 24(1), 749-759. IEEE.http://doi.org/10.1109/TVCG.2017.2745138
- Eppler, M. J. & Pfister, R. (2013). Best of both worlds: hybrid knowledge visualization in police crime fighting and military operations. In S. Lindstaedt, & M. Granitzer, (Eds.), Proceedings of the 13th International Conference on Knowledge Management and Knowledge Technologies, Graz, Austria, September 4-6, 2013. (pp. 1-8). Association for Computing Machinery. http://doi.org/10.1108/JKM-11-2013-0462
- Fang, Y. H., Chiu, C. M. & Wang, E. T. G. (2011). Understanding customers’ satisfaction and repurchase intention: An integration of IS success model, trust, and justice. Internet Research, 21(4), 479-503. http://doi.org/10.1108/IntR-10-2014-0244
- Flavian, C., Guinaliu, M. & Gurrea, R. (2006). The role played by perceived usability, satisfaction, and customer trust on website loyalty. Information & Management, 43(1), 1-14. http://doi.org/10.1016/j.im.2005.01.002
- Fornell, C. & Larcker, D. F. (1981). Evaluating structural equation models with unobservable variables and measurement error. Journal of Marketing Research, 18(1), 39-50. http://doi.org/10.2307/3151312
- Gedikli, F., Ge, M. & Jannach, D. (2011). Understanding recommendations by reading the clouds. In C. Huemer, & T. Setzer, (Eds.). International Conference on Electronic Commerce and Web Technologies, Toulouse, France, August 30- September 1, 2011. (pp. 196-208). Springer. https://doi.org/10.1007/978-3-642-23014-1_17
- Gedikli, F., Jannach, D. & Ge, M. (2014). How should I explain? A comparison of different explanation types for recommender systems. International Journal of Human-Computer Studies, 72(4), 367-382. http://doi.org/10.1016/j.ijhcs.2013.12.007
- Gefen, D. & Ridings, C. M. (2003). IT acceptance: managing user – IT group boundaries. ACM SIGMIS Database, 34(3), 25–40. http://doi.org/10.1145/937742.937746
- Hadji, B. & Degoulet, P. (2016). Information system end-user satisfaction and continuance intention: A unified modeling approach. Journal of Biomedical Informatics, 61, 185–193. http://doi.org/10.1016/j.jbi.2016.03.021
- Heijden, H. V. D. (2003). Factors influencing the usage of websites: the case of a generic portal in The Netherlands. Information and Management, 40(6), 541-549. https://doi.org/10.1016/S0378-7206(02)00079-4
- Hirschman, A. (1970). Exit, voice, and loyalty: responses to decline in firms, organizations, and states. Harvard University Press. https://doi.org/10.1177/000271627139300154.
- Homburg, C., Koschate, N. & Hoyer, W.D. (2006). The Role of cognition and affect in the formation of customer satisfaction—a dynamic perspective, Journal of Marketing, 70(3), 21–31. http://doi.org/10.1509/jmkg.70.3.21"
- Hsu, M.H., Chang, C.M., Chu, K.K. & Lee, Y. J. (2014). Determinants of repurchase intention in online group-buying: the perspectives of DeLone & McLean IS success model and trust. Computers in Human Behavior, 36, 234-245 http://doi.org/10.1016/j.chb.2014.03.065
- Jasimuddin, S. M. (2012). Knowledge management: an interdisciplinary perspective. World Scientific Publishing Company. http://doi.org/10.1142/9789814271233_0011
- Kim, G.M. & Ong, S.M.(2005). An exploratory study of factors influencing m-learning, Journal of Computer Information Systems, 46(1), 92-98. http://doi.org/10.1080/08874417.2016.1164005
- Knijnenburg, B. P., Martijn C., Willemsen, M. C., Gantner, Z., Soncu, H. & Newell, C. (2012). Explaining the user experience of recommender systems. User Modeling and User-Adapted Interaction, 224-5), 441-504. http://doi.org/10.1007/s11257-011-9118-4
- Knijnenburg, B. P., Reijmer, N. J. M. & Willemsen, M. C. (2011). Each to his own: how different users call for different interaction methods in recommender systems. In Proceedings of the 2011 ACM Conference on Recommender Systems, RecSys 2011, Chicago, IL, USA, October 23-27 (pp. 141-148). Association for Computing Machinery. http://doi.org/10.1145/2043932.2043960
- Knijnenburg, B.P., Willemsen, M.C. (2009). Understanding the effect of adaptive preference elicitation methods on user satisfaction of a recommender system. In RecSys '09: Third ACM Conference on Recommender Systems, New York, NY, USA October 23 - 25, 2009 (pp. 381–384). Association for Computing Machinery. http://doi.org/10.1145/1639714.1639793
- Knijnenburg, B.P.,Willemsen, M.C. (2010). The effect of preference elicitation methods on the user experience of a recommender system. In CHI '10: CHI Conference on Human Factors in Computing Systems Atlanta, USA, April 10-15, 2010 (pp. 3457–3462). Association for Computing Machinery. http://doi.org/10.1145/1753326.1753687
- Köcher, S., Jugovac, M., Jannach, D. & Holzmüller, D. H. (2019). New hidden persuaders: an investigation of attribute-level anchoring effects of product recommendations. Journal of Retailing, 95(1), 24-41. https://doi.org/10.1016/j.jretai.2018.10.004
- Konstan, J. A. & Riedl, J. (2012). Recommender systems: from algorithms user to experience. User Modeling and User-Adapted Interaction, 22(1-2), 101-123. http://doi.org/10.1007/s11257-011-9112-x
- Ku, E.C.S. & Chen, C.D. (2013). Fitting facilities to self-service technology usage: evidence from kiosks in Taiwan airport. Journal of Air Transport Management, 32, 87-94. http://doi.org/10.1016/j.jairtraman.2013.07.001
- Lee, G. & Lee, W. J. (2009). Psychological reactance to online recommendation services, Information & Management, 46(8), 448-452. http://doi.org/10.1016/j.im.2009.07.005
- Li, C. Y. & Fang, Y. H. (2019). Predicting continuance intention toward mobile branded apps through satisfaction and attachment. Telematics and Informatics, 43, 101248. http://doi.org/10.1016/j.tele.2019.101248
- Li, G. & Song, X. (2011). A new visualization-oriented knowledge service platform. Procedia Engineering, 15, 1859-1863. http://doi.org/10.1016/j.proeng.2011.08.346
- Li, Y., Lin, L. & Lin, Y. (2014). A recommender mechanism for social knowledge navigation in an online encyclopedia. Information Processing & Management, 50(5), 634-652. http://doi.org/10.1016/j.ipm.2014.04.006
- Liaw, S. S. & Huang, H. M. (2013).Perceived satisfaction, perceived usefulness and interactive learning environments as predictors to self-regulation in e-learning environments. Computers & Education, 60(1), 14-24. http://doi.org/10.1016/j.compedu.2012.07.015
- Limayem, M. & Cheung, C. M. (2011). Predicting the continued use of Internet- based learning technologies: the role of habit. Behavior & Information Technology, 30(1), 91-99. http://doi.org/10.1080/0144929X.2010.490956
- Lin, C. P., Wang, Y. J., Tsai, Y. H. & Hsu, Y. F. (2010). Perceived job effectiveness in coopetition: A survey of virtual teams within business organizations. Computers in Human Behavior, 26(6), 1598-1606. http://doi.org/10.1016/j.chb.2010.06.007
- Liu, Y. & Jang, S. (2009). Perceptions of Chinese restaurants in the U.S. What affects customer satisfaction and behavioral intentions? International Journal of Hospitality Management, 28(3), 338-348. http://doi.org/10.1016/j.ijhm.2008.10.008
- Liu, Y., Li, H. & Hu, F. (2013). Website attributes in urging online impulse purchase. An empirical investigation on consumer perceptions. Decision Support Systems, 55(3), 829-837. http://doi.org/10.1016/j.dss.2013.04.001
- Loiacono, E. T., Watson, R. T. & Goodhue, D. L. (2007). WebQual: an instrument for consumer evaluation of web sites. International Journal of Electronic Commerce, 11(3), 51-87. http://doi.org/10.2753/JEC1086-4415110302
- Lu, C.-C. & Tseng, V. S. (2009). A novel method for personalized music recommendation. Expert Systems with Applications, 36(6), 10035-10044. http://doi.org/10.1016/j.eswa.2009.01.074
- McNaught, C. & Lam, P. (2010). Using Wordle as a supplementary research tool. The Qualitative Report, 15(3), 630-643. http://doi.org/10.1177/1077800410364740
- Meyer, R. (2010). Knowledge visualization. In D. Baur, M. Sedlmair, P. Wimmer, Y. Chen, S. Streng, S. Boring, A. De Luca, & A. Butz, A (Eds.). Trends in information visualization. An overview of current trends, development and research in information visualization. (pp. 23-30). University of Munich, Department of Computer Science. (Technical Report LMU-MI-2010-1) https://www.medien.ifi.lmu.de/pubdb/publications/pub/baur2010infovisHS/baur2010infovisHS.pdf (Archived by the Internet Archive at https://bit.ly/3AP2kzK)
- Nanou, T., Lekakos, G. & Fouskas, K. (2010). The effects of recommendations’ presentation on persuasion and satisfaction in a movie recommender system. Multimedia Systems, 16(4-5), 219–230. https://doi.org/10.1007/s00530-010-0190-0
- Nunnally, J.C. (1975). Psychometric theory - 25 years ago and now. Educational Researcher, 4(10), 7-21. https://doi.org/10.3102/0013189X004010007
- Oh, H., Jeong, M. & Baloglu, S. (2013). Tourists’ adoption of self-service technologies at resort hotels. Journal of Business Research, 66(6), 692-699. http://doi.org/10.1016/j.jbusres.2011.09.005
- Oliver, R. L. (1980). A cognitive model of the antecedents and consequences of satisfaction decisions. Journal of marketing research, 17(4), 460-469. http://doi.org/10.2307/3150499
- Oliver, R.L. (1999). Whence consumer loyalty. Journal of Marketing, 63(1), 33–44. http://doi.org/10.2307/1252099
- Ozok, A. A., Fan, Q. & Norcio, A. F. (2010). Design guidelines for effective recommender system interfaces based on a usability criteria conceptual model: results from a college student population. Behavior & Information Technology, 29(1), 57-83. http://doi.org/10.1080/01449290903004012
- Pallud, J. & Straub, D. W. (2014). Effective website design for experience-influenced environments: the case of high culture museums. Information & Management, 51(3), 359-373. http://doi.org/10.1016/j.im.2014.02.010
- Parent, M. M., MacDonald, D. & Goulet, G. (2014). The theory and practice of knowledge management and transfer: the case of the Olympic Games. Sport Management Review, 17(2), 205-218. http://doi.org/10.1016/j.smr.2013.06.002
- Park, J., Kim, J. & Koh, J. (2010). Determinants of continuous usage intention in web analytics services. Electronic Commerce Research and Applications, 9(1), 61-72. http://doi.org/10.1016/j.elerap.2009.08.007
- Parra, D. (2012). Beyond Lists: Studying the Effect of Different Recommendation Visualizations. In RecSys '12: Sixth ACM Conference on Recommender Systems, Dublin, Ireland, September 9-13, 2012. (pp. 333-336). Association for Computing Machinery. http://doi.org/10.1145/2365952.2366035
- Portugal, I., Alencar, P. & Cowan, D. (2017). The use of machine learning algorithms in recommender systems: a systematic review. Expert Systems with Applications, 97, 205–227. http://dx.doi.org/10.1016/j.eswa.2017.12.020
- Premkumar, G. & Bhattacherjee, A. (2008). Explaining information technology usage: a test of competing models. Omega, 36(1), 64-75. http://doi.org/10.1016/j.omega.2005.12.002
- Pu, P., Chen, L. & Hu, R. (2011). A user-centric evaluation framework for recommender systems. In RecSys '11: Fifth ACM Conference on Recommender Systems, Chicago, USA, October 23-27, 2011. (pp. 157-164). Association for Computing Machinery. http://doi.org/10.1145/2043932.2043962
- Qiu, L. & Benbasat, I. (2010). A study of demographic embodiments of product recommendation agents in electronic commerce. International Journal of Human-Computer Studies, 68(10), 669-688. http://doi.org/10.1016/j.ijhcs.2010.05.005
- Ramírez-Correa, P. E., Rondan-Cataluña, F. J., Arenas-Gaitán, J. & Alfaro-Perez, J. L. (2016). Moderating effect of learning styles on a learning management system’s success. Telematics and Informatics, 34(1), 272–286. http://doi.org/10.1016/j.tele.2016.04.006
- Reji, K. G. & Ravindran, D. S. (2012). An empirical study on service quality perceptions and continuance intention in mobile banking context in India. Journal of Internet Banking & Commerce, 17(1), 1-22. http://doi.org/10.4172/1204-5357.1000130
- Rivadeneira, A. W., Gruen, D. M., Muller, M. J. & Millen, D. R. (2007). Getting our head in the clouds: toward evaluation studies of tagclouds. In Proceedings of the SIGCHI Conference on Human Factors in Computing Systems, San Jose, USA, April 28- May 3, 2007. (pp. 995-998). Association for Computing Machinery. http://doi.org/10.1145/1240624.1240775
- Romero, M., Moreo, A. & Castro, J. L. (2013). A cloud of FAQ: a highly-precise FAQ retrieval system for the Web 2.0. Knowledge-Based Systems, 49, 81-96. http://doi.org/10.1016/j.knosys.2013.04.019
- Roscoe, J. T. (2004). Fundamental research statistics for the behavioral sciences. (2nd. ed.). Thomson Wadsworth.
- Rouse, W. B. (2002). Need to know-information, knowledge, and decision making. IEEE Transactions on Systems, Man, and Cybernetics, Part C: Applications and Reviews, 32(4), 282–292. http://doi.org/10.1109/TSMCC.2002.806785
- Saket, B., Endert, A. & Demiralp, Ç. (2018). Task-based effectiveness of basic visualizations. IEEE Transactions on Visualization and Computer Graphics, 25(7), 2505-2512. http://doi.org/10.1109/TVCG.2018.2829750
- Shaikh, A. A. & Karjaluoto, H. (2015). Making the most of information technology & systems usage: a literature review, framework and future research agenda. Computers in Human Behavior, 49, 541-566. http://doi.org/10.1016/j.chb.2015.03.059
- Shinde, S. K. & Kulkarni, U. (2012). Hybrid personalized recommender system using centering-bunching based clustering algorithm. Expert Systems with Applications, 39(1), 1381-1387. http://doi.org/10.1016/j.eswa.2011.08.020
- Sindiy, O., Litomisky, K., Davidoff, S. & Dekens, F. (2013). Introduction to information visualization (InfoVis) techniques for model-based systems engineering. Procedia Computer Science, 16, 49-58. https://doi.org/10.1016/j.procs.2013.01.006
- Stefanovic, D., Marjanovic, U., Delic´, M., Culibrk, D. & Lalic, B. (2016). Assessing the success of e-government systems: an employee perspective. Information & Management, 53(6), 717-726. http://doi.org/10.1016/j.im.2016.02.007
- Stone, R. W. & Baker-Eveleth, L. (2013). Students’ expectation, confirmation, and continuance intention to use electronic textbooks. Computers in Human Behavior, 29(3), 984-990. http://doi.org/10.1016/j.chb.2012.12.007
- Tintarev, N. & Masthoff, J. (2012). Evaluating the effectiveness of explanations for recommender systems. User Modeling and User-Adapted Interaction, 22(4-5), 399-439. https://doi.org/10.1007/s11257-011-9117-5
- Torres-Parejo, U., Campaña, J. R., Delgado, M. & Vila, M. A. (2013). MTCIR: A multi-term tag cloud information retrieval system. Expert Systems with Applications, 40(14), 5448-5455. http://doi.org/10.1016/j.eswa.2013.04.010
- Verbert, K., Parra, D., Brusilovsky, P. & Duval, E. (2013). Visualizing Recommendations to Support Exploration, Transparency and Controllability. In IUI '13: Proceedings of the 2013 International Conference on Intelligent User Interfaces, Santa Monica, USA, March 19- 22, 2013. (pp. 351-362). Association for Computing Machinery. http://doi.org/10.1145/2449396.2449442
- Walhout, J. Brand-Gruwel, S., Jarodzka, H., Dijk, M. V. & Groot, R. D. (2015). Learning and navigating in hypertext: navigational support by hierarchical menu or tag cloud? Computers in Human Behavior, 46, 218-227. https://doi.org/10.1016/j.chb.2015.01.025
- Wang, W., Zhang, G. & Lu, J. (2017). Hierarchy visualization for group recommender systems. IEEE Transactions on Systems, Man, and Cybernetics: Systems, 49(6), 1152-1163. https://doi.org/10.1109/TSMC.2017.2699690
- Wang, Y. S. & Liao, Y. W. (2008). Assessing eGovernment systems success: a validation of the DeLone and McLean model of information systems success. Government Information Quarterly, 25(4), 717-733. http://doi.org/10.1016/j.giq.2007.06.002
- Wongsuphasawat, K., Moritz, D., Anand, A., Mackinlay, J., Howe, B. & Heer, J. (2015). Voyager: Exploratory analysis via faceted browsing of visualization recommendations. IEEE Transactions on Visualization and Computer Graphics, 22(1), 649-658. http://doi.org/10.1109/TVCG.2015.2467191
- Xiao, B. & Benbasat, I. (2018). An empirical examination of the influence of biased personalized product recommendations on consumers' decision making outcomes. Decision Support Systems, 110, 46-57. https://doi.org/10.1016/j.dss.2018.03.005
- Xu, J. (2014). The nature and consequences of trade-off transparency in the context of recommendation agents. MIS Quarterly, 38(2), 379-406. https://doi.org/10.25300/MISQ/2014/38.2.03
- Yoon, J. & Chung, E. (2016). Image use in social network communication: a case study of tweets on the Boston marathon bombing. Information Research, 21(1), paper 708. http://informationr.net/ir/21-1/paper708.html (Archived by WebCite at http://www.webcitation.org/6frHtnziA)
- You, J. J., Jong, D. & Wiangin, U. (2020). Consumers’ purchase intention of organic food via social media: the perspectives of task-technology fit and post-acceptance model. Frontiers in Psychology, 11, paper 579274. https://doi.org/10.3389/fpsyg.2020.579274
- Zhao, X., Mattila, A.S. & Tao, L.S.E. (2008). The role of post-training self-efficacy in customers’ use of self service technologies. International Journal of Service Industry Management, 19(4), 492-505. http://doi.org/10.1108/09564230810891923
- Zheng, Y.M., Zhao K. & Stylianou A. (2013). The impacts of information quality and system quality on users’ continuance intention in information-exchange virtual communities: an empirical investigation. Decision Support Systems, 56, 513-524. http://doi.org/10.1016/j.dss.2012.11.008.