Effectively organizing hashtags on Instagram: a study of library-related captions
Ming Zhan, Qin Yu, and Ji Wang
Introduction. Little scientific attention has been paid to outlining the communicating function of hashtags on Instagram. The present study aims to fill this gap by analysing hashtag organization. Practical insights into user engagement, community building, and big data utilisation in the context of libraries are discussed.
Method. To achieve a valid result, 2.5 million captions on Instagram with library-related content were collected.
Analysis. Quantitative analyses were carried out with the statistical add-in packages in Python 3.0.
Results. For captions with one hashtag included, putting it in the middle results in more likes and comments; for captions composed of more than 80% of hashtags, it is advisable to use more words than having a caption full of hashtags; for captions composed of less than 80% of hashtags, placing all hashtags consecutively at the beginning is not recommended as this is more likely to result in zero comments.
Conclusion. It is concluded that placing hashtag(s) in the front of the caption should be avoided; it is not wise to use as many hashtags as possible. More effort should be made to better organize hashtags in captions because their location has an influence on attracting comments and likes.
Introduction
Instagram is a mobile application (for the Apple iOS and Android operating systems) that enables users to create appealing images from their mobile phone photos and to conveniently share these images with others on their social networks (Salomon, 2013). The basic idea behind Instagram is to ‘share photographs and videos by using a hashtag (#) so that other users can find the photographs’ (Sheldon and Bryant, 2016, p. 89). This indicates the significance of hashtag utilisation on Instagram. Hashtags, which are keywords prefixed by the symbol # (Ma et al., 2013), are widely used on social media. The first hashtag on social media was officially used in 2007 on Twitter (Sailer, 2016). Since then, the use of hashtags has evolved into an Internet language revolution (Lee, 2016), demonstrating the proliferation of hashtags on the Web. The functions of hashtags can be classified into two: to bookmark the content of captions (Burgess et al., 2015; Giannoulakis and Tsapatsoulis, 2015; Ma et al., 2013) and to communicate within a community focusing on the same topic (Burgess et al., 2015; Small, 2011). Based on the study by Giannoulakis and Tsapatsoulis (2015), 55% of hashtags used on Instagram describe the content of images, which means that nearly half of hashtags in Instagram captions should realise the other function: communication.
The evolution of social media has gone from text-intensive services, to message-based services (e.g., Twitter), to networking services (e.g., Facebook), to image-based services (Stuart et al., 2017), in which Instagram plays an important role. Nowadays, there is an increasing emphasis on Instagram in librarianship (Salomon, 2013; Tekulve and Kelly, 2013). An increasing number of libraries are using Instagram for event marketing and patron communication (Hopkins et al., 2015). As suggested by Salomon (2013), Instagram is an effective platform for libraries to engage with their users because it connects young and diverse people. Therefore, this study investigates how libraries would benefit from employing Instagram to communicate with their users.
Furthermore, the utility of social media in the library context corresponds to the development of technologies that focus on ‘communication, content sharing, social networking and crowd-sourcing’ (Carlsson, 2012, p. 200), as reflected in several studies within the field of library and information science (e.g., Abidin et al., 2013; Hussain, 2015; Kaul, 2016; Kaushik, 2016; Keloglu-Isler and Bayram, 2014; Mon and Lee, 2015; van Zyl, 2009; Vassilakaki and Garoufallou, 2015). Libraries use social media to extend services beyond the desk, facilitate information discovery and access, and promote their activities (Abidin et al., 2013; Hall, 2011). The application of interactive technologies to library services has caused a demand for new abilities in the context of social media (Huvila et al., 2013), given the significant relationship between social media and library users as shown in the study by Sin and Kwon (2017). In other words, social media have boosted the use of libraries. One of the benefits social media have brought to libraries is the improvement of communication between them and their patrons (Abdullah et al., 2015). Nevertheless, few studies have focused on advising communicating with users through social media, which motivated the current study to fill the research gap and put forward practical guidelines on the topic. According to the study by Zhang et al. (2018), a better utilisation of hashtags on Twitter could be helpful for developing, engaging, retaining, and sustaining user communities on that medium. The present study widens the scope to another platform: Instagram. After demonstrating the usage of Instagram in Indonesian academic libraries, Rachman et al. (2018, p. 27) recommend that libraries ‘take the opportunity of engaging users by communicating actively’ on Instagram. Thus, the present research focuses on improving our understanding of the communication function of hashtags on Instagram in the context of libraries.
There is an increasing understanding of the practical significance of social media utilisation for libraries (Hussain, 2015; Huvila et al., 2013; Kaul, 2016; Kaushik, 2016; Vassilakaki and Garoufallou, 2014, 2015). According to Angiemsolis (2012), there is an opportunity for libraries to participate in a network that shares information in an artistic and fun format—Instagram. Through photo-sharing, communication can be established between the library and their patrons (Abbott et al., 2014). This highlights the significance of Instagram for libraries due to its photo-sharing nature. Establishing communication with their users is important for libraries to encourage user engagement. According to Abbott et al., the number of likes for images on Instagram is a major way for libraries to measure user engagement. Angiemsolis (2012) points out that institutions apply hashtags to their content to encourage photo-sharing, thus boosting engagement with their users. Thus, the communication function of hashtags on Instagram has a practical significance for libraries.
According to the basic idea behind Instagram and the two main functions of hashtags, Instagram users employ hashtags to mark their photos and gather attention from other users. This study asks whether, besides the content of the post, there are other factors, such as the organization of hashtags in the caption, influencing hashtags’ communication function. If so, librarians could strategically use hashtags to attract more attention, thus improving libraries’ communication with their users. A study on how to use hashtags for communication purposes is therefore relevant for libraries. The current research focuses on hashtag organization as one of the applications of hashtags, which refers to how and where to use hashtags in captions. On Instagram, communication success is reflected on the number of likes and comments a post attains. The more likes and comments a post gathers, the better communication is established by the post. Thus, the main research question of this study is:
How should hashtags be organized to increase likes and comments on library-related Instagram posts?
To the best of our knowledge, this study is the first to outline the importance of hashtag organization for libraries to realise the communication function of hashtags on Instagram. This distinguishes our study from existing ones that discuss the usage of hashtags from the perspective of information diffusion and the amount of hashtags used. Since hashtags are used only in the captions of posts on Instagram, captions are the data source of this study. More than 6.9 million Instagram captions were collected for analysis. Such a large dataset will allow us to provide a valid answer to the research question. The organization of hashtags in each caption was identified by their location, and the correlation between such location and the number of likes and comments gathered by the post was analysed.
Literature review
Hashtags, defined as words, phrases, or alphanumeric characters preceded by the symbol # (Dumbrell and Steele, 2015; Fink et al., 2016; Gotti et al., 2014), were first generated in the communication between the application IRC (Internet Relay Chat) and its users (Giannoulakis and Tsapatsoulis, 2015), and later were widely used on social media. Zappavigna (2015) summarises three purposes of hashtag utilisation: first, to indicate the semantic domain of the post; second, to relate the post to a certain collective practice—both of which correspond to the content feature of hashtags (Ma et al., 2013); and third, to express an emotionally charged metacomment (Burgess et al., 2015; Small, 2011). For the purposes of this study, hashtags represent words or phrases preceded by # indicating the semantic domain of the post.
On social media, the use of hashtags can increase the audience beyond one’s own followers (Small, 2011; Zappavigna, 2015) due to their high searchability (Dwyer and Marsh, 2014; Stathopoulou et al., 2017). Some studies (e.g., Hawkins and Silver, 2017; Kamil et al., 2016; Stefanone et al., 2015; Swab and Romme, 2016) have used hashtags to reach a certain audience and collect corresponding data. Furthermore, hashtags can describe posts related to one’s feelings and personal experiences (Hamed and Wu, 2014; Rich et al., 2016). Daer et al. (2014) applied an iterative analysis framework to 500 social media posts and summarised five rhetorical functions of hashtags: emphasising (to call attention), critiquing (to express judgement or verdict), identifying (to point to the post’s author or to some reflective contents), iterating (to express humour), and rallying (to bring awareness or support to a campaign). Considering these benefits of employing hashtags, studies have been conducted to further discuss their rational utilisation on social media.
Hashtags can be considered as valuable resources to understand concepts and human beings. Dwyer and Marsh (2014) have looked into the concept of trust through a hashtag use point of view. They collected and analysed data from Twitter using the hashtag trust (#trust). Eventually, a trust-enabling interface was realised. In a similar way, Siapera (2014) approached Palestine using Twitter data and concluded that people who tweeted #Palestine were more active in spreading and commenting on issues in Palestine in real time. Chae (2015) realised that people who tweeted #supplychain were more information-focused and conventional, and Gibbs et al. (2015) explained individual behaviour concerning funerals by analysing Instagram captions with the hashtag #funeral. These studies used hashtags to identify certain topics and categorise individuals. Patterns related to a concept or a community of people are shown through analysing corresponding hashtags.
Furthermore, in-depth insights can be gained by analysing hashtags related to a certain field. Pinho-Costa et al. (2016) created an index of healthcare hashtags taking into account data from Hashtag Global Reach, Topic-Specific Hashtag Global Reach, and Individual Global Reach, all of which are rankings of hashtags computed with different perspectives. [Author query: are there links for these rankings? If so, could you include them please?] Such indexes could be helpful for publishing and decision making within the field of healthcare. With a bottom-up approach to analysing food-related hashtags on Instagram, Rich et al. (2016) highlight hashtags that are more likely to relate to food images. Such hashtags could be helpful for healthcare researchers to calculate calories and study diet habits in contemporary societies.
Even though advances have been made in the study of hashtags, this field is disproportionately distributed. Most studies have been conducted in the domains of governmental research, public administration, risk management, communication, and business administration. There is no study focusing on understanding hashtags specifically in the context of libraries. Additionally, the data source analysed in previous studies has been mostly Twitter. This can be attributed to the fact that Twitter’s data (tweets, user profile, user location, number of retweets, etc.) can be considered more open for collection (Chae, 2015). This points to the necessity of studying hashtags on other social platforms, such as Instagram. While outlining the descriptive value of Instagram hashtags, Giannoulakis and Tsapatsoulis (2015) posit that librarians are ideal to understand hashtags since they are familiar with social media and are responsible for annotating electronic resources as part of their jobs. Therefore, the present study focuses on hashtag usage on Instagram in the context of libraries.
By wisely using hashtags, a better comprehension of diverse topics can be attained. Nevertheless, current studies concerning how to effectively use hashtags on Instagram have been mainly conducted from three perspectives: the number of hashtags, the engagement of hashtags, and the contextual meaning of hashtags.
Cooper (2016) and Lee (2016) outlined the best number of hashtags on Twitter and Instagram. Cooper suggests that one or two hashtags in a tweet could generate 21% more engagement than adding three or more of them. Lee, on the other hand, highlights that interaction numbers on Instagram are highest when captions contain more than eleven hashtags.
According to Harkai (2018), engagement is the key word to Instagram. As such, the news feed is no longer chronologically listed, it is presented based on the relation with other accounts. Therefore, strategically using hashtags to engage others is advised. Oh et al. (2016) identified that retagging, which allows users to add new meanings to a hashtag, is specific to Instagram. Retagging has substantial potential to broaden communities. Therefore, users are advised to diversely interpret and represent hashtags in their own way to better interact with others.
Bunskoek (2014) insists that it is necessary to make hashtags short, unique, and outstanding in Instagram captions from a marketing point of view. However, it is more important to consider the contextual meaning of the hashtag. The meaning should be relevant to products, services, or marketing campaigns. Harkai (2018) also advises users to assess the relevance of hashtags to the content when using them on Instagram.
However, there are no studies recommending strategies for hashtag organization to boost communication on Instagram. Furini et al. (2017) observed that the smart application of hashtags may generate interest around art exhibitions. Nonetheless, how to use these hashtags is unclear. Highfield and Leaver (2015) state that there is a need for more quantitive and qualitative methods to study hashtags, which are the initial point for studying activity on Instagram. Therefore, the present study concentrates on exploring the best way to organize hashtags in Instagram captions to boost communication through a quantitative method.
Data collection
Instagram is the fastest growing social media worldwide (Duggan et al., 2015). According to its latest announcement, the number of Instagram users has grown to more than 700 million. Furthermore, the most recent 100 million users have joined faster than ever (Instagram, 2017). This justifies the use of Instagram as data source in the present study. Data collection officially started at 0:00 on April 22, 2017 and ended at 23:59 on August 31, 2017 (time zone: Central European Summer Time). There were four considerations for data collection:
- Privacy protection. Ethical guidelines for this study require the utilisation of data without invading users’ privacy. Therefore, sensitive information such as demographic and geographic information was not collected.
- Public accessibility. Data must be accessible by anyone, especially by libraries so they can use the analysis presented in this study.
- Content consistency. Captions with library-related hashtags were used to collect data. First, #library was decided as the core hashtag, laying the foundation to choose other relevant hashtags. The selection of relevant hashtags was made by two means: consulting with professionals and calculating hashtags’ co-occurrence frequency with #library. After consulting with professionals (scholars in the library and information science field and university librarians), #book, #books, #read, and #reading were selected as library-related hashtags. Moreover, a test database was created with 13,239 captions including #library. The top twenty hashtags co-occurring with #library are listed in Table 1. As shown in Table 1, the hashtags recommended by the consulted professionals are among the top five of the list, which validates the professionals’ recommendation. The final hashtags used to collect data were selected from this list.
- Number of captions. The number of captions using #library was three million. The other relevant hashtags had to appear in more than three million captions so as to enrich the content. After consulting a computing engineer, five million was decided as the threshold to choose the final hashtags.
After considering the aforementioned criteria and the limited resources available to conduct this study, a web crawling program was created with PHP programming language to automatically collect public content on Instagram. Public contents can be reached without owning an Instagram account. The hashtags #book, #reading, #read, and #bookstagram together with #library were chosen as data collection hashtags. MySQL was employed to store collected data. Post ID, post time, number of likes, number of comments, and captions were collected. Moreover, the same caption could be collected more than once. Thus, the program would update the number of comments and number of likes accordingly. For this reason, another column was created to record the updated time. In the end, 6,927,427 captions were stored.
| Hashtag | Frequency |
|---|---|
| #books | 4,894 |
| #book | 4,367 |
| #reading | 4,171 |
| #bookworm | 2,596 |
| #read | 2,583 |
| #Instagood | 2,935 |
| #author | 2,884 |
| #literature | 2,770 |
| #love | 2,762 |
| #reader | 2,723 |
| #pages | 2,609 |
| #page | 2,608 |
| #story | 2,505 |
| #bestoftheday | 2,488 |
| #readinglist | 2,480 |
| #photooftheday | 2,480 |
| #paper | 2,374 |
| #bookstagram | 2,292 |
| #kindle | 2,204 |
| #imagine | 2,148 |
To ensure data quality, only captions in English with at least one of the five data collection hashtags were selected. Duplicated captions were removed from the dataset. After data cleaning, 2,561,424 pieces of data were saved for further analysis. A sample of the database is displayed in Table 2.
| Post ID | Post time | No. of comments | No. of likes | Caption | No. of hashtags | Updated time |
|---|---|---|---|---|---|---|
| 14981985 09****19723 | 4/22/17 0:00 | 12 | 237 | Tag a person who you think might wanna play with your balls!!? Do You Want To Play With My Balls - $14.95?. #weirds**tyoucanbuy #weirds**t #weird #book #booklover #bookclub #balls #ball #kids #forkids #funny #hilarious #lol #hi #lmao #lmfao #reading #reader #readers #literature #tagafriend | 20 | 4/25/17 21:07 |
| 15523673 66****43592 | 7/5/17 17:43 | 0 | 41 | There’s a good thing about the freedom of choice…#freedomofchoice #choice #bliss #positivity #bookstagram #instawriterscommunity #ilovesories #instawriterssociety #writersofinstagram #writersoninstagram #writers #ilovetowrite #lovetowrite #shewrites #loversofpoetry #wordporn #wordgasm #poemporns #spilledink #spilledinkpoetry #spilledinkcomp #wordsofwisdom #words #wordlover #wordlove #wordsmatter | 30 | 7/7/17 7:54 |
Data analysis
The main purpose of this study was to effectively organize hashtags to gain more comments and likes. Hashtag organization is reflected by where and how to put hashtags in the caption, thus the location of hashtags in captions was identified. The correlation between the hashtag location and the number of comments, and likes in each post was then interpreted. The data analysis process consisted of three steps: identifying hashtag location, generating the statistical description, and identifying patterns.
Hashtag location identification
The method to identify hashtag location—the general location of all hashtags in a caption—was developed based on the study by Gotti et al. (2014). In the present study, hashtag location is a variable to describe the average distribution of hashtags in a caption rather than the location of every single hashtag in it. The calculation of hashtag location is based on hashtag percentage in a caption and the distribution of hashtags through computing the standard deviation and the median of the index of each hashtag in a caption. Hashtag percentage—how much hashtags account for in one caption is calculated as follows (the abbreviations are used in Figure 2):
No. of hashtags / No. of words × 100%
Number of hashtags refers to how many hashtags a caption contains and word count refers to how many words in total the caption contains, including hashtags and normal words. Both of them were computed through the regular expression method, which extracts all words and hashtags in a caption according to appearance order. The hashtag index was calculated as follows: if a caption contains ten words and the hashtags are the third, sixth, and ninth word, an array will be used to describe such situation: (3, 6, 9). Each number in the array is the index of each hashtag. In addition, the standard deviation and the median of each index array were calculated. The smaller the deviation, the more centralised the hashtags were in the caption. The larger the median value, the closer the hashtags were to the end of the caption. The conditions to identify hashtag locations were as follows.
First, hashtag location is defined based on whether the number of hashtags in a caption is equal to 1. If it is 1, there are three location types: only in the front (OF), only in the middle (OM), and only at the end (OE). If the hashtag is located within the first third of the caption’s word count, it is in the front. If the hashtag is located within the last third of the caption’s word count, it is at the end. All other locations are considered to be in the middle (see Figure 1).
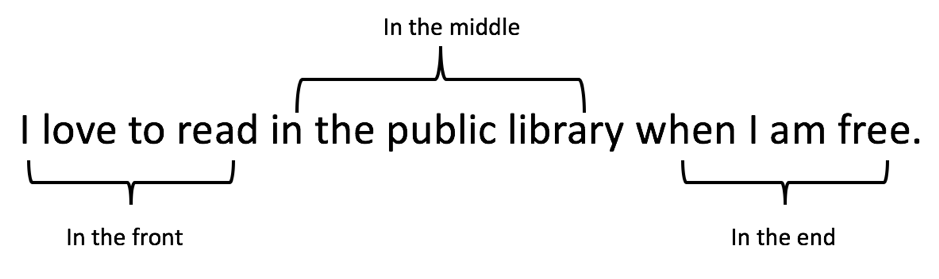
Figure 1: Ways to split captions
When a caption has more than one hashtag, there are other means to identify hashtag location. First, if the hashtag percentage of a caption is no less than 95%, hashtag location is defined as all hashtags (AH). The reason for selecting 95% rather than 100% is that, when using Python to split the sentence into words and to count the amount of words, punctuation symbols are included in the count. To avoid counting in punctuation symbols, 95% is chosen as the threshold ratio to classify location as all hashtags. Secondly, if the hashtag percentage of a caption is between 80% and 95%, location is defined as most hashtags (MH). For captions with hashtag percentage below 80%, if hashtags are listed consecutively in the caption, there are three location classifications: all at the beginning (starting with a hashtag; AB), all at the end (ending with a hashtag; AE), and all in the middle (AM). To identify whether the hashtags are listed consecutively, it is necessary to calculate the maximum hashtag index minus the minimum hashtag index. If the result is equal to the number of hashtags − 1, it can be concluded that the hashtags listed in the caption are consecutive. If a caption has hashtags not consecutively listed, the standard deviation, median, and whether the caption starts or ends with a hashtag are considered to define the location. If a caption starts or ends with a hashtag while hashtags are not listed consecutively, then its median and standard deviation are considered to define the location. If the median is greater than two thirds of the word count, the location is defined as beginning and centralised at the end (BCE), which means that even though the caption starts with a hashtag, most hashtags are listed at the end. For example:
#I love to read in the #public #library #when #I #am #free.
If the median is not greater than two thirds of the word count, then the location is labeled as scattered (S). For example:
#I #love to read in the #public #library when I #am #free.
When a caption starts with a hashtag but does not end with one, if the standard deviation is lower than 0.3, the location is defined as beginning and centralised in the front (BCF). For example:
#I #love to #read #in #the public library when I am free.
On the same condition and the standard deviation being no lower than 0.3, the location is defined as scattered but not at the end (S not E). For example:
#I love #to read #in the #public library when I am free.
If a caption has no consecutively listed hashtags and it does not start with a hashtag, then whether median is greater than two thirds of the word count is considered. If it is, then the location is labelled as more at the end (ME). For example:
I love to read #in the #public #library #when #I #am #free.
If the standard deviation is not above 0.3, then the location is fewer in the front (LF). For example:
I love to read #in #the #public library #when #I #am free.
All others cases are considered scattered but not in the front (S not F). For example:
I love to read #in #the public #library when I am #free.
In the end, fifteen types of locations were identified. Of note, if a caption does not start with a hashtag, whether it ends with one or not is not specified in this study. The reason is that if the median is greater than two thirds of the word count, it does not matter if the caption ends with a hashtag or not, the hashtag location is still considered as more at the end. Even if it ends with a hashtag, if the median is not greater than two thirds of the word count and and the standard deviation is not greater than 0.3, the hashtags are still less in the front. Thus, as mentioned, when a caption does not start with a hashtag, whether it ends with one or not, is not discussed in this study. The whole location computing process is summarised in Figure 2.
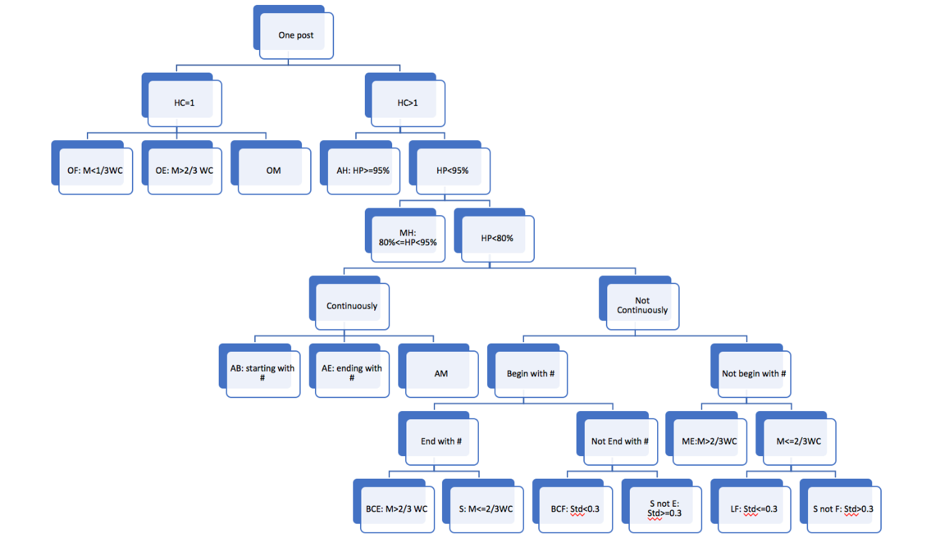
Figure 2: Location computing chart
Statistical description
The statistical description includes the mean, standard deviation (StD), mode, minimum, and maximum, and the percentile in 25th, 50th (median), and 75th of all variables, which are the number of hashtags, words, comments, and likes in each caption and the time difference between the time when the number of comments and likes of a caption was finally updated in the database and the time when the caption was created on Instagram. Time difference was measured by hours, as shown in Table 3.
| Measure | No. of hashtags in a caption | No. of words in a caption | No. of comments | No. of likes | Time difference |
|---|---|---|---|---|---|
| Mean | 16 | 46 | 2 | 70 | 58.97 |
| StD | 8.71 | 45.03 | 15.34 | 626.58 | 66.10 |
| Mode | 29 | 30 | 0 | 14 | |
| Minimum | 1 | 2 | 0 | 0 | 2 |
| 25% | 8 | 20 | 0 | 17 | 21.22 |
| 50% | 15 | 32 | 1 | 30 | 37.74 |
| 75% | 23 | 53 | 2 | 54 | 68.72 |
| Max | 248 | 445 | 12,648 | 736,842 | 429.83 |
Based on the results shown in Table 3, it can be concluded that most captions contain fewer than 23 hashtags and fewer than 100 words. Most captions were finally updated within three days. The number of likes in each post fluctuated highly, which is reflected in its high standard deviation.
In addition, both the 25th percentile and the mode of the number of comments were zero. To be precise, 1,269,624 captions had no comments. The distribution of comment count is illustrated in Figure 3.
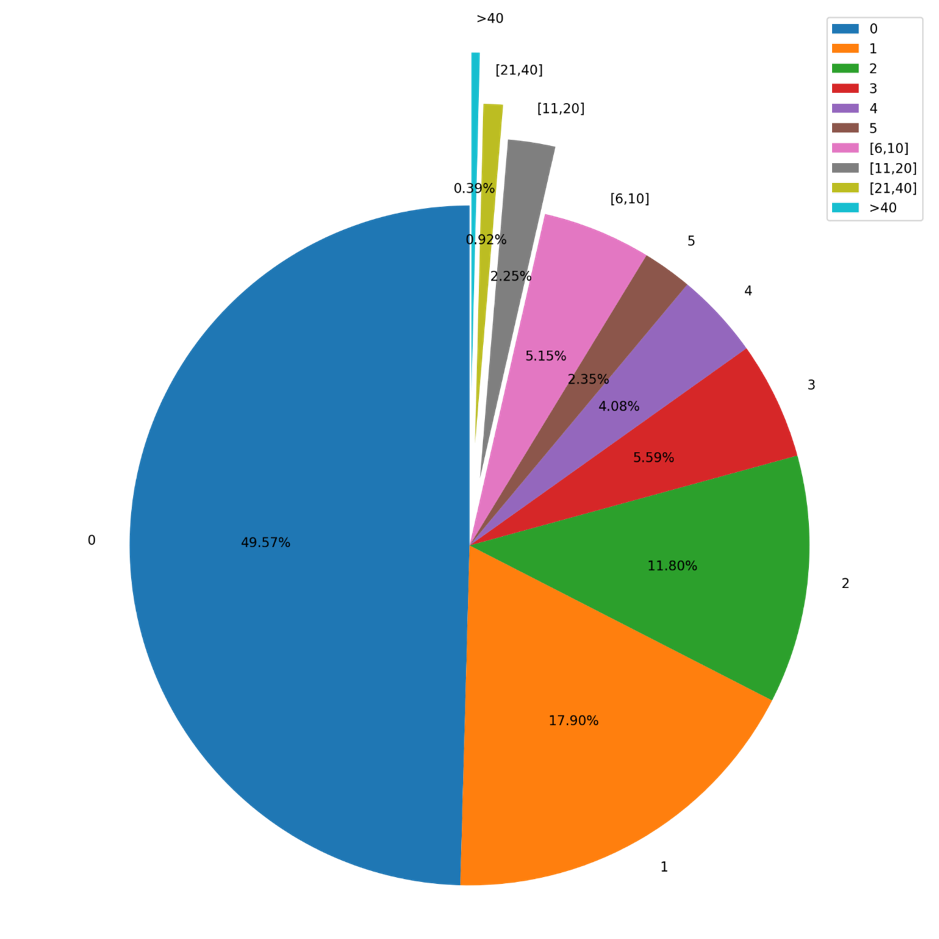
Figure 3. Pie chart of number of comments
As illustrated in Figure 3, almost half of the collected captions contained no comments. Nearly 80% of the captions had fewer than three comments. Moreover, the number of captions with no likes was 4,072, and the number of captions with fewer than three likes was 24,559. That is, only 1% of the captions obtained fewer than three likes. This implies that, compared with commenting, people tend to like captions more.
Overall, more than 40 million hashtags we used in the collected captions. The top ten hashtags are listed in Table 4.
| Hashtag | Frequency |
|---|---|
| #bookstagram | 1,197,523 |
| #book | 982,304 |
| #reading | 870,256 |
| #books | 770,062 |
| #bookworm | 530,572 |
| #read | 435,619 |
| #booklover | 374,472 |
| #bibliophile | 315,384 |
| #bookish | 307,977 |
| #booknerd | 279,004 |
It can be concluded that the top ten hashtags are related to books. Among them, four hashtags related to people who are crazy about books (#bookworm, #booklover, #bibliophile, and #booknerd) are frequently used in library-related captions. The number of captions per hashtag location is presented in Figure 4.
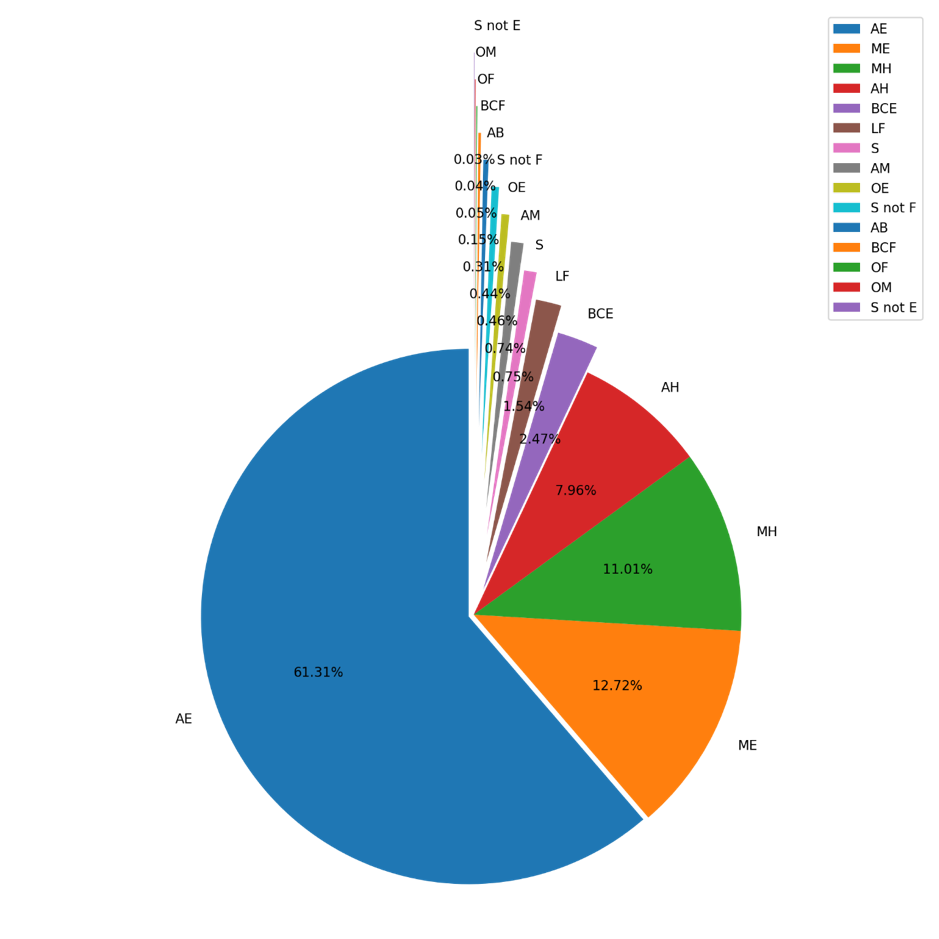
Figure 4: Number of captions per hashtag location.
As shown in Figure 4, the number of captions per hashtag location is disproportionally distributed. When there is only one hashtag in a caption, the hashtag tend to be placed at the end (11,904) rather than in the front (1,407) or middle (1,086) of the caption. For captions with more than one hashtag, 1,570,430 of them (accounting for 61.31% of all the captions) had all hashtags consecutively listed at the end. More at the end was the second most frequent hashtag location (325,861); thus, it can be concluded that no matter how many hashtags are used, library-related captions tend to place them at the end.
Data analysis results
Since the research question of this study focus on how to effectively organize hashtags to attain comments and likes, the number of comments and likes gathered is considered a measure to evaluate how well different hashtag locations work. Regression algorithms were employed to help answering the research question. Besides hashtag locations, the variables, number of hashtags, word count and time difference were also included in the model.
When identifying hashtag location, the number of hashtags and each caption’s hashtag percentage were considered. Therefore, regression models were established in three conditions: the number of hashtags equals 1; the number of hashtags is more than 1 while the hashtag percentage (HG_per) is no less than 80%; and the number of hashtags is more than 1 while the hashtag percentage is less than 80%. In this way, multicollinearity between the number of hashtags and the word count could be avoided to generate a valid model.
The dependent variables in the regression model are the number of comments and the number of likes, both of which are ordinal discrete variables. According to D. Dranove (personal communication, 2009), the distribution of dependent variables should be considered when selecting the preferred regression algorithms. The distributions of the number of likes and comments in each condition are illustrated in Figures 1, 2 and 3 in the Appendix.
As depicted in Figures 1, 2 and 3 of the Appendix, the distribution of the number of comments in each condition has a long right tail, and nearly half of the captions have no comments. Such characteristics make Poisson regression a suitable choice (D. Dranove, personal communication, 2009; Famoye and Singh, 2006). According to Famoye and Singh, the presence of excess zero observations and long right tails is relevant to the Poisson assumption, therefore, the application of a Poisson regression model could improve the fit of the data.
As for the number of likes, even though the distribution in each condition is skewed to the right, the zero observations do not count much. Therefore, Poisson regression does not work in this case. After checking the prerequisites of chi-square tests and linear regressions, it was concluded that the number of likes did not meet any of them. According to a study by Scott and Holt (1982), social studies use cluster or multistage sampling for economic reasons, which complicates the modification of the data. Thus, ordinary least squares regression models could be beneficial because their parameter estimates are not seriously affected when data are subject to intra-cluster correlation. Since the variance of the number of likes under different locations is explored, each location could be one cluster. Therefore, ordinary least squares regression was applied.
Before regression, outliers of the numbers of comments and likes were deleted. In this study, a value greater than the 98th percentile of the number of likes and comments was considered an outlier and deleted.
The regression models in each condition with number of comments as the dependent variable are presented in Table 5.
| One hashtag | More than one hashtag | |||||||
|---|---|---|---|---|---|---|---|---|
| Hashtag percentage greater than 80% | Hashtag percentage less than 80% | |||||||
| Variable | Coef | p_value | Variable | Coef | p_value | Variable | Coef | p_value |
| Intercept | −0.4230 | 0.0000 | Intercept | −0.6136 | 0.0000 | Intercept | −0.6289 | 0.0000 |
| Only in front | 0.1329 | 0.1250 | Most hashtags | 0.1877 | 0.0000 | All at end | 0.2014 | 0.0060 |
| Only in middle | 0.1996 | 0.0000 | Time difference | 0.0011 | 0.0050 | All in middle | 0.2169 | 0.0010 |
| Time difference | 0.0007 | 0.1840 | No. of likes | 0.0088 | 0.0000 | Beginning, centralised at end | 0.1081 | 0.0840 |
| Word count | 0.0035 | 0.0000 | Beginning, centralised in front | 0.0083 | 0.9030 | |||
| No. of likes | 0.0093 | 0.0000 | Fewer in front | 0.1885 | 0.0050 | |||
| More at end | 0.2942 | 0.0000 | ||||||
| Scattered | 0.1072 | 0.1030 | ||||||
| Scattered, not at end | 0.0515 | 0.5950 | ||||||
| Scattered, not in front | 0.2476 | 0.0020 | ||||||
| Time difference | 0.0004 | 0.0980 | ||||||
| No. of hashtags | 0.0054 | 0.0000 | ||||||
| Word count | 0.0022 | 0.0000 | ||||||
| No. of likes | 0.0084 | 0.0000 | ||||||
| No. of observations - 13,673 | No. of observations - 461,723 | No. of observations - 1,905,230 | ||||||
| Scale | 1 | |||||||
According to the results shown in Table 5, the value of scale is 1, which means that the data fit the Poisson regression model well. Time difference was not significant in any of the conditions, which means that when the other variables are certain, the number of comments will not increase after the caption has been published for a long time. The number of likes as a significant variable positively influenced the number of comments. However, it had less influence than hashtag location, as explained in detail below:
- One hashtag: compared with only at the end, although both only in the front and only in the middle are better locations because of their positive coefficient value, only the p value of only in the middle was less than 0.05 (.05), which means that this is the best of these three locations. In addition, the word count is a significant variable that positively influences the number of comments. However, it has less influence than hashtag location.
- More than one hashtag and hashtag percentage greater than 80%: in this case there are two types of hashtag location: all hashtags and most hashtags. In this case, the number of hashtags and word count are not considered variables due to their low variance. Most hashtags is a better choice for listing hashtags in a caption compared with all hashtags.
- More than one hashtag and hashtag percentage less than 80%: there are 10 types of location in this case. All other locations work better than all at the beginning. Nevertheless, only more at end, scattered but not in front, all in the middle, all at end, and fewer in front had significant p values. Based on the definition of these five locations, they can be classified into one type of location: few hashtags in the front of the caption. In addition, the number of hashtags and the word count had a positive influence, but they were not as strong as hashtag location.
The regression models in each condition with number of likes as the dependent variable are presented in Table 6.
| One hashtag | More than one hashtag | |||||||
|---|---|---|---|---|---|---|---|---|
| Hashtag percentage greater than 80% | Hashtag percentage less than 80% | |||||||
| Variable | Coef | p_value | Variable | Coef | p_value | Variable | Coef | p_value |
| Intercept | 14.4684 | 0.0000 | Intercept | 27.0755 | 0.0000 | Intercept | 4.2364 | 0.0000 |
| Only in front | −2.4983 | 0.0090 | Most hashtags | 7.0446 | 0.0000 | All at end | 5.4672 | 0.0000 |
| Only in middle | −2.1049 | 0.0490 | Time difference | 0.0246 | 0.0050 | All in middle | 5.2808 | 0.0000 |
| Time difference | 0.0104 | 0.0340 | No. of comments | 7.4925 | 0.0000 | Beginning, centralised at end | 6.8520 | 0.0000 |
| Word count | 0.0990 | 0.0000 | Beginning, centralised at front | 0.0318 | 0.9630 | |||
| No. of comments | 7.8847 | 0.0000 | Fewer in front | 1.6408 | 0.0000 | |||
| More at end | 6.6860 | 0.0000 | ||||||
| Scattered | 0.2190 | 0.6360 | ||||||
| Scattered, not at end | 1.9587 | 0.1620 | ||||||
| Scattered, not at front | 0.4595 | 0.3960 | ||||||
| Time difference | 0.0190 | 0.0000 | ||||||
| No. of hashtags | 1.2241 | 0.0000 | ||||||
| Word count | 0.0376 | 0.0000 | ||||||
| No. of comments | 7.4770 | 0.0000 | ||||||
| No. of observations - 13,673 | No. of observations - 461,723 | No. of observations - 1,905,230 | ||||||
| Adjusted R2 - 19.20% | Adjusted R2 - 13.40% | Adjusted R2 - 24% | ||||||
The value of adjusted R2 was around 20%, which means that all three models could explain approximately 20% of the variance of the number of likes. Such moderate adjusted R2 was expected because, in this study, factors such as caption content and time of creation were excluded to predict the number of likes and comments. Simply put, such values of adjusted R2 are acceptable in this study.
According to Table 6, number of comments had the biggest influence on increasing the number of likes in each model. Time difference, word count, and number of hashtags also significantly influenced the number of likes. However, their small coefficient values denote they are less powerful than number of comments and hashtag location.
- One hashtag: under this condition, only at the end is the best option to gather likes and only at the front is the worst option.
- More than one hashtag and hashtag percentage greater than 80%: more hashtags is still a better location compared with all hashtags. However, time difference had no significant influence on increasing the number of likes.
- More than one hashtag and hashtag percentage less than 80%: as the results in Table 6 show, all locations work better than all at the beginning to gather likes, whereas only beginning, centralised at end, more at the end, all at the end, all in the middle, and fewer in front had significant p values. These five locations can also be labelled as few hashtags listed in the front of the caption.
As the results in Figure 3 show, almost half of the captions received no comments. Because of this high percentage of lack of comments, the proportion of captions with no comments for each hashtag location is also identified. As the percentage of captions with no comments is 49.57%, it is hypothesised that that percentage is shared by different hashtag locations. Therefore, the percentage of zero-comments captions was calculated for each location and Fisher’s exact test was conducted to verify the hypothesis. Results are shown in Table 7.
| Location | Percentage | p-value |
|---|---|---|
| All at end | 49.68% | 1.00 |
| Most hashtags | 49.83% | 1.00 |
| More at the end | 42.46% | 0.39 |
| All hashtags | 58.87% | 0.25 |
| Beginning, centralised at the end | 50.22% | 1.00 |
| Fewer at front | 48.48% | 1.00 |
| Scattered | 56.48% | 0.39 |
| All in the middle | 46.82% | 0.78 |
| All at the beginning | 63.50% | 0.06 |
| Scattered, not at the front | 52.53% | 0.78 |
| Only at the end | 59.07% | 0.25 |
| Beginning, centralised at front | 58.07% | 0.31 |
| Scattered, not at the end | 56.87% | 0.39 |
| Only at the front | 53.64% | 0.67 |
| Only in the middle | 52.63% | 0.78 |
As presented in Table 7, zero-comments captions per location type results show that location all at the beginning represents 63.5%. The p value of Fisher’s exact test was 0.06, which is lower than the common significant 0.1 level. That is, the hypothesis was not supported, which means that the percentage of zero-comments captions in this location (all at the beginning) is much bigger than that in the other locations. This indicates that if hashtags are all placed consecutively at the beginning of a caption, the chance of zero comments is much larger than average. This finding corresponds to the results shown in Table 7 denoting that, compared with all at the beginning, all other locations work better.
Discussion
This study employed library-related captions on Instagram as data source and analysed these data to outline strategies to effectively organize hashtags in Instagram captions. Specifically, six regression models to demonstrate the relationship between hashtag location and user communication, and the relationship between hashtag location and user attention were created.
Implications for hashtag organization
The average number of hashtags per caption used in the collected captions was 16, indicating that, on Instagram, the use of more than one hashtag is normal. This points to the importance of outlining an effective way to organize hashtags in captions. As shown in Figure 4, more than 60% of captions placed hashtags consecutively at the end of the caption. Moreover, the location more at the end represents the second most important location.
Insights into the most effective ways to organize hashtags in captions can be gained from the results of data analysis. Since the purpose of this paper is to outline the relation between hashtag organization and user communication, the number of followers of each account was not considered so as to underline the purpose.
First, the number of comments has a stronger influence on the number of likes than the other way around. Thus, an effective way of organizing hashtags would be to select a location so as to increase the number of comments, which would dramatically increase the number of likes. Simply put, gathering more comments should be the priority.
Second, compared with the other variables (number of hashtags, word count and time difference), hashtag location has more influence on increasing the number of likes and comments. Furthermore, according to the hashtag function outlined in the Literature review section, hashtags are useful for targeting specific audiences. Therefore, it can be concluded that the more hashtags a caption uses, the more people it could reach, and the more likes and comments it could obtain. Such hypothesis is supported by the significant p values of HC in the regression model. Nevertheless, the coefficient value of the number of hashtags is much smaller than that of hashtag location. This implies that even though more hashtags could lead to more comments and likes, if they are not well organized, such positive correlation will be vague.
Regarding the influence of time difference, this variable was not relevant to obtain more comments in any of the conditions. It has even less influence on gaining more likes if the caption is composed of more than 80% of hashtags. Even though time difference plays an important role in gathering likes when there is only one hashtag in the caption or the hashtag percentage is less than 80%, the coefficient value is still low. It can be concluded that time difference is not an important factor when aiming at obtaining more comments and likes.
When there is only one hashtag in a caption, it is not recommended to put it in the front of the caption. Putting it in the middle is the best location to gain more comments and putting it in the end is the best to gain more likes. However, putting the hashtag in the front has no positive influences on gaining either comments or likes.
Regarding captions composed of more than 80% of hashtags, it is better to use more words rather than having a caption full of hashtags.
When the caption is composed of less than 80% of hashtags, placing all hashtags consecutively at the beginning is not a wise option, because such location tends to result in zero comments. The location more at the end is better than the others to gather comments, which also results in more likes. In addition, scattered but not in the front, all in the middle, all at the end, and fewer in the front are also good locations to obtain more comments. Beginning and centralised at the end, all at the end, all in the middle, and fewer in the front are good locations to obtain likes as well. Based on the mechanism to identify locations, these six locations can be grouped as the location where fewer hashtags are listed in the front of the caption. To summarise, no matter how many hashtags a caption has, placing them in the front should be avoided.
Implications for library research
Since the content of the collected captions was specifically library-oriented, the results of this study may contribute to library research.
Users of social media can be both library customers and content producers (Hvenegaard Rasmussen, 2016). When explaining the concept of participatory library, Nguyen et al. (2012) posited that library users could take on various roles and tasks such as organizing information resources by tagging, rating, and bookmarking, as well as servicing other users by answering questions and recommending materials. For libraries, users’ organization of information resources and provision of services to other users represent user-generated content. Thus, user comments on Instagram posts could be valuable resources for libraries to advocate user participation. Since the main purpose of this study was to highlight the best way to attain more comments and likes by effectively organizing hashtags on Instagram captions, our results may be helpful to create participatory libraries.
Social media offer great opportunities to build communities (Young, 2016; Young and Rossmann, 2015). Communication with users through libraries’ social media sites (Ganster and Schumacher, 2009) as well as information sharing on these media (Phillips, 2011; Young, 2016) may be helpful to build a sense of community among library users. The practical strategies to attract users’ attention and promote communication with them on Instagram proposed in this study could be employed for library community-building as well. For instance, a public library posts some information on Instagram, the more likes it obtains, the more users noticing and paying attention to such information. Furthermore, the more comments the post receives, the more chances the library has to reply and communicate with users. In both ways, the creation of community is facilitated.
Moreover, according to a study by Wang et al. (2016), hashtags can be leveraged to gain visibility for social events. They conducted a study managing the co-occurrence of hashtags. Certain combinations of hashtags were predicted to be more popular among some event participants. They concluded that the social movement dynamics interact with the characteristics of hashtags to achieve information virality, which means ‘the capacity of individuals and organizations to share information and successfully mobilize collective attention, as well as the ability for messages to connect diverse networks’ (Wang et al., 2016, p. 851). The results of the present study enrich the research by Wang et al., highlighting that hashtags in certain locations in captions would gather more likes and comments, denoting a better information-sharing process and the mobilisation of collective attention. This implies that effective hashtag organization could be helpful for achieving information virality as well.
From a big data perspective, the analysis of the current study is built on a large dataset. According to the definition of big data specifically for librarianship advised by Zhan and Widen (2018), the information used in this study falls under the scope of big data due to the fast-growing volume of data on Instagram and the value that can be created through their analysis. Therefore, this study can be considered a relevant resource for libraries to gain insight into how to utilise big data generated on social media. Since future libraries will be ‘intelligent libraries’ and ‘massive data libraries’ (Noh, 2015), the ideas presented in this study to employ such large amounts of data could be relevant for libraries to prepare for their adoption of suitable future models. Furthermore, Zhan and Widen (2018) have outlined eight roles (marketer, educator, data organizer, data container, advocator, adviser, developer, and organization server) that should be undertaken by public libraries in the context of big data. The present study highlights how public libraries could realise two of those roles: adviser and developer. On the one hand, the present results could be a reference for individuals to gather more likes and comments on Instagram. This falls under the role of adviser—providing advice to solve issues from a big data perspective. On the other hand, better organizing hashtags in captions to improve communication between libraries and users, thus improving library services, corresponds to the role of developer—using big data to develop current and new services.
As shown in Table 4, the top 10 hashtags used in the collected captions concern book and book-related topics. This means that most library-related posts on Instagram are about books. On the one hand, this indicates the close relationship between libraries and books. On the other hand, this may reveal a disproportionate emphasis on books compared with other library-related topics. Librarians could create and use alternative hashtags on Instagram that emphasise other library services so people know that libraries are not only about books.
Conclusion
This paper explored strategies to more effectively organize hashtags on Instagram. Through analysing library-related posts and identifying hashtag location in each caption, it is concluded that it is not wise to use as many hashtags as possible. More effort should be made to better organize hashtags in captions because, compared with number of hashtags, word count, and time difference, the location of hashtags has more influence on attracting comments and likes. When there is only one hashtag in a caption, it is advisable not to place it in the front of it. It is also better to use words in a caption rather than using hashtags only. If the percentage of hashtags in a caption is less than 80%, placing them at the end of the caption is the best option. All in all, placing hashtag(s) in the front of the caption should be avoided.
However, this study has some limitations. First, the content of each collected caption was limited to library-oriented topics; more specific types of content such as book recommendations or library events were not identified. Moreover, whether the caption was published by an individual or by an organization was not clarified in the study. Despite the careful data-cleaning processes, there were still limited efforts to improve data veracity in this study, which is a challenge for big data analytic research in general (La Storte et al., 2018). Future studies should use more sophisticated methods to classify the content, identify the publisher of each caption, and secure a better quality data in order to gain a more thorough outcome. A systematic comparison between library-oriented topics with other topics would be advisable in order to identify whether there are specially good or bad hashtag locations in relation to different themes.
Acknowledgements
The authors highly appreciate the Riksbankens Jubileumsfond, which enabled the corresponding author to learn about big data analytics in Sweden. Professor Haibo Lee from KTH Royal Institute of Technology helped a lot during the learning period of the corresponding author. The authors would also like to thank Professor Gunilla Widen, the Head of the Department of Information Studies in Åbo Akademi. Her efforts in commenting the manuscript improved the quality and contribution of this paper.
About the authors
Ming Zhan is a PhD candidate of the department of Information Studies in Åbo Akademi, Turku, Finland. He is also a Data Scientist in Granditude, Stockholm Sweden. His research interests include data mining, text mining, and big data analytics in librarianship. Ming Zhan is the corresponding author, who can be contacted at ming.zhan@abo.fi
Qin Yu is currently working as a test manager in Ericsson AB, Stockholm, Sweden. He obtained his Master’s degree in Telecommunication from Beijing Jiaotong University 2009. He specialises in data management, database design and test strategies. He can be contacted at vinent.yuqin@gmail.com
Ji Wang received her PhD from Liaoning University, Shenyang, China, 2007. She is an Associate Professor in Business School of Liaoning University. Her studies focus on creativity and entrepreneurship in business management. Her contact email address is wangji@lnu.edu.cn
References
Note: A link from the title is to an open access document. A link from the DOI is to the publisher's page for the document.
- Abbott, W., Donaghey, J., Hare, J., & Hopkins, P. J. (2014). The perfect storm: the convergence of social, mobile and photo technologies in libraries. In Proceedings, VALA 2014, Melbourne, Victoria, 3-6 February, 2014 (20 p.) VALA – Libraries, Technology and the Future Inc. http://citeseerx.ist.psu.edu/viewdoc/download?doi=10.1.1.685.2318&rep=rep1&type=pdf
- Abdullah, N., Chu, S., Rajagopal, S., Tung, A., & Kwong-Man, Y. (2015). Exploring libraries’ efforts in inclusion and outreach activities using social media. Libri, 65(1), 34-47. https://doi.org/10.1515/libri-2014-0055
- Abidin, M. I., Kiran, K., & Abrizah, A. (2013). Adoption of Public Library 2.0: librarians’ and teens’ perspective. Malaysian Journal of Library & Information Science, 18(3), 75-90. https://mjlis.um.edu.my/article/view/1877/4160 (Archived by the Internet Archive at https://web.archive.org/web/20200516210123/https://mjlis.um.edu.my/article/view/1877/4160)
- Angiemsolis. (2012, June 23). Instalibrary: the (un)uses of Instagram in libraries. Team Social https://teamsocialblog.wordpress.com/2012/06/23/57/ (Archived by the Internet Archive at https://web.archive.org/save/https://teamsocialblog.wordpress.com/2012/06/23/57/)
- Bunskoek, K. (2014). 3 key hashtag strategies: how to market your business and content retrieved. Wishpond https://blog.wishpond.com/post/62253333766/3-key-hashtag-strategies-how-to-market-your-business. (Archived by the Internet Archive at https://bit.ly/2LB0qv2)
- Burgess, J., Galloway, A. & Sauter, T. (2015). Hashtag as hybrid forum: the case of #agchatoz. In N. Rambukkana (Ed.). Hashtag publics. the power and politics of discursive networks (pp. 61-76). Peter Lang.
- Carlsson, H. (2012). Working with Facebook in public libraries: a backstage glimpse into the Library 2.0 rhetoric. Libri, 62(3), 199-210. https://doi.org/10.1515/libri-2012-0016
- Chae, B. K. (2015). Insights from hashtag# supplychain and Twitter analytics: considering Twitter and Twitter data for supply chain practice and research. International Journal of Production Economics, 165, 247-259. https://doi.org/10.1016/j.ijpe.2014.12.037
- Cooper, B. B. (2016, April 19). 10 surprising new Twitter stats to help you reach more followers. Buffer Resources. https://blog.bufferapp.com/10-new-twitter-stats-twitter-statistics-to-help-you-reach-your-followers. (Archived by the Internet Archive at https://bit.ly/3dOFGMr)
- Daer, A. R., Hoffman, R., & Goodman, S. (2014). Rhetorical functions of hashtag forms across social media applications. In SIGDOC 2014 - Proceedings of the 32nd Annual International Conference on the Design of Communication, Colorado Springs, United States, Sep 27 2014 - Sep 28 2014. (Article no. 16). ACM. https://doi.org/10.1145/2666216.2666231
- Duggan, M., Ellison, N., Lampe, C., Lenhart, A. & Madden, M. (2015). Social media update 2014. Pew Research Center. http://www.pewinternet.org/2015/01/09/social-media-update-2014/. (Archived by the Internet Archive at https://bit.ly/2Tejfs3)
- Dumbrell, D. & Steele, R. (2015). #worldhealthday 2014: the anatomy of a global public health Twitter campaign. In T.X. Bui & R. H. Sprague. (Eds.) Proceedings of the 48th Hawaii International Conference on System Sciences. (pp. 3094-3103). IEEE Computer Society. https://doi.org/10.1109/HICSS.2015.373
- Dwyer, N., & Marsh, S. (2014). What can the hashtag# trust tell us about how users conceptualise trust? In Proceedings, Twelfth Annual International Conference on Privacy, Security and Trust (pp. 398-402). IEEE. https://doi.org/10.1109/PST.2014.6890966
- Famoye, F., & Singh, K. P. (2006). Zero-inflated generalized Poisson regression model with an application to domestic violence data. Journal of Data Science, 4(1), 117-130. http://www.jds-online.com/file_download/96/JDS-257.pdf (Archived by the Internet Archive at https://bit.ly/36doJIT)
- Fink, C., Schmidt, A., Barash, V., Cameron, C., & Macy, M. (2016). Complex contagions and the diffusion of popular Twitter hashtags in Nigeria. Social Network Analysis and Mining, 6(1), 1-19. https://doi.org/10.1007/s13278-015-0311-z http://www.isgroup.unimore.it/article/ircdl17.pdf
- Furini, M., Mandreoli, F., Martoglia, R., & Montangero, M. (2017). The use of hashtags in the promotion of art exhibitions. In C. Grana & L. Baraldi (Eds.). Digital Libraries and Archives. IRCDL 2017. (pp. 187-198). Springer Verlag. https://doi.org/10.1007/978-3-319-68130-6_15
- Ganster, L., & Schumacher, B. (2009). Expanding beyond our library walls: building an active online community through Facebook. Journal of Web Librarianship, 3(2), 111-128. https://doi.org/10.1080/19322900902820929
- Giannoulakis, S. & Tsapatsoulis, N. (2015). Instagram hashtags as image annotation metadata. In R. Chbeir, Y. Manolopoulos, I. Maglogiannis, & R. Alhajj, (Eds.). Artificial intelligence applications and innovations. (pp.206-220). Springer-Verlag. https://doi.org/10.1007/978-3-319-23868-5_15 https://hal.inria.fr/hal-01385356/document
- Gibbs, M., Meese, J., Arnold, M., Nansen, B., & Carter, M. (2015). #Funeral and Instagram: death, social media, and platform vernacular. Information, Communication & Society, 18(3), 255-268. https://doi.org/10.1080/1369118X.2014.987152 https://opus.lib.uts.edu.au/bitstream/10453/69284/1/Gibbs-Meese-Nansen-Arnold-Carter-full-text_libre.pdf
- Gotti, F., Langlais, P. & Farzindar, A. (2014). Hashtag occurrences, layout and translation: a corpus-driven analysis of tweets published by the Canadian government. In N. Calzolari, Choukri, K., Declerck, T., Loftsson, H., Maegaard, B., Mariani, J., Moreno, A., Odijk, J., & Piperidis, S. (Eds.). Proceedings, LREC 2014, Ninth International Conference on Language Resources and Evaluation, Reykjavik, Iceland, May 26-31, 2014 (pp. 2254-2261). European Language Resources Association. http://www.iro.umontreal.ca/~felipe/bib2webV0.81/cv/papers/LREC-2014-Gotti.pdf (Archived by the Internet Archive at https://bit.ly/2LCLHQk)
- Hall, H. (2011). Relationship and role transformations in social media environments. Electronic Library, 29(), 421-428. https://doi.org/10.1108/02640471111156704
- Hamed, A. A. & Wu, X. D. (2014). Does social media big data make the world smaller? An exploratory analysis of keyword-hashtag networks. In C. Kesselman, P. Chen, & H. Jain (Eds.) IEEE International Congress on Big Data, Anchorage, Alaska, USA. (pp.454-461). IEEE. https://doi.org/10.1109/BigData.Congress.2014.72
- Harkai, O. (2018, March 13). Instagram marketing practices 2018: leveraging the algorithm change. smarp https://blog.smarp.com/instagram-marketing-practices-in-2018-leveraging-the-algorithm-change. (Archived by the Internet Archive at https://bit.ly/3dRIEzz)
- Hawkins, R. & Silver, J. J. (2017). From selfie to #sealfie: nature 2.0 and the digital cultural politics of an internationally contested resource. Geoforum, 79, 114-123. https://doi.org/10.1016/j.geoforum.2016.06.019
- Highfield, T., & Leaver, T. (2015). A methodology for mapping Instagram hashtags. First Monday, 20(1), 1-11. https://doi.org/10.5210/fm.v20i1.5563
- Hopkins, P., Hare, J., Donaghey, J., & Abbott, W. (2015). Geo, audio, video, photo: how digital convergence in mobile devices facilitates participatory culture in libraries. Australian Library Journal, 64(1), 11-22. https://doi.org/10.1080/00049670.2014.984379
- Hussain, A. (2015). Adoption of Web 2.0 in library associations in the presence of social media. Program-Electronic Library and Information Systems, 49(2), 151-169. https://doi.org/10.1108/PROG-02-2013-0007
- Huvila, I., Holmberg, K., Kronqvist-Berg, M., Nivakoski, O., & Widén, G. (2013). What is Librarian 2.0 – new competencies or interactive relations? A library professional viewpoint. Journal of Librarianship and Information Science, 45(3), 198-205. https://doi.org/10.1177%2F0961000613477122
- Hvenegaard Rasmussen, C. (2016). The participatory public library: the Nordic experience. New Library World, 117(), 546-556. https://doi.org/10.1108/NLW-04-2016-0031
- Instagram. (2017, April 27). 700 million. Instagram blog https://instagram-press.com/blog/2017/04/26/700-million/. (Archived by the Internet Archive at https://bit.ly/3dSftwn)
- Kamil, P. I., Pratama, A. J. & Hidayatulloh, A. (2016). Did we really #prayfornepal? Instagram posts as a massive digital funeral in nepal earthquake aftermath. In AIP Conference Proceedings. vol. 1730, no. 1, p. 090002. AIP Publishing LLC. https://doi.org/10.1063/1.4947419
- Kaul, H. K. (2016). Libraries and the social media networks. DESIDOC Journal of Library & Information Technology, 36(5), 257-260. https://doi.org/10.14429/djlit.36.5.10610
- Kaushik, A. (2016). Use of social networking sites tools and services by lis professionals for libraries: a survey. DESIDOC Journal of Library & Information Technology, 36(5), 284-290.
- Keloglu-Isler, E. I. & Bayram, O. G. (2014). Commodification of knowledge communication mediums: from library to social media. Procedia - Social and Behavioral Sciences, 147, 550-553. https://doi.org/10.1016/j.sbspro.2014.07.158
- Lee, K. (2016). How to use hashtags: how many, best ones, and where to use them. Buffer https://blog.bufferapp.com/a-scientific-guide-to-hashtags-which-ones-work-when-and-how-many. (Archived by the Internet Archive at https://bit.ly/2WDdHt8)
- Ma, Z., Sun, A. & Cong, G. (2013). On predicting the popularity of newly emerging hashtags in Twitter. Journal of the Association for Information Science and Technology, 64(7), 1399-1410. https://doi.org/10.1002/asi.22844
- Mon, L. & Lee, J. (2015). Influence, reciprocity, participation, and visibility: assessing the social library on Twitter. Canadian Journal of Information and Library Science, 39(3-4), 279-294.
- Noh, Y. (2015). Imagining library 4.0: creating a model for future libraries. Journal of Academic Librarianship, 41(6), 786-797. https://doi.org/10.1016/j.acalib.2015.08.020
- Nguyen, L. C., Partridge, H. L., & Edwards, S. L. (2012). Towards an understanding of the participatory library. Library Hi Tech, 30(2), 335-346. https://doi.org/10.1108/07378831211239997
- Oh, C., Lee, T., Kim, Y., Park, S. & Suh, B. (2016). Understanding participatory hashtag practices on Instagram: a case study of weekend hashtag project. In Proceedings of the 2016 CHI Conference Extended Abstracts on Human Factors in Computing Systems (pp. 1280-1287). ACM. https://doi.org/10.1145/2851581.2892369
- Phillips, N. K. (2011). Academic library use of Facebook: building relationships with students. Journal of Academic Librarianship, 37(6), 512-522. https://doi.org/10.1016/j.acalib.2011.07.008
- Pinho-Costa, L., Yakubu, K., Hoedebecke, K., Laranjo, L., Reichel, C. P., Colon-Gonzalez, M. D., Neves, A. L. & Errami, H. (2016). Healthcare hashtag index development: identifying global impact in social media. Journal of Biomedical Informatics, 63, 390-399. https://doi.org/10.1016/j.jbi.2016.09.010
- Rachman, Y. B., Mutiarani, H., & Putri, D. A. (2018). Content analysis of Indonesian academic libraries' use of Instagram. Webology, 15(2). 27-37. http://www.webology.org/2018/v15n2/a170.pdf (Archived by the Internet Archive at https://bit.ly/3dQPk0Y)
- Rich, J., Haddadi, H., & Hospedales, T. M. (2016). Towards bottom-up analysis of social food. DH'16: Proceedings of the 2016 Digital Health Conference (pp. 111-120). https://dl.acm.org/doi/pdf/10.1145/2896338.2897734
- Sailer, B. (2016, May 16). How to use hashtags effectively without being annoying. CoSchedule Blog https://coschedule.com/blog/how-to-use-hashtags/. (Archived by the Internet Archive at https://bit.ly/3fWLGEy)
- Salomon, D. (2013). Moving on from Facebook: using Instagram to connect with undergraduates and engage in teaching and learning. College & Research Libraries News, 74(8), 408-412. https://crln.acrl.org/index.php/crlnews/article/view/8991/9770 (Archived by the Internet Archive at https://bit.ly/2LA5D6r)
- Scott, A. J. & Holt, D. (1982). The effect of two-stage sampling on ordinary least squares methods. Journal of the American Statistical Association, 77(380), 848-854. https://doi.org/10.1080/01621459.1982.10477897
- Sheldon, P. & Bryant, K. (2016). Instagram: motives for its use and relationship to narcissism and contextual age. Computers in Human Behavior, 58, 89-97. https://doi.org/10.1016/j.chb.2015.12.059
- Siapera, E. (2014). Tweeting #palestine: Twitter and the mediation of Palestine. International Journal of Cultural Studies, 17(6), 539-555. https://doi.org/10.1177%2F1367877913503865
- Sin, S.-C. J. & Kwon, N. (2017). Displacement or complementarity? assessing the relationship between social media and public library usage in the US, South Korea, and Singapore. Library & Information Science Research, 39(3), 169-179. https://doi.org/10.1016/j.lisr.2017.07.002
- Small, T. A. (2011). What the hasgtag? a content analysis of canadian politics on Twitter. Information, Communication & Society, 14(6), 872-895. https://doi.org/10.1080/1369118X.2011.554572
- Stathopoulou, A., Borel, L., Christodoulides, G. & West, D. (2017). Consumer branded #hashtag engagement: can creativity in TV advertising influence hashtag engagement? Psychology & Marketing, 34(4), 448-462. https://doi.org/10.1002/mar.20999
- Stefanone, M. A., Saxton, G. D., Egnoto, M. J., Wei, W. X. & Fu, Y. (2015). Image attributes and diffusion via Twitter: the case of #guncontrol. In T.X. Bui, & R.H. Sprague, (Eds.). Proceedings of the 48th Hawaii International Conference on System Sciences, Kauai, Hawaii, USA (pp. 1788-1797). IEEE Computer Soc. https://doi.org/10.1109/HICSS.2015.216
- Stuart, E., Stuart, D., & Thelwall, M. (2017). An investigation of the online presence of UK universities on Instagram. Online Information Review, 41(5), 582-597. https://doi.org/10.1108/OIR-02-2016-0057 https://bit.ly/3655txh
- Swab, M. & Romme, K. (2016). Scholarly sharing via Twitter: #icanhazpdf requests for health sciences literature. Journal of the Canadian Health Libraries Association, 37(1), 6-11. https://doi.org/10.5596/c16-009
- Tekulve, N. & Kelly, K. (2013). Worth 1,000 words: using Instagram to engage library users. In F. Baudino, & Johnson, C. (Eds.). Brick & Click: an Academic Library Symposium, Maryville, Missouri, November 1, 2013. (pp. 1-8). Northwest Missouri State University. https://archive.org/stream/ERIC_ED545375#page/n1/mode/2up
- Van Zyl, A. S. (2009). The impact of social networking 2.0 on organisations. Electronic Library, 27(6), 906-918. https://doi.org/10.1108/02640470911004020
- Vassilakaki, E. & Garoufallou, E. (2014). The impact of Facebook on libraries and librarians: a review of the literature. Program-Electronic Library and Information Systems, 48(3), 226-245. https://doi.org/10.1108/PROG-03-2013-0011
- Vassilakaki, E. & Garoufallou, E. (2015). The impact of Twitter on libraries: a critical review of the literature. Electronic Library, 33(4), 795-809. https://doi.org/10.1108/EL-03-2014-0051
- Wang, R., Liu, W., & Gao, S. (2016). Hashtags and information virality in networked social movement: examining hashtag co-occurrence patterns. Online Information Review, 40(7), 850-866. https://doi.org/10.1108/OIR-12-2015-0378
- Young, S. W. (2016). Introduction to social media optimization: setting the foundation for building community. Library Technology Reports, 52(8), 5-8. http://dx.doi.org/10.6017/ital.v34i1.5625
- Young, S. W. & Rossmann, D. (2015). Building library community through social media. Information Technology and Libraries, 34(1), 20-37. https://doi.org/10.6017/ital.v34i1.5625
- Zappavigna, M. (2015). Searchable talk: the linguistic functions of hashtags. Social Semiotics, 25(3), 274-291. https://doi.org/10.1080/10350330.2014.996948
- Zhan, M., & Widen, G. (2019). Understanding big data in librarianship. Journal of Librarianship & Information Science, 51(2), 561-576. https://doi.org/10.1177%2F0961000617742451
- Zhan, M., & Widen, G. (2018). Public libraries: roles in big data. The Electronic Library, 36(1), 133-145. https://doi.org/10.1108/EL-06-2016-0134
- Zhang, M., Sheu, F.-R., & Zhang, Y. (2018). Understanding Twitter use by major lis professional organisations in the United States. Journal of Information Science, 44(2), 165-183. https://doi.org/10.1177%2F0165551516687701
How to cite this paper
Appendix: Distribution of likes and comments
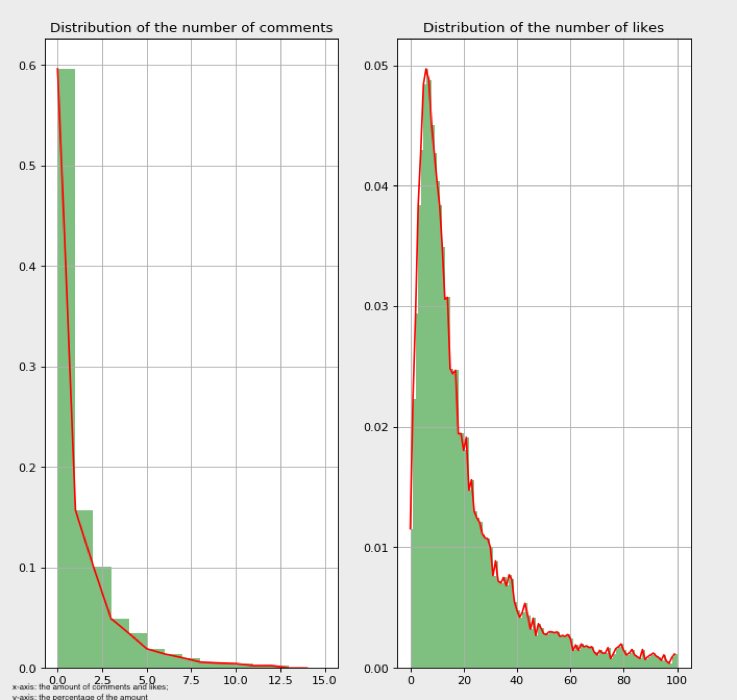
Figure 1. No. of hashtags = 1.
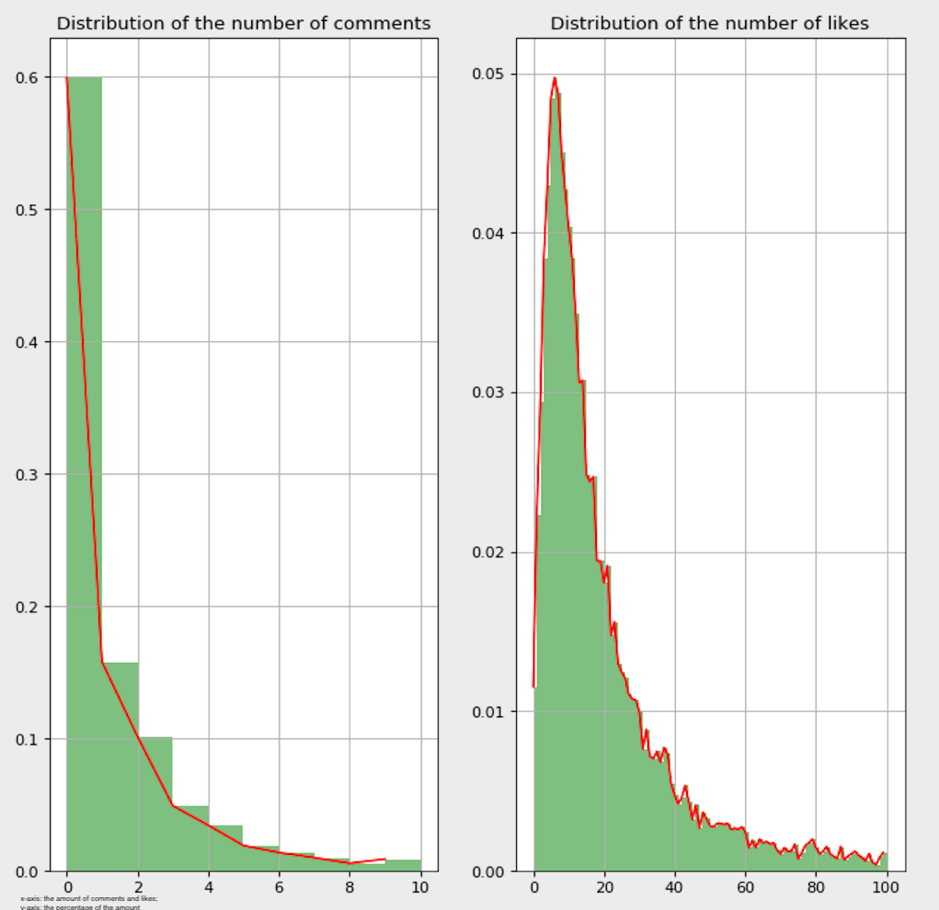
Figure 2: More than one hashtag and hashtag percentage greater than 80%
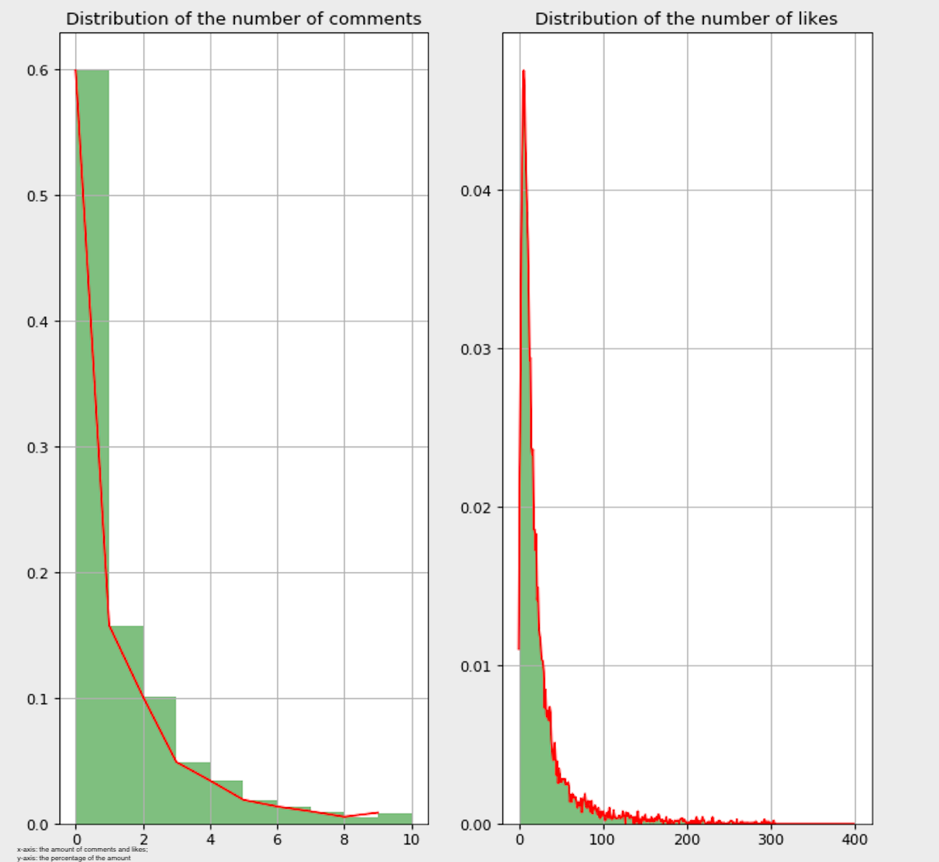
Figure 3: More than one hashtag and hashtag percentage less than 80%