A document co-citation analysis method for investigating emerging trends and new developments: a case of twenty-four leading business journals
Fangfang Wei and Guijie Zhang
Introduction. Research on intellectual structure has received increasing attention from a broad range of scientific communities. Taking twenty-four business journals chosen by the University of Texas at Dallas as leading journals as an example, this study aims to provide a systematic research method for investigating emerging trends and new developments in a specific field.
Method. We collected paper published in the University of Texas at Dallas collection between 1991 and 2018, giving a total of 33,045 papers. Document co-citation networks, landmark articles and domain-level citation trends were then identified.
Analysis. We employed CiteSpace to conduct document co-citation analysis. We also used a dual-map overlay technique to investigate the knowledge base of the domain.
Results. We found that certain core topics in the early period, namely, strategic alliance, organisational mortality and organisational adaptation, have been replaced by social media, price informativeness and network communities in the most recent period. Dual-map overlays show that the literature in psychology, education, social, economics. And political science journals form an important basis for psychology, education, and health.
Conclusions. This paper reveals a systematic and holistic picture of the developmental landscape of the business domain, which might provide a potential guide for future research.
Introduction
Co-citation analysis of the bibliographic elements contained within the scientific literature can be applied to explore the knowledge structure and dynamic evolution of a specific research area. In 1973 Henry Small and Irina Marshakova independently introduced the notion of co-citation (Marshakova, 1973; Small, 1973). This type of analysis has subsequently attracted considerable attention from scholars in a variety of fields and has become a commonly used method (Ahlgren et al., 2003; Braam et al., 1991; Guan et al., 2017; Kim et al., 2016; White and Griffith, 1981). For example, White and Griffith confirmed that co-citation analysis of authors offered a new technique that could contribute to understanding the intellectual structure of the sciences. Culnan (1987) documented the intellectual structure of management information systems research based on author co-citation analysis. Braam et al. (1991) claimed that co-citation analysis was a useful method for mapping subject-matter specialties of scientific research and for studying the differences in research topics between sets of publications. Furthermore, Ahlgren et al. (2003) criticised the use of Pearson's r in author co-citation analysis and analysed the requirements that a similarity measure applied in author co-citation analysis should satisfy. Kim et al. (2016) characterized content-based author co-citation analysis using citation sentences. Additionally, Guan et al. (2017) discussed the impact of collaboration and knowledge networks on citations. Taken together, these efforts have suggested that co-citation analysis is a valid and reliable method for investigating intellectual structure due to the objectivity of the measurement and therefore plays an irreplaceable role in scientometric analysis.
In recent years, new trends and topics in the business domain have continuously emerged, and the status of this domain is of interest to many researchers in business schools (Amit and Zott, 2001; Kumar and Jan, 2013; Narver and Slater, 1990; Rossetto et al., 2018; Wei et al., 2017). For instance, Narver and Slater proposed a valid measure of market orientation and a systematic analysis of its effect on business performance. In addition, Amit and Zott (2001) explored the theoretical foundations of value creation in e-business by examining how e-businesses that have recently become publicly traded corporations create value. Kumar and Jan (2013) examined the distribution of research collaborations in the business domain in Malaysia, providing suggestions for an effective co-authorship strategy. Furthermore, Rossetto et al. (2018) examined the structure and evolution of innovation research in the business domain through a scientometric analysis.
Although bibliometric researchers have centred their attention on the business domain and mapped fruitful knowledge networks, to the best of our knowledge, few have attempted to visualise the results of the citation analysis of the knowledge domain of the twenty-four business journals chosen by the University of Texas at Dallas as leading journals (hereafter referred to as the Dallas collection). The Dallas collection is universally recognised throughout the business research community as top journals that represent the essential content and the research frontier of the business domain. The collection is recognised in North America and China as representative of the top business journals, but it is not the only such list. Future research will compare the Dallas collection with the lists of top business journals as determined by the Australian Business Deans Council, Google Scholar Metrics, InCites, and Scimago. The Dallas collection has been popularly used to rank the top higher education academic institutions based on the contributions of their faculty and to evaluate the academic status of scholars in the business field (Mudambi et al., 2008; Wu et al., 2017). Consequently, it is meaningful to conduct a multi-perspective co-citation analysis of the emerging trends and newest developments in the Dallas collection, especially for individuals who are not well-informed about the thematic patterns, landmark papers and knowledge structure of the business domain.
Based on the articles published in the journals contained in the Dallas collection from 1991 to 2018, the purpose of this study is to visually illustrate worldwide research subjects and thematic trends within business domain research and identify and analyse the changes occurring across this time period. Specifically, analytical methods entailing co-cited references (Chen, 2017), burst detection (Kleinberg, 2003) and dual-map overlays (Gandia et al., 2019) are applied to depict the intellectual structure and topic developments of the Dallas collection. Detailed explanations are included under the Results section. This paper contributes to the business literature by providing insights into the temporal changes in the research frontier and the evolution of the emerging research topics and knowledge base of the business domain.
The remainder of this paper is organised as follows. The Methods section describes the data collection procedure and provides a brief description of CiteSpace. The Results section discusses the results of the empirical studies we conducted. Finally, the Conclusions section summarises our contributions.
Methods
Data collection
Following the earlier literature (Lowry et al., 2013; Mudambi et al., 2008), we collected data on the Dallas collection. The Dallas collection is a collection of internationally recognised flagship journals that represent the mainstream and most important emerging research areas in the business domain (Lowry et al., 2013; Mingers and Harzing, 2007; Wu et al., 2017). Therefore, these journals are ideal for studying research evolution in the business domain. The details of the Dallas collection according to the Web of Science are shown in Appendix Table 1.
We extracted the meta-data of publications contained in the Dallas collection from the Web of Science database. Following the previous literature (Chen et al., 2014; Kim et al., 2016; Zhang et al., 2017; Zhang et al., 2019), during this process, among all publication types available, only those classified as articles or reviews were selected; others, such as letters, notes and corrections, were excluded. We made this decision primarily to guarantee the quality of the indexed publications and because articles and reviews are the most important representatives of academic achievement (Chen et al., 2014; Liu and Gui, 2016). Specifically, articles and reviews usually have a great deal of well-structured indexing information, which is essential for tracking scientific activity (Porter and Cunningham, 2005). A total of 33,216 bibliographic records of original research articles and reviews was retrieved and downloaded on June 2, 2018; the most recent update time of the database was June 1, 2018. Figure 1 depicts the yearly number of published papers from 1991 to 2018 retrieved from the Web of Science. As shown in Figure 1, the Dallas collection has received increasing attention from the community over time.
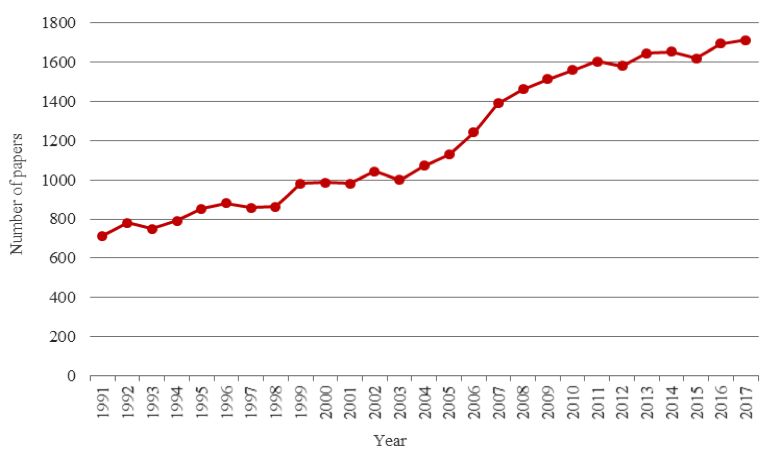
Figure 1: Annual publication counts of the Dallas collection from 1991 to 2018 in Web of Science
The quality of the dataset is crucial for our analysis and the meaningfulness of the generated results. After a series of data pre-processing steps, such as removing duplicates or misspellings, 33,045 original research articles and reviews ultimately remained, with 698,690 references. To better observe the emerging trends and new developments of the twenty-four leading business journals, in this article, we divide the whole period into three parts. Table 1 describes the brief statistics of the datasets.
| Period | Duration | Papers | References | Avg. no. of references per paper |
|---|---|---|---|---|
| Period I | 1991-2000 | 8,462 | 167,536 | 19.80 |
| Period II | 2001-2010 | 12,400 | 246,666 | 19.89 |
| Period III | 2011-2018 | 12,183 | 284,488 | 23.35 |
| Total | 1991-2018 | 33,045 | 698,690 | 21.14 |
Methods of analysis
In this article, we employ CiteSpace, a Java-based scientometric software package developed by Chaomei Chen, to generate and visualise the bibliographic record networks of the Dallas collection. CiteSpace is designed to generate a systematic review of scientific literature and has been widely applied in scientometric studies (Hou et al., 2018; Kim et al.,2016; Chen, 2018). Based on the Web of Science bibliographic databases, CiteSpace supports the complete analytic process of visualising and analysing research trends and patterns within scientific literature (Chen, 2014, 2017; Kim and Chen, 2015).
The structure and dynamics of the literature of the business domain can be analysed in terms of the co-citation network derived from the citations generated by citing papers (Liu and Gui, 2016). The co-citation network can be decomposed into diverse clusters of tightly coupled references to represent a common topic of research. Then, these clusters can be labelled using terms extracted from the titles of the most representative citing papers for each cluster (Chen et al., 2014). A burst of an entity describes a surge in the frequency of the entity, for instance, the citation of a paper or the appearance of a term. Based on the burst detection algorithm, CiteSpace can identify papers that have attracted increased attention from scholars (Kim et al., 2016; Kleinberg, 2003).
Through journal co-citation analysis, dual-map overlays can display relationships between the distributions of the cited and citing journals and facilitate the analysis of literature at a disciplinary level (Chen and Leydesdorff, 2014; Hou et al., 2018). Dual-map overlays are superimposed on a global base map of publication portfolios that consist of two component maps. Each map represents a network containing over 10,000 journals in terms of their similarities as citing or cited journals, corresponding to the left and right parts of the map, respectively (Chen and Leydesdorff, 2014). Dual-map overlays provide another visual analytic method for analysing the characteristics of scientific literature.
Results
A landscape view of the co-citation network
To compare the changes in the business domain research topics in Periods I-III, we conducted cluster analysis on datasets in these three periods based on the document co-citation network through a landscape view, as shown in Figures 3-5. We use the method of Pathfinder network scaling pruning to reduce the links during this process. The co-citation network shows a network of references that have been co-cited by a series of publications (Chen et al., 2014). The topologies consist of the top 300 most cited articles, with one year per slice in each dataset. Each node depicts a cited reference, and the edges denote the co-cited relationships among papers (Zhu and Hua, 2017). The co-cited duration is represented by nodal colours ranging from cooler colours to warmer colours indicating temporal variations (Chen, 2017). Changes in colour allow us to follow the thematic trends over time in the business domain. The overall structure consists of three major areas of activity: the network with links predominantly in green, corresponding to co-citations made in the first four years (three years in Period III) of these three periods; the network with links in green, which are co-citations mostly made in the second four years (three years in Period III) of each period between 1991 and 2000, between 2001 and 2010, and between 2011 and 2018; and the network with co-citation links mostly in orange and red, indicating that these co-citations were made in the most recent years in each period. To more clearly distinguish the clusters, we unify the cluster label colours. In addition, LRF refers to link retaining factor, which adjusts the number of edges being analysed. Furthermore, LBY refers to look-back years, which adjust the time span of the edges in the network. 'e' is the lowest frequency of nodes in a network.
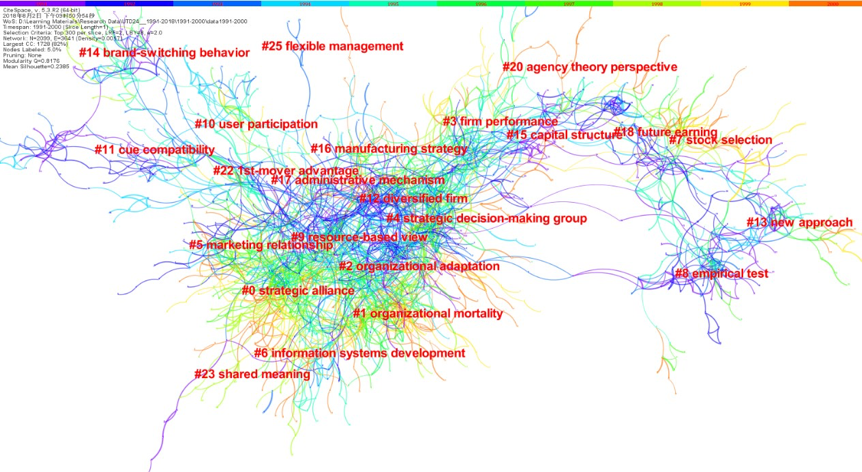
Figure 2: A landscape view of the co-citation network generated by the top 300 articles per year between 1991 and 2000 (LRF = 2, LBY = 8, and e = 2.0)
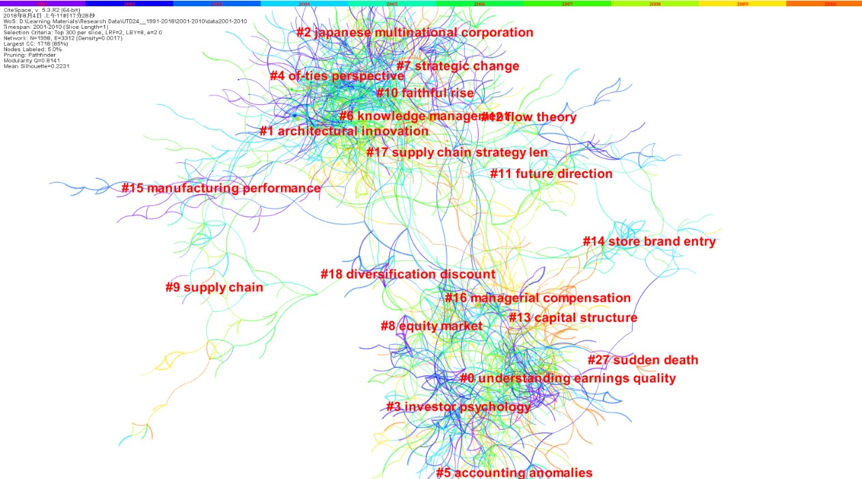
Figure 3: A landscape view of the co-citation network generated by the top 300 articles per year between 2001 and 2010 (LRF = 2, LBY = 8, and e = 2.0)
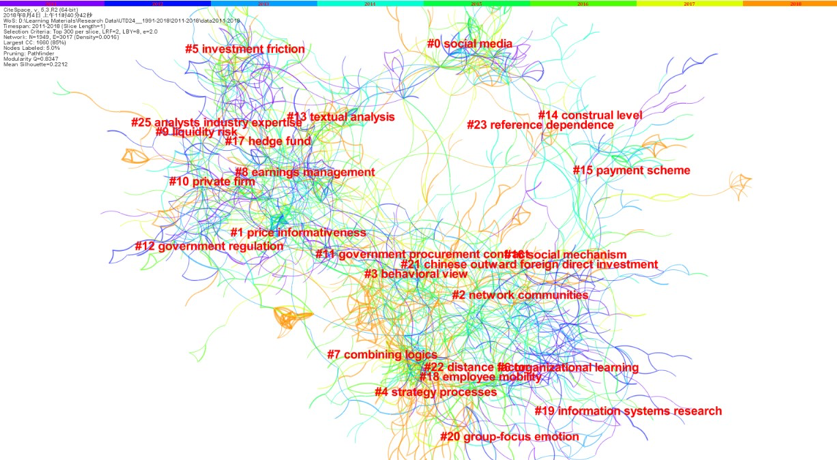
Figure 4: A landscape view of the co-citation network generated by the top 300 articles per year between 2011 and 2018 (LRF = 2, LBY = 8, and e = 2.0)
The document co-citation network in Period I forms a total of 280 clusters, including 2,099 nodes and 3,641 lines. The document co-citation network in Period II forms 237 clusters, including 1998 nodes and 3312 lines. The document co-citation network in Period III forms 236 clusters, including 1,949 nodes and 3,017 lines. Modularity denotes the quality of the overall network breakdown into clusters (Newman, 2006). The modularity of the networks in Periods I, II and III is 0.8176, 0.8141 and 0.8347, respectively, which is considered very high, suggesting that the specialties in the business domain are clearly defined in terms of co-citation clusters (Chen, 2017). The silhouette value indicates clustering validity, in which a perfect network subdivision is 1, while the worst possible network subdivision is -1 (Rousseeuw, 1987). The average silhouette score of the networks in Periods I, II and III is 0.2385, 0.2231 and 0.2212, respectively, which is relatively low, mainly because of the numerous small clusters (Chen, 2017).
Employing the CiteSpace program, we can obtain a few of the details of the largest clusters in each period. The log-likelihood ratio refers to the probability of a term appearing in a cluster. In CiteSpace, the terms in a cluster are sorted by this ratio, and then the term with the highest value is used to name the cluster. According to Table 2, the strategic alliance, organizational mortality, organizational adaptation, firm performance, and strategic decision-making groups are among the leading topics during Period I. Table 2 indicates that the scientific community has paid high attention to strategic research (e.g., cluster 0, strategic alliance and cluster 4, strategic decision-making) and organizational research (e.g., cluster 1, organizational mortality and cluster 2, organizational adaptation) in this period. The average years of publication of these eight clusters are between 1988 and 1993, making cluster 7, stock selection the most recent cluster in this period. The homogeneity values of these eight clusters, measured by the silhouette score, all exceed 0.7, suggesting high homogeneity within these clusters (Chen, 2018).
| Cluster | Size | Silhouette | Label (log-likelihood ratio) | Mean cited year |
|---|---|---|---|---|
| 0 | 156 | 0.803 | strategic alliance (17398.25, 1.0E-4) | 1992 |
| 1 | 143 | 0.769 | organizational mortality (18233.89, 1.0E-4) | 1991 |
| 2 | 116 | 0.739 | organizational adaptation (5942.35, 1.0E-4) | 1989 |
| 3 | 115 | 0.808 | firm performance (7786.44, 1.0E-4) | 1990 |
| 4 | 113 | 0.837 | strategic decision-making group (5938.34, 1.0E-4) | 1990 |
| 5 | 89 | 0.868 | marketing relationship (8054.04, 1.0E-4) | 1990 |
| 6 | 88 | 0.862 | information systems development (5330.72, 1.0E-4) | 1988 |
| 7 | 84 | 0.878 | stock selection (13572.96, 1.0E-4) | 1993 |
According to the cluster labels of the research topics during 2001-2010, cluster 0, understanding earnings quality ranks first according to the size of the cluster, followed by architectural innovation, Japanese multinational corporation, investor psychology, of-ties perspective, accounting anomalies, knowledge management, strategic change and equity market. Cluster 0, understanding earnings quality and cluster 3, investor psychology both concern investment. Additionally, Cluster 8, equity market indicates that stock research, which had already become a notable research topic in Period I, remains a research hotspot. Notably, Japanese multinational corporation becomes the focus of people's attention. Furthermore, cluster 4 indicates that knowledge management is one of the most fundamental themes in the business domain. Combining the information in Tables 2-4, we find that traditional research topics in the business domain, including strategy research and stock research, have clearly always been a research focus.
| Cluster | Size | Silhouette | Label (log-likelihood ratio) | Mean cited year |
|---|---|---|---|---|
| 0 | 161 | 0.840 | understanding earnings quality (30210.74, 1.0E-4) | 2000 |
| 1 | 158 | 0.819 | architectural innovation (7348.85, 1.0E-4) | 2000 |
| 2 | 146 | 0.821 | Japanese multinational corporation (14835.34, 1.0E-4) | 1999 |
| 3 | 145 | 0.839 | investor psychology (23236.5, 1.0E-4) | 1999 |
| 4 | 120 | 0.844 | of-ties perspective (6190.3, 1.0E-4) | 1999 |
| 5 | 109 | 0.879 | accounting anomalies (14187.57, 1.0E-4) | 2001 |
| 6 | 97 | 0.845 | knowledge management (4843.28, 1.0E-4) | 1999 |
| 7 | 84 | 0.857 | strategic change (4911.64, 1.0E-4) | 1997 |
| 8 | 83 | 0.873 | equity market (10002.86, 1.0E-4) | 2001 |
As shown in Table 4, clusters 0, social media, 1, price informativeness and 2, network communities are largest in size and are doubtless emerging research frontiers and hotspots in the current business domain. The largest cluster, social media, contains 127 references, and the mean year of publication is 2009. With the growing popularity of social media, user-generated content has become an indispensable part of people's everyday lives (de Melo Maricato and Vilan Filho, 2018). Due to the explosion of social network communities and online review websites, such has quickly become a highly dynamic media form (Aaltonen and Seiler, 2015). Because of its irreplaceable role, user-generated content has received extensive attention since it first appeared, and current investigations are particularly focused on its effects on product sales, social networks and the diffusion of the content, management and guidelines for its conceptual modelling (Lukyanenko et al., 2017).
| Cluster | Size | Silhouette | Label (log-likelihood ratio) | Mean cited year |
|---|---|---|---|---|
| 0 | 127 | 0.953 | social media (9436.33, 1.0E-4) | 2009 |
| 1 | 118 | 0.799 | price informativeness (9437.28, 1.0E-4) | 2008 |
| 2 | 111 | 0.781 | network communities (10827.05, 1.0E-4) | 2009 |
| 3 | 105 | 0.818 | behavioural view (4923.5, 1.0E-4) | 2009 |
| 4 | 98 | 0.849 | strategy processes (16994.51, 1.0E-4) | 2011 |
| 5 | 92 | 0.934 | investment friction (7050.21, 1.0E-4) | 2009 |
| 6 | 89 | 0.817 | organizational learning (9884.17, 1.0E-4) | 2006 |
| 7 | 86 | 0.817 | combining logics (4733.56, 1.0E-4) | 2010 |
| 8 | 83 | 0.863 | earnings management (8662.46, 1.0E-4) | 2008 |
Emerging trends in the business domain
The emerging trends and new developments in a specific field can be assessed by studying publications receiving surging citations in a certain period of time, namely, burst detection. Burst detection is a computational technique that has been widely adopted to identify abrupt changes in events (Kleinberg, 2003). A citation burst indicates that the research community has paid an intensive degree of attention to the underlying work (Chen et al., 2014). If a cluster contains numerous publications with strong citation bursts, then the cluster as a whole is considered to capture an active area of research, that is, an emerging trend (Chen, 2014).
Tables 2 and 3 in the Appendix list the top twenty references with the strongest bursts and the most recent citation bursts during 1991-2018, respectively (see appendix). This time interval is depicted as a blue line, whereas the time period of a reference’s citation burst is shown as a red line segment, indicating the beginning and ending year of the duration of a citation burst (Hou et al., 2018). Based on the beginning years of bursts in Appendix Table 2, the research trends in the business domain can be grouped into three phases: 1992-1999 (papers 3, 4, 9, 12, 14, 18, 19 and 20), 2000-2008 (papers 2, 6, 7, 10, 12, 13 and 16) and 2010-2012 (papers 1, 5, 8, 15 and 17). In Appendix Table 3, all papers are published between 2010 and 2015 and have a burst time from 2016 to 2018, which is relatively concentrated.
In terms of the time period, the distribution of high-burst papers is relatively scattered, while the papers with the most recent bursts were published predominantly in 2010 (6 papers), 2011 (3 papers), 2012 (3 papers), 2013 (4 papers) and 2014 (3 papers). In terms of the literature source, these papers with strong citation bursts were published primarily by Administrative Science Quarterly (2 papers), Journal of Political Economy (2 papers), Strategic Management Journal (2 papers) and The Review of Financial Studies (2 papers). The papers with the most recent bursts were published by Academy of Management Journal (4 papers), Journal of Financial Economics (3 papers), Strategic Management (3 papers) and The Review of Financial Studies (3 papers). Administrative Science Quarterly, Journal of Accounting and Economics, Journal of Financial Economics, Strategic Management and The Review of Financial Studies appear in these two categories, which means that many of the most cited articles come from these journals. Consequently, these journals should attract the attention of scholars in the business domain. The number of authors of these papers is between 1 and 4. Specifically, there are 8 (20%), 17 (42.5%), 13 (32.5%), and 2 (5%) articles with 1, 2, 3 and 4 authors, respectively. The main authors of these papers include Andrew F. Hayes (2 papers), Eugene F. Fama (2 papers), Kenneth R. French (2 papers) and Morten T. Hansen (2 papers); the other authors all have one paper.
According to the information of the papers, such as title, abstract and keywords, in Appendix Table 2, an intensive degree of attention has been paid to stock price and returns (papers 6, 9 and 11), competitive advantage (papers 3, 10 and 14), and strategic management and cooperative strategy (papers 4 and 10). In Appendix Table 2, to discover novel knowledge in the business domain, the current research frontiers focus on firm performance and profitability (papers 6, 9 and 15), financial reporting (papers 2 and 18) and enterprise strategy and management strategy (papers 4 and 7). In addition, there is a literature review article in these two tables, indicating that review articles are more likely to receive burst citations, similar to the conclusions of previous articles (Chen et al., 2014; Zhu and Hua, 2017). Stock returns, financial reporting, firm performance and competitive advantage are shared topics in Appendix Tables 2 and 3, indicating that these topics have received considerable attention from the business community over time.
Changes in the knowledge base revealed by dual-map overlays
Journal dual-map overlay analysis reveals a global visualising map of citation patterns at a domain level and reveals the evolution of the citation distribution over time (Chen and Leydesdorff, 2014). The dual-map overlay indicates the disciplinary concentrations of given papers through their citation relations. The global base map describes the interconnections of more than 10,000 scientific journals, which are further grouped into regions that represent publication and citation activities at a domain level (Chen et al., 2014). Through a dual-map overlay, we can identify the interrelationships among different domains. The thickness of a line is proportional to the z-score-scaled frequency of citation (Kim et al., 2016).
In this paper, we use dual-map representations to explore the knowledge diffusion patterns in the business domain for the three periods from a global perspective, as shown in Figures 5 to 7. These figures depict the evolution of the knowledge base of the business domain by comparing the changes in the citation structure of the Dallas collection in each period. Coloured curves reveal paths of references, which originate from the citing component maps on the left and point to the cited component maps on the right. The positions of these curves visualise how research is built on previous studies because both citing and cited articles are divided into numerous thematic areas and each position belongs to one of them. Each area is determined by a cluster of journals belonging to the area, and each area is marked by the most common terms in the titles of the underlying journals.
Table 5 briefly summarises these paths with citing and cited region names. The relationships are sorted by z-score in descending order. According to Figures 5, 6 and 7 and Table 5, the literature of the business domain primarily appears in two broad areas on the citing map: the area in red near the top with the label mathematics/systems/mathematical and the area in green in the lower position with the label psychology/education/health. The citation curves of the two regions point to regions in the cited map on the right. The citation links in green are split into two major streams, indicating that the literature in psychology/education/social economics/political science journals is an important basis for psychology/education/health. The sources of references are basically consistent in these three periods, indicating that the knowledge base of the business domain is stable.
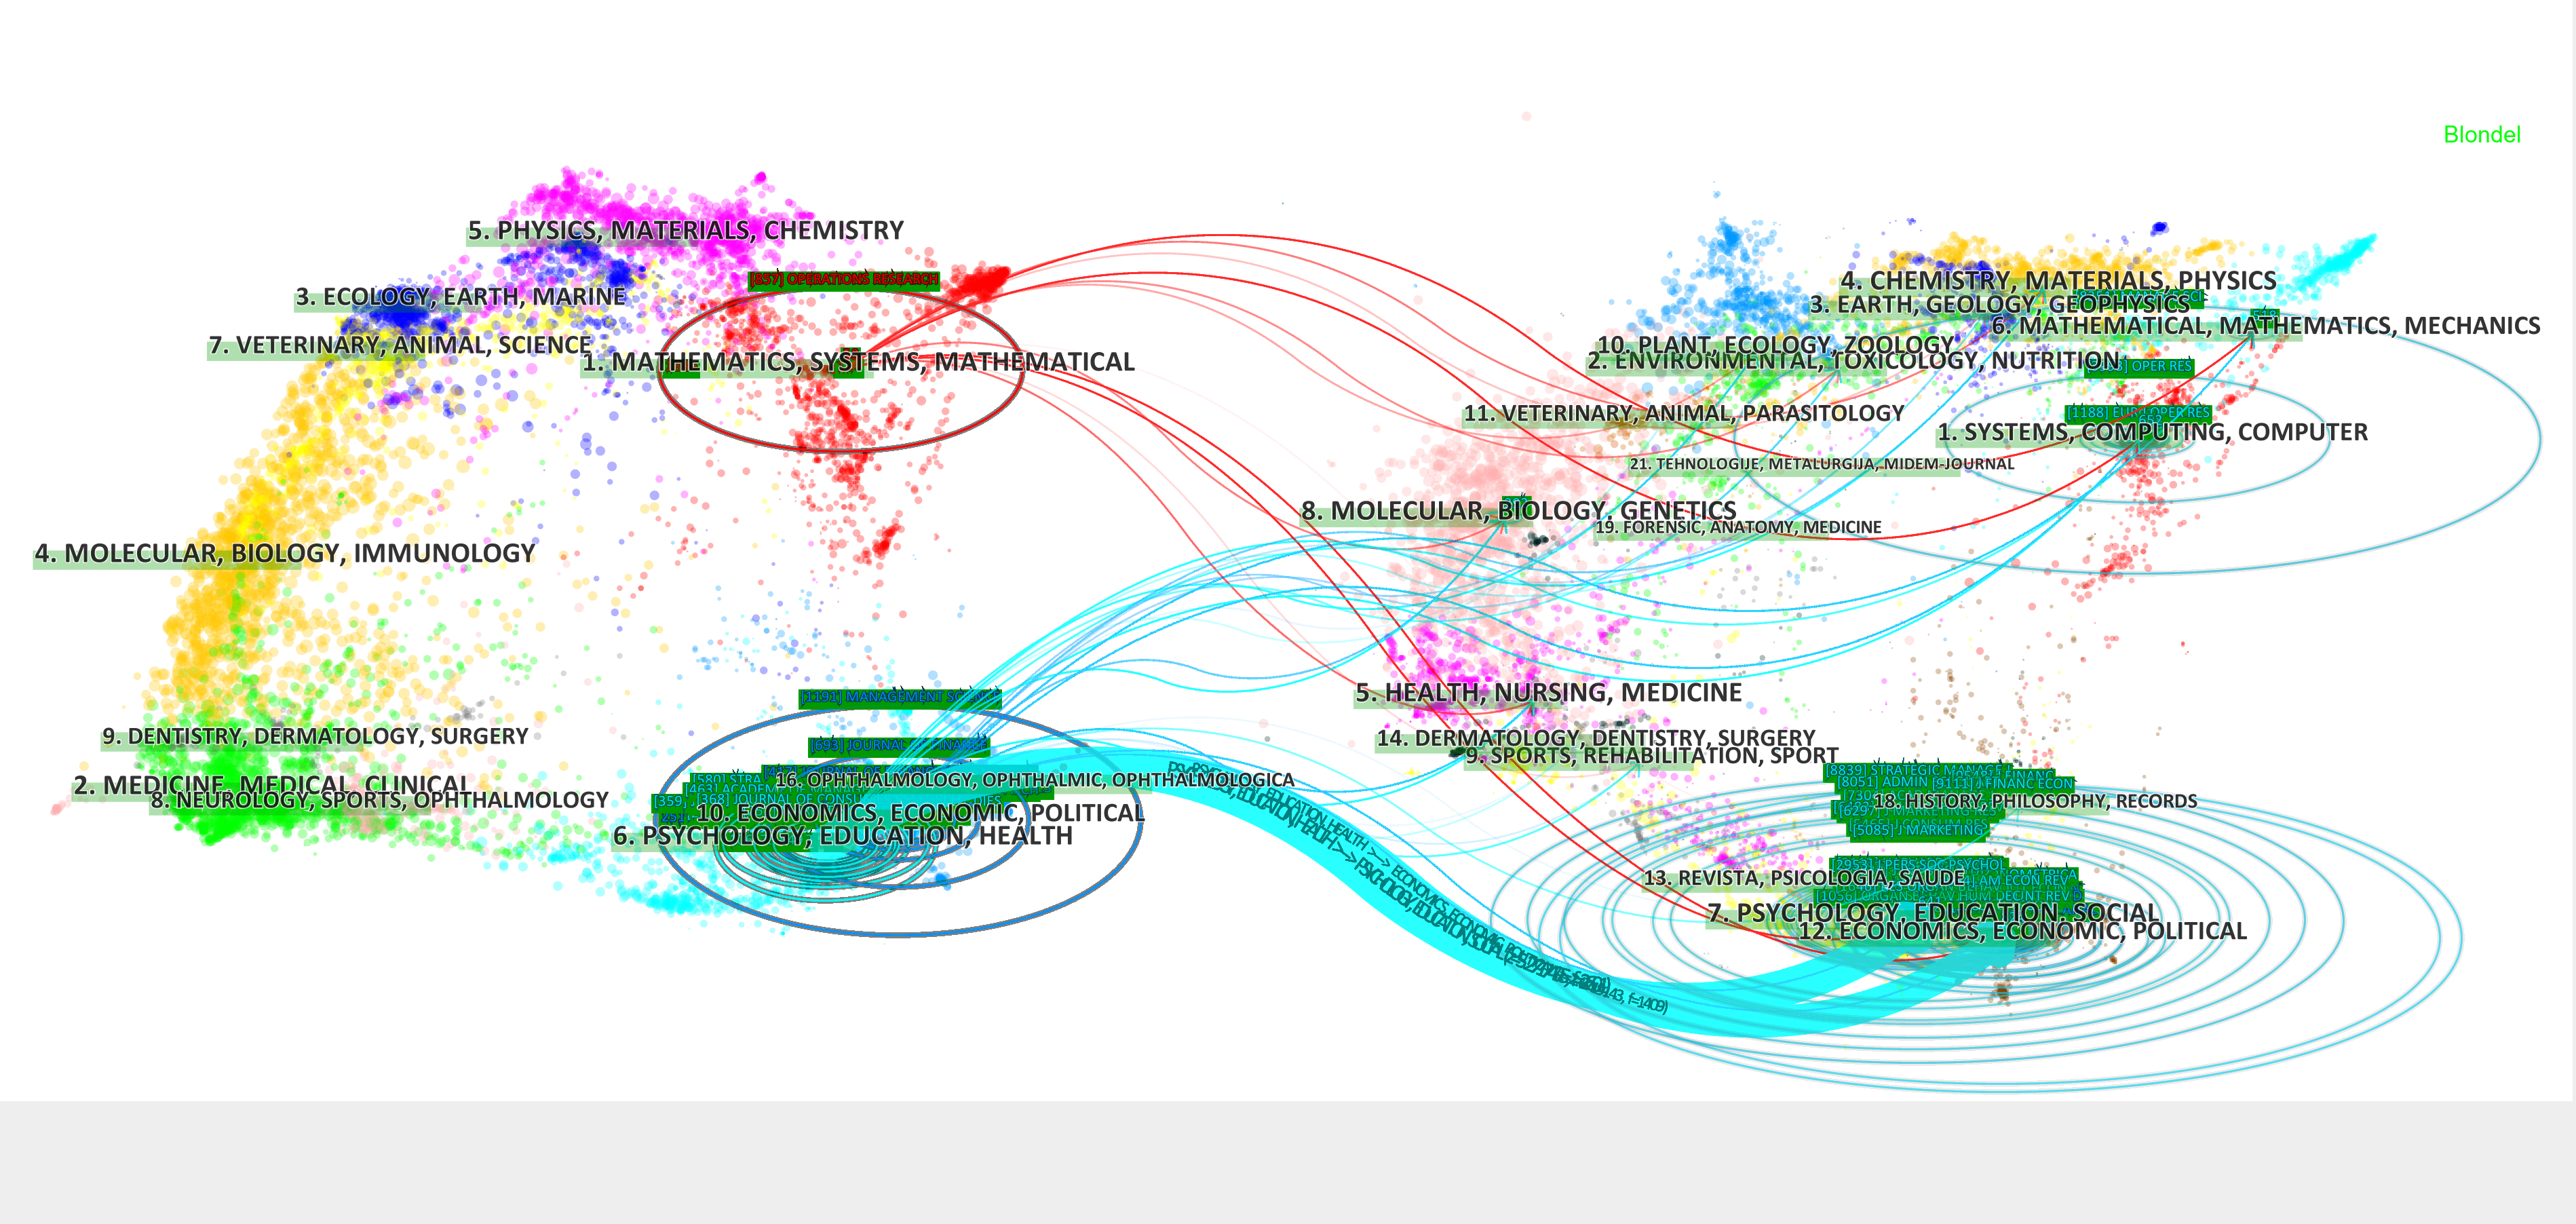
Figure 5: Dual-map overlays of the most cited articles published between 1991 and 2000 on top of the Dallas collection overlay
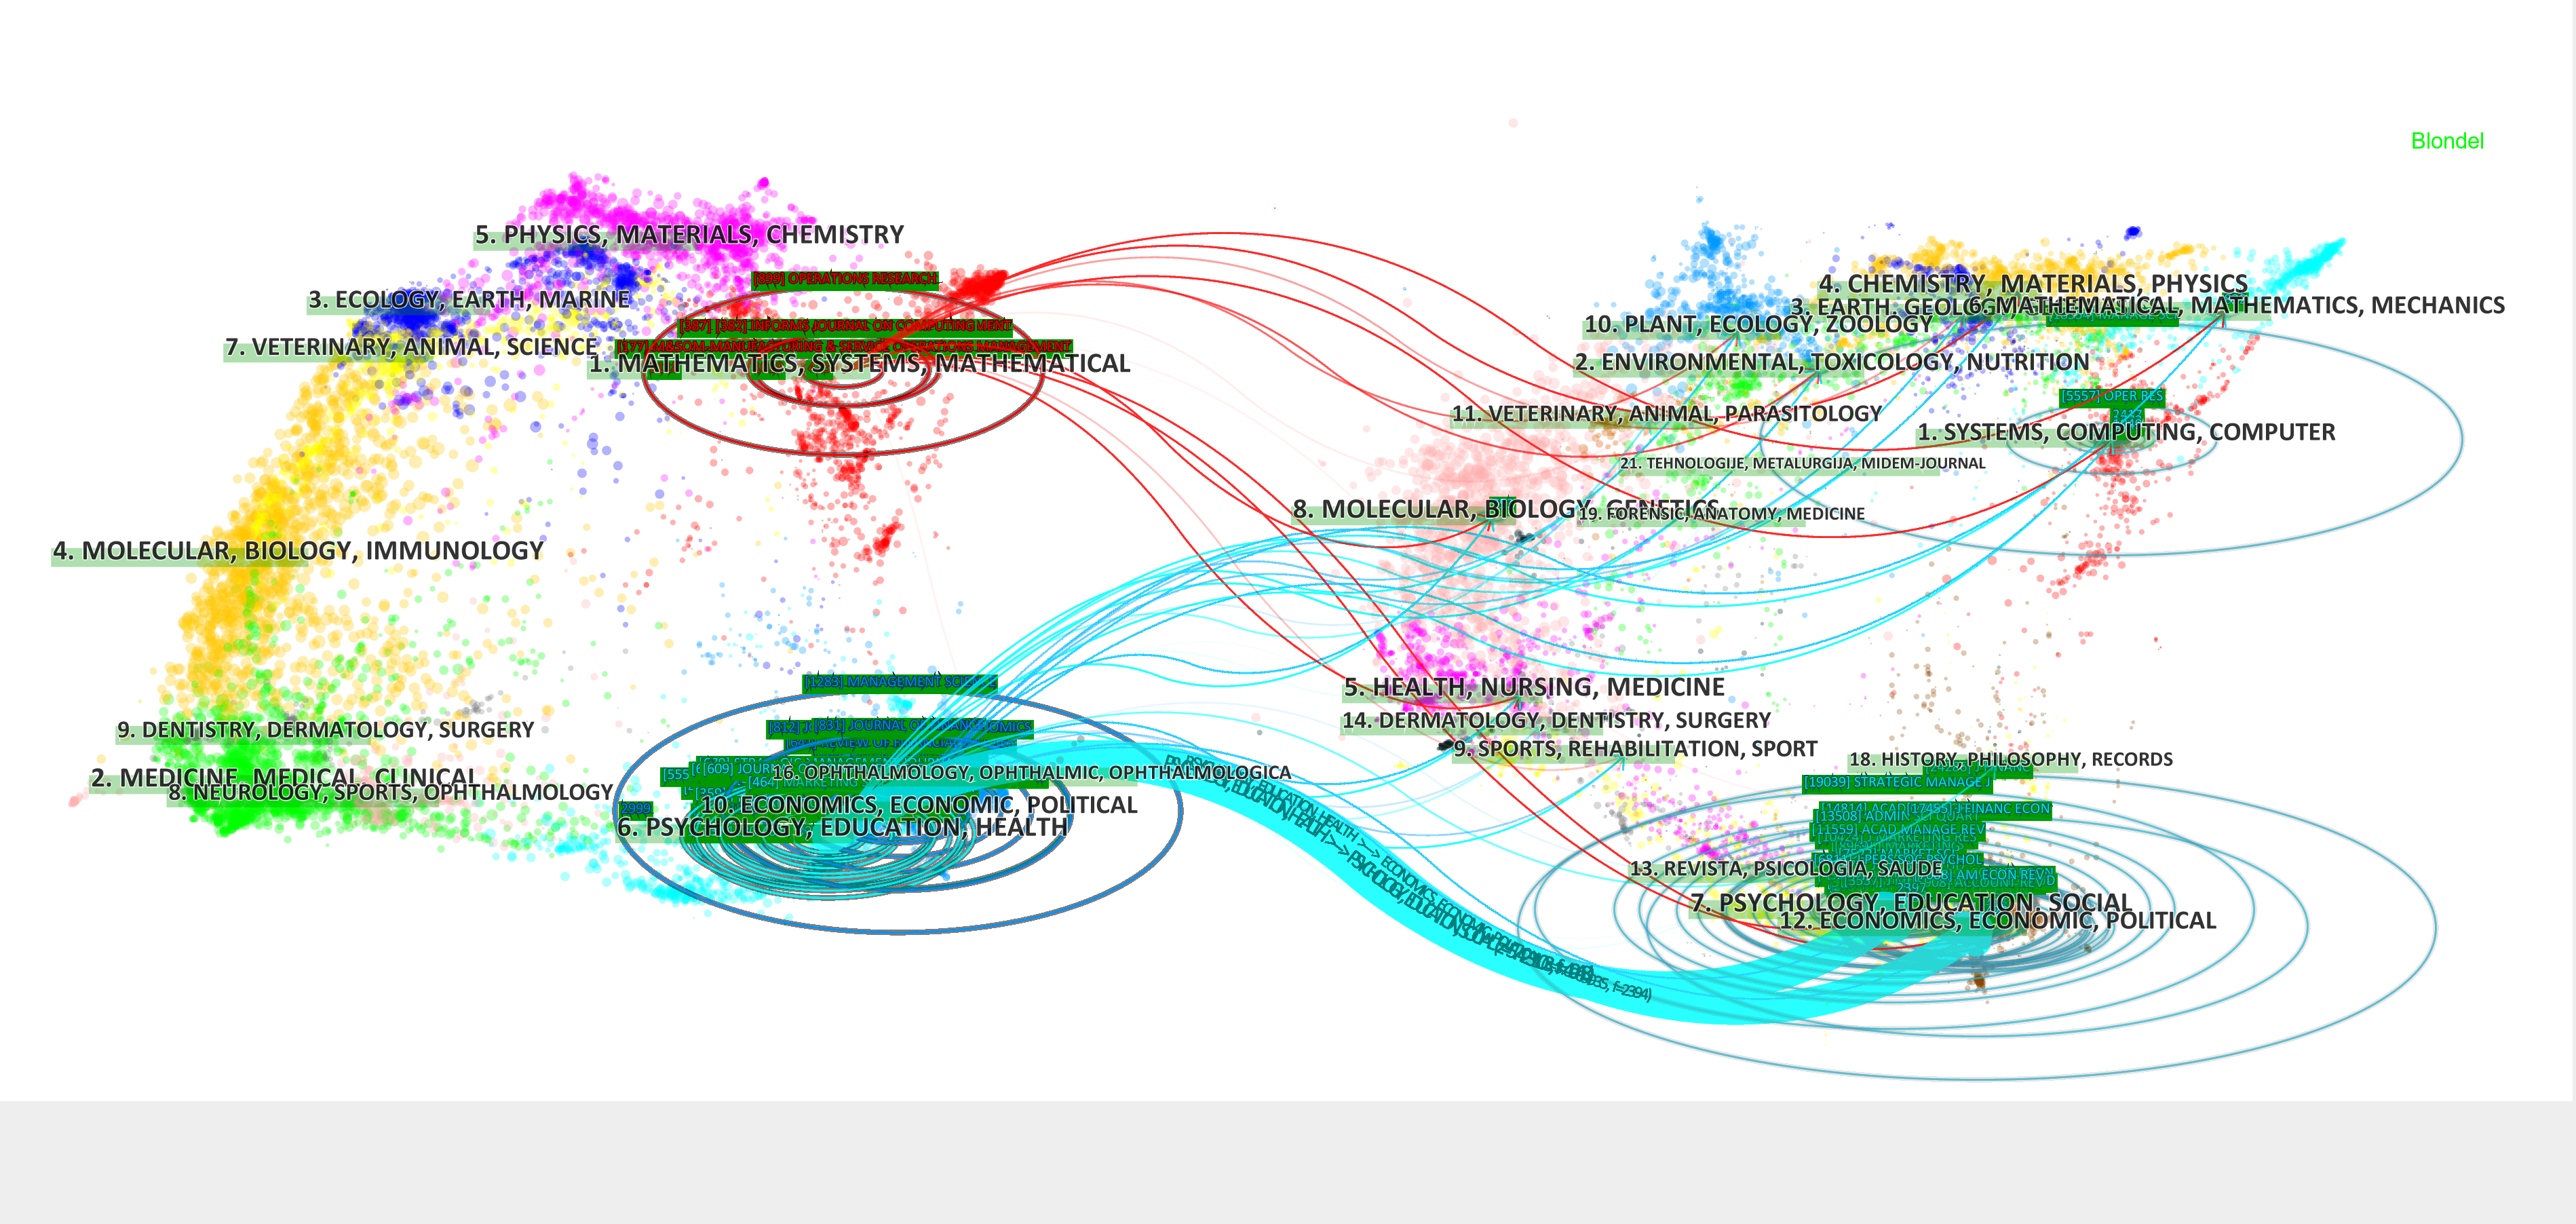
Figure 6: Dual-map overlays of the most cited articles published between 2001 and 2010 on top of the Dallas collection overlay
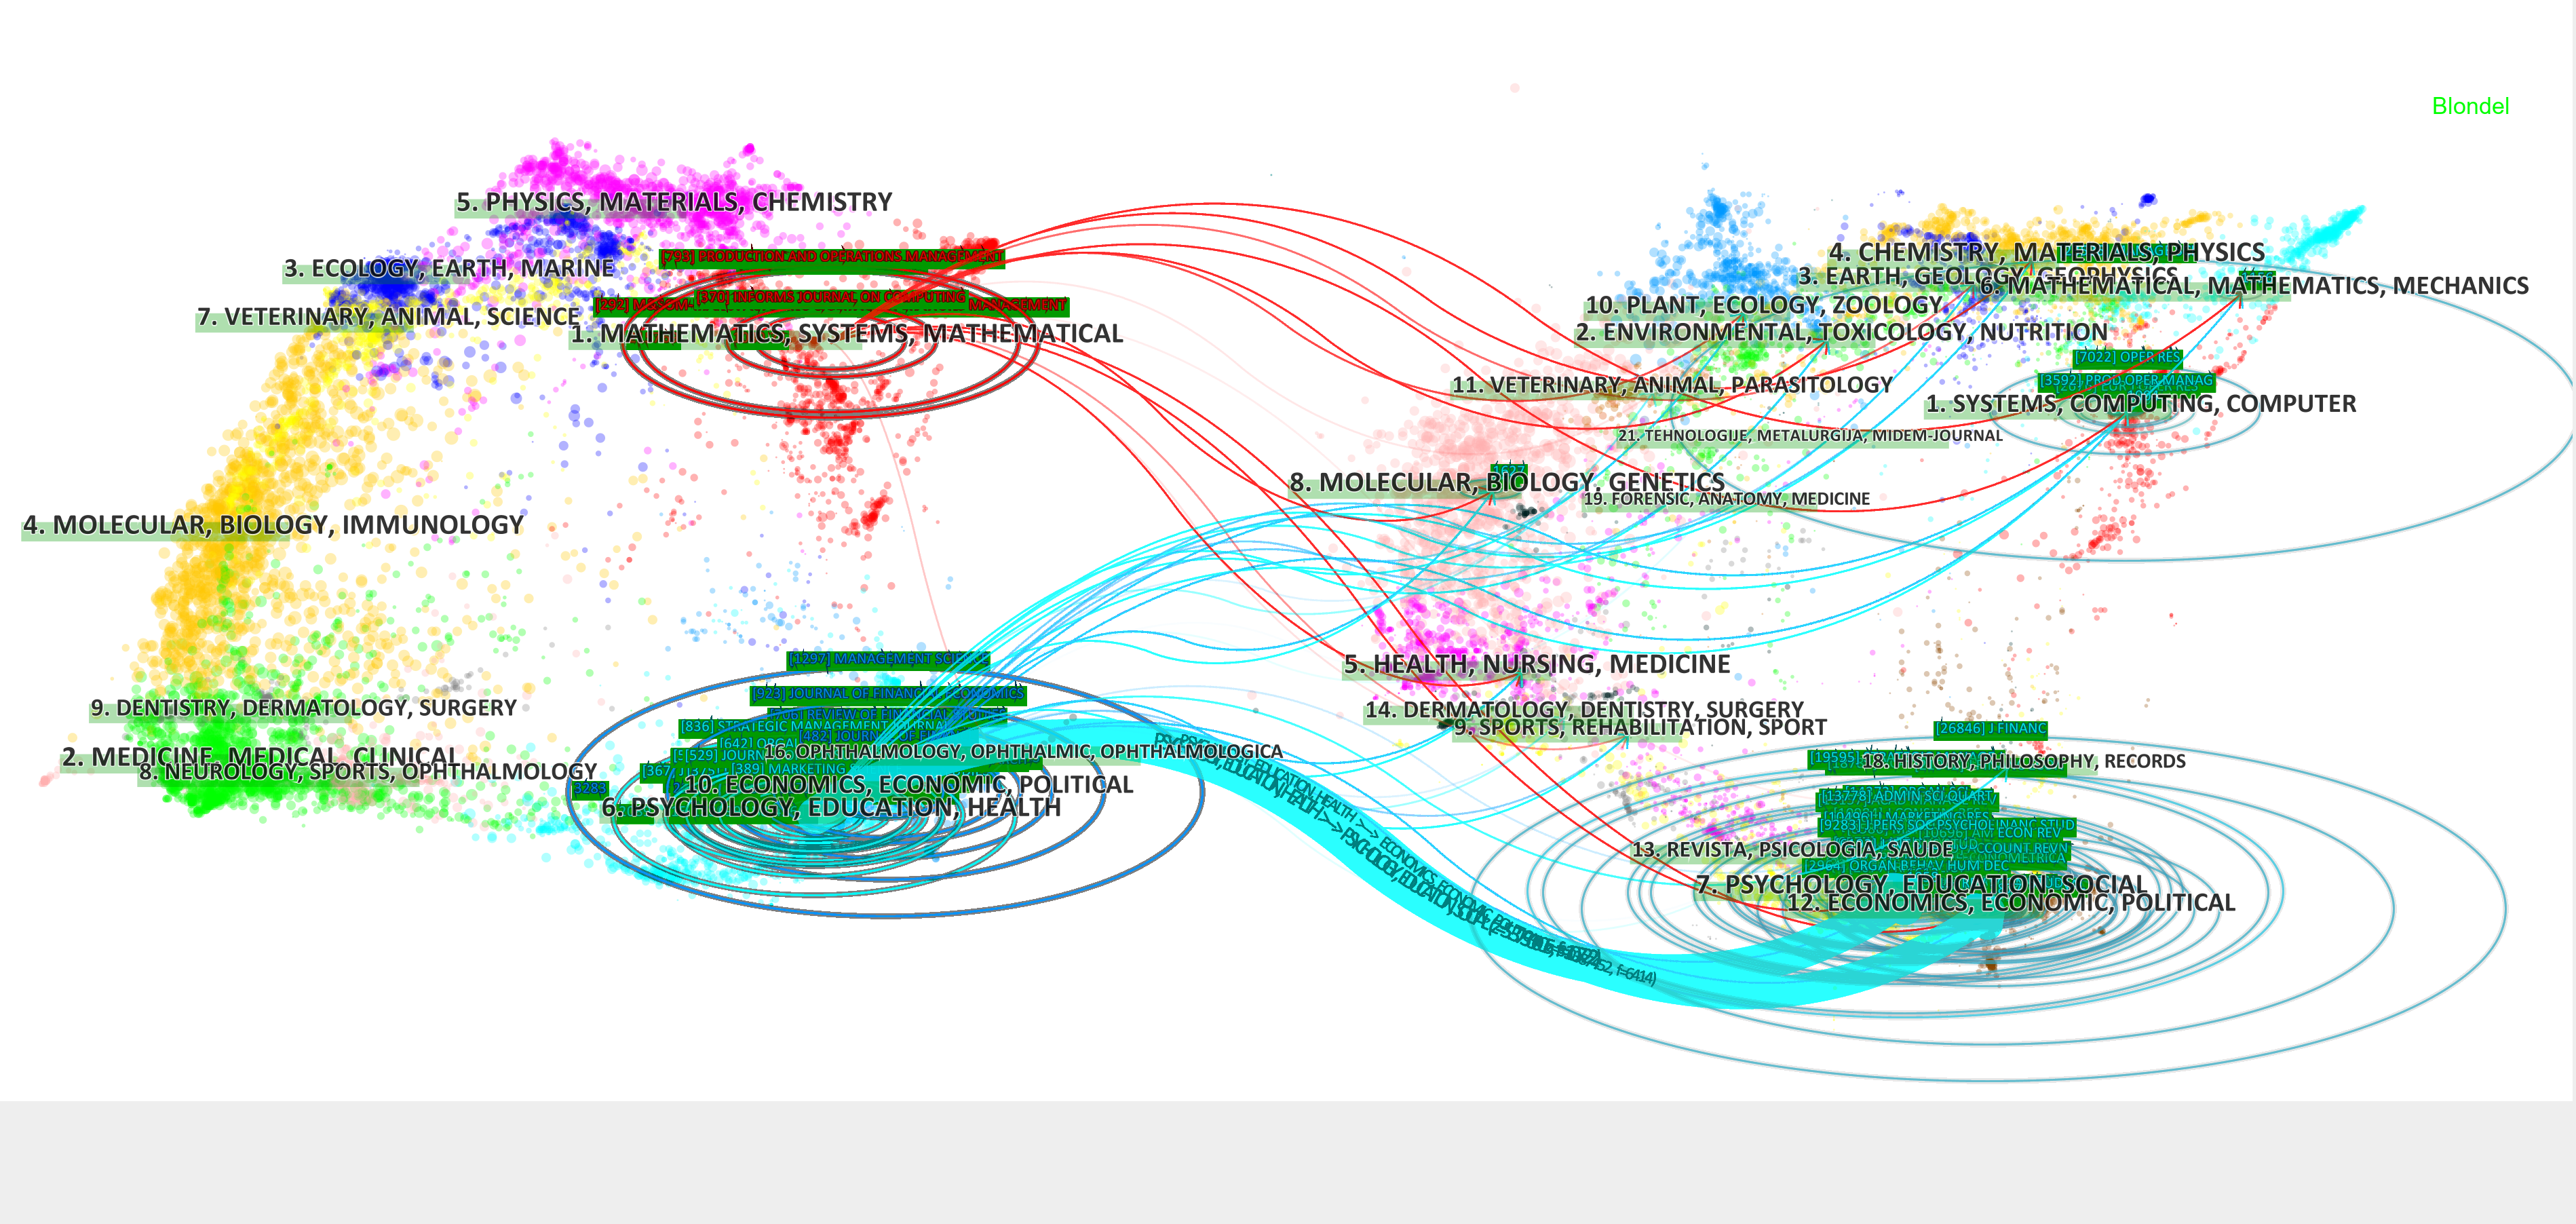
Figure 7: Dual-map overlays of the most cited articles published between 2011 and 2018 on top of the Dallas collection overlay
| Period | Citing domain | Cited domain | z-score |
|---|---|---|---|
| 1991-2000 | psychology, education, health | psychology, education, social | 5.378 |
| economics, political science | 3.036 | ||
| 2001-2010 | psychology, education, health | psychology, education, social | 5.423 |
| economics, political science | 3.031 | ||
| 2011-2018 | psychology, education, health | psychology, education, social | 5.272 |
| economics, political science | 2.671 |
Conclusion
In conclusion, we selected the Dallas collection as a guide to leading journals to define the business domain and detected the emerging trends and newest developments of the business domain from 1991 to 2018 by employing the newest version of CiteSpace. Through a multi-perspective co-citation analysis, we identified and compared the document co-citation networks, major clusters, references with the strongest bursts, and citation trends. The conclusions of this research are as follows.
By comparing the research topics from 1991 to 2000, from 2001 to 2010, and from 2011 to 2018, we find substantial changes in the research topics in the business domain. The positions of certain core topics found in the early period, 1991-2000, namely, strategic alliance, organisational mortality and organisational adaptation, have been replaced by social media, price informativeness and network communities in the most recent period, 2011-2018. Social media, represented by research on social networks such as Facebook, Twitter and micro blogs, has become the most promising research frontier at present. Traditional business research topics, including strategy research and stock research, currently remain research focuses. Through burst detection, we find that many of the most cited articles come from journals such as Administrative Science Quarterly, Journal of Accounting and Economics, Journal of Financial Economics, Strategic Management and The Review of Financial Studies; thus, these journals should attract the attention of scholars in the business domain. In addition, according to the journal dual-map overlays, there is no obvious difference in the knowledge base of business domain research over time, indicating that the knowledge base is largely unchanged.
Acknowledgements
The authors appreciate the regional editor and the anonymous reviewers for their insightful comments and constructive suggestions. This study was supported by National Natural Science Foundation of China (Nos. 71701078 and 71804091); Humanities and Social Science Foundation of the Ministry of Education of China (No. 18YJC630237); Natural Science Foundation of Shandong Province (No. ZR2019QG007); a Project of Shandong Province Higher Educational Science and Technology Program (No. J18KA342); a Project of Shandong Province Higher Educational Humanities and Social Sciences Program (No. J18RA049); the Social Science Foundation of the University of Jinan (Nos. 18YY02 and 17YB06) and a teaching and research project of the University of Jinan (No. J1808). The authors would like to thank Cyril Bernard Lucas from the United Kingdom, author of the book Atomic and molecular beams: production and collimation, for his assistance in editing and polishing the language of this paper.
About the authors
Fangfang Wei is an assistant professor in Business
School, University of Jinan, 336, West Road of Nan Xinzhuang, Jinan
250022, Shangdong Province, P.R. China. She received her PhD degree
from Tianjin University, China, and her research interests include
information science and transportation research. Fangfang Wei is the
corresponding author. She can be contacted at weifftju@163.com
Guijie Zhang works as an Associate Professor in the
School of Management Science and Engineering, Shandong University of
Finance and Economics, 7366 Erhuan Eastern Rd., Jinan 250014, Shandong
Province, P.R. China. He received his PhD degree from Harbin Institute
of Technology, China. His research interests include knowledge
diffusion, citation analysis and co-authorship network. Guijie Zhang
is also the corresponding author. His contact address is zgjzxmtx@163.com
References
- Aaltonen, A. & Seiler, S. (2015). Cumulative growth in user-generated content production: evidence from Wikipedia. Management Science, 62(7), 2054-2069. https://doi.org/10.1287/mnsc.2015.2253
- Ahlgren P., Jarneving B., & Rousseau, R. (2003). Requirement for a cocitation similarity measure, with special reference to Pearson's correlation coefficient. Journal of the American Society for Information Science & Technology, 54(6), 550-560. https://doi.org/10.1002/asi.10242
- Amit, R., & Zott, C. (2001). Value creation in e‐business. Strategic Management Journal, 22(6), 493-520. https://doi.org/10.1002/smj.187
- Braam, R. R., Moed, H. F., & Van Raan, A. F. (1991). Mapping of science by combined co‐citation and word analysis. II: dynamical aspects. Journal of the American Society for Information Science, 42(4), 252-266. https://doi.org/10.1002/(SICI)1097-4571(199105)42:4<252::AID-ASI2>3.0.CO;2-G
- Chen, C. (2014). CiteSpace II: detecting and visualizing emerging trends and transient patterns in scientific literature. Journal of the Association for Information Science and Technology, 57(3), 359-377. https://doi.org/10.1002/asi.20317
- Chen, C. (2017). Science mapping: a systematic review of the literature. Journal of Data and Information Science, 2(2), 1-40. https://doi.org/10.1515/jdis-2017-0006
- Chen, C. (2018). Eugene Garfield’s scholarly impact: a scientometric review. Scientometrics, 114(2), 489-516. https://doi.org/10.1007/s11192-017-2594-5
- Chen, C., & Leydesdorff, L. (2014). Patterns of connections and movements in dual-map overlays: a new method of publication portfolio analysis. Journal of the Association for Information Science and Technology, 65(2), 334-351. https://doi.org/10.1002/asi.22968
- Chen, C., Dubin, R., & Kim, M. C. (2014). Emerging trends and new developments in regenerative medicine: a scientometric update (2000-2014). Expert Opinion on Biological Therapy, 14(9), 1295-1317. https://doi.org/10.1517/14712598.2014.920813
- Culnan, M. J. (1987). Mapping the intellectual structure of MIS, 1980-1985: a co-citation analysis. MIS Quarterly, 11(3), 341-353. https://www.jstor.org/stable/248680
- de Melo Maricato, J., & Vilan Filho, J. L. (2018). The potential for altmetrics to measure other types of impact in scientific production: academic and social impact dynamics in social media and networks. Information Research, 23(1) papesr 780. http://InformationR.net/ir/23-1/paper780.html (Archived byWebCite® at http://www.webcitation.org/6xmqq4Nvh)
- Gandia R. M., Antonialli, F. & Cavazza, B. H. (2019). Autonomous vehicles: scientometric and bibliometric review. Transport Reviews, 39(1), 9-28. https://doi.org/10.1080/01441647.2018.1518937
- Guan, J., Yan, Y., & Zhang, J. (2017). The impact of collaboration and knowledge networks on citations. Journal of Informetrics, 11(2), 407-422. https://doi.org/10.1016/j.joi.2017.02.007
- Hou, J., Yang, X. & Chen, C. (2018). Emerging trends and new developments in information science: a document co-citation analysis (2009-2016). Scientometrics, 115(2), 869-892. https://doi.org/10.1007/s11192-018-2695-9
- Kim, H. J., Jeong, Y. K. & Song, M. (2016). Content- and proximity-based author co-citation analysis using citation sentences. Journal of Informetrics, 10(4), 954-966. https://doi.org/10.1016/j.joi.2016.07.007
- Kim, M. C. & Chen, C., (2015). A scientometric review of emerging trends and new developments in recommendation systems. Scientometrics, 104(1), 239-263. https://doi.org/10.1007/s11192-015-1595-5
- Kleinberg, J. (2003). Bursty and hierarchical structure in streams. Data Mining & Knowledge Discovery, 7(4), 373-397. https://doi.org/10.1023/A:1024940629314
- Kumar, S. & Jan, J. M. (2013). Mapping research collaborations in the business and management field in Malaysia, 1980-2010. Scientometrics, 97(3), 491-517. https://doi.org/10.1007/s11192-013-0994-8
- Liu, C. & Gui, Q. (2016). Mapping intellectual structures and dynamics of transport geography research: a scientometric overview from 1982 to 2014. Scientometrics, 109(1), 159-184. https://doi.org/10.1007/s11192-016-2045-8
- Lowry, P. B., Moody, G. D. & Gaskin, J. (2013). Evaluating journal quality and the association for information systems senior scholars' journal basket via bibliometric measures: do expert journal assessments add value? MIS Quarterly, 37(4), 993–1012. https://doi.org/10.25300/MISQ/2013/37.4.01
- Lukyanenko, R., Wiersma, Y., Huber, B., Parsons, J., Wachinger, G., & Meldt, R. (2017). Representing crowd knowledge: guidelines for conceptual modeling of user-generated content. Journal of the Association for Information Systems, 18(4), Article 2. https://doi.org/10.17705/1jais.00456
- Marshakova, I.V. (1973). System of document connection based on references (in Russian). Nauchno-Teknicheskaya Informatsiya Seriya 2-Informatsionnye Protsessy i Sistemy, (6), 3-8.
- Mingers, J. & Harzing, A. W. (2007). Ranking journals in business and management: a statistical analysis of the Harzing data set. European Journal of Information Systems, 16(4), 303-316. https://doi.org/10.1057/palgrave.ejis.3000696
- Mudambi, R., Peng, M. W., & Weng, D. (2008). Research rankings of Asia Pacific business schools: global versus local knowledge strategies. Asia Pacific Journal of Management, 25(2), 171-188. https://doi.org/10.1007/s10490-008-9086-3
- Narver J. C., & Slater, S. F. (1990). The effect of a market orientation on business profitability. Journal of Marketing, 54(4), 20-35. https://doi.org/10.1177/002224299005400403
- Newman, M. E. J. (2006). Modularity and community structure in networks. Proceedings of the National Academy of Sciences, 103(23), 8577-8582. https://doi.org/10.1073/pnas.0601602103
- Porter, A. L., & Cunningham, S. W. (2005). Tech mining: exploiting new technologies for competitive advantage. Hoboken, NJ: John Wiley & Sons, Inc. https://doi.org/10.1002/0471698466
- Rossetto, D. E., Bernardes, R. C., & Borini, F. M. (2018). Structure and evolution of innovation research in the last 60 years: review and future trends in the field of business through the citations and co-citations analysis. Scientometrics, 115(3), 1329-1363. https://doi.org/10.1007/s11192-018-2709-7
- Rousseeuw, P. J. (1987). Silhouettes: a graphical aid to the interpretation and validation of cluster analysis. Journal of Computational & Applied Mathematics, 20(20), 53-65. https://doi.org/10.1016/0377-0427(87)90125-7
- Small, H. (1973). Co‐citation in the scientific literature: a new measure of the relationship between two documents. Journal of the American Society for information Science, 24(4), 265-269. https://doi.org/10.1002/asi.4630240406
- Wei F., Zhang, G., Feng, Y., Liu, L., & Shao, Z. (2017). A co-authorship network-based method for understanding the evolution of a research area: a case of information systems research. Malaysian Journal of Library & Information Science, 22(2), 1-14. https://doi.org/10.22452/mjlis.vol22no2.1
- White, H. D., & Griffith, B. C. (1981). Author co-citation: a literature measure of intellectual structure. Journal of the American Society for information Science, 32(3), 163-171. https://doi.org/10.1002/asi.4630320302
- Wu, C., Hill, C., & Yan, E. (2017). Disciplinary knowledge diffusion in business research. Journal of Informetrics, 11(2), 655-668. https://doi.org/10.1016/j.joi.2017.04.005
- Zhang, G., Feng, Y., Yu, G., Liu, L. & Hao, Y. (2017). Analyzing the time delay between scientific research and technology patents based on the citation distribution model. Scientometrics, 111(3), 1287-1306. https://doi.org/10.1007/s11192-017-2357-3
- Zhang, G., Liu, L., & Wei, F. (2019). Key nodes mining in the inventor–author knowledge diffusion network. Scientometrics, 118(3), 721-735. https://doi.org/10.1007/s11192-019-03005-2
- Zhu, J. & Hua, W. (2017). Visualizing the knowledge domain of sustainable development research between 1987 and 2015: a bibliometric analysis. Scientometrics, 110(2), 893-914. https://doi.org/10.1007/s11192-016-2187-8
How to cite this paper
Appendix
| Categories | Journal | Impact factor | ISSN | Publisher |
|---|---|---|---|---|
| Business; Management | Academy of Management Journal | 6.700 | 0001-4273 | Academy of Management |
| Business, Management | Academy of Management Review | 8.855 | 0363-7425 | Academy of Management |
| Business, Finance | Accounting Review | 2.245 | 0001-4826 | American Accounting Association |
| Business; Management | Administrative Science Quarterly | 5.878 | 0001-8392 | Sage Publications |
| Management; Information science & library science | Information Systems Research | 2.301 | 1047-7047 | Informs |
| Business, Finance; Economics | Journal of Accounting and Economics | 3.282 | 0165-4101 | Elsevier Science |
| Business, Finance | Journal of Accounting Research | 4.542 | 0021-8456 | Wiley |
| Business | Journal of Consumer Research | 3.535 | 0093-5301 | Oxford University Press |
| Business, Finance; Economics | Journal of Finance | 5.397 | 0022-1082 | Wiley |
| Business, Finance; Economics | Journal of Financial Economics | 5.162 | 0304-405X | Elsevier Science |
| Business; Management | Journal of International Business Studies | 6.198 | 0047-2506 | Palgrave Macmillan Ltd |
| Business | Journal of Marketing | 7.338 | 0022-2429 | American Marketing Association |
| Business | Journal of Marketing Research | 3.854 | 0022-2437 | American Marketing Association |
| Operations research & management science | Journal of Operations Management | 4.899 | 0272-6963 | Elsevier Science |
| Operations research & management science | Journal on Computing | 1.392 | 1091-9856 | Informs |
| Operations research & management science | Management Science | 3.544 | 0025-1909 | Informs |
| Operations research & management science | Manufacturing & Service Operations Management | 1.795 | 1523-4614 | Informs |
| Business | Marketing science | 2.794 | 0732-2399 | Informs |
| Information systems, Computer science | MIS Quarterly | 5.430 | 0276-7783 | Carlson School of Management, University of Minnesota |
| Operations Research & Management Science | Operations Research | 2.263 | 0030-364X | Informs |
| Management | Organization Science | 3.027 | 1047-7039 | Informs |
| Operations research & management science | Production and Operations Management | 1.772 | 1059-1478 | Wiley |
| Business, Finance; Economics | Review of Financial Studies | 4.270 | 0893-9454 | Oxford University Press |
| Business; Management | Strategic Management Journal | 5.482 | 0143-2095 | Wiley |
Table 2: Top 20 references with the strongest citation bursts during 1991-2018 (one year per slice, selecting the top 100 levels of the most cited items from each slice
Table 3: Top 20 references with the most recent bursts until 2018 (one year per slice, selecting the top 100 levels of the most cited items from each slice)