Information practices and competences that evidence information capability in a company
Marta Zárraga-Rodríguez
University of Navarra-ISSA, Pamplona, Spain
Maria Jesús Álvarez
University of Navarra-Tecnun, San Sebastian, Spain
Introduction
The efficient use and management of information, that is, information capability, is a source of competitive advantage for a company. A capability is defined and enacted through the application of a set of competences, and organizations only attain a sustainable competitive advantage if they can assemble a set of competences (Ashurst, Doherthy and Peppard, 2008). There is not a commonly adopted definition of competence (Peppard and Ward, 2004), but it is commonly accepted that a capability is underpinned by a set of competences. Furthermore, capability development is evidenced by a set of practices commonly adopted by the organization.
Marchand, Kettinger and Rollins (2000) proposed the information orientation model, in which they defined key information practices and found empirical evidence to support a causal relationship between information-related practices and improved business performance.
Later studies proposed more information practices to be taken into account and extended the original set of practices proposed by Marchand et al. (2000). The present study offers an in-depth exploration of the common underlying dimensions to these practices, and it uncovers and defines six information competences that support information capability.
Once a company has developed information capability, it seems reasonable to expect a higher quality of information is managed. It is generally accepted that having reliable and complete information has been always a key factor in making the right decision. Therefore, quality information leads to the achievement of higher levels of efficiency and better results. The need for quality information is additionally enhanced nowadays due to the changeable world in which companies compete.
In order to obtain more in-depth knowledge about information capability and its outcome in a company (i.e., quality information) we also explore which information competences can be expected to have a greater influence on the quality of the information managed.
The rest of this paper is organized as follows. The next section provides the theoretical framework. It is followed by a presentation of the research methodology. The final section presents and discusses the summary of empirical findings, and the paper ends by presenting the conclusions derived from the study.
Theoretical framework
The resource based view in organizational theory states that the key to the strategic success of a company lies in the strategic use the company makes of its resources. This theory deals with organizational capabilities and considers a capability as a source of competitive advantage for the company, which allows the generation of value and differentiation through the combined use of a series of resources (Peppard and Ward, 2004; Ashurst et al., 2008). We consider that a company has information capability when the use and management of information is so efficient that it is a source of competitive advantage for the company.
It is difficult to observe capabilities, but we can detect practices that evidence their presence. According to Ashurst et al. (2008), practices, which are described as a set of socially defined ways of doing things in order to achieve an outcome, are more concrete and observable than capabilities.
Marchand et al. (2000) proposed the information orientation model to explain how different information-related practices are needed to improve business performance. They found empirical evidence to support the model, which was used in later studies (Choo et al., 2006; Hwang, 2011; Mithas, Ramasubbu and Sambamurthy, 2011; Kettinger and Marchand, 2011). Using a powerful set of statistical techniques Marchand et al. (2000) defined key information practices and pooled them into three major groups. They proposed a set of fifteen practices that can be observed and measured in a company and a set of three information constructs: 1) information management, where practices related to the management of the information life cycle are considered, 2) information technologies, where practices related to the integration of information technology into day-to-day business are considered, and 3) information culture, which considers practices where the behaviour and values assumed by employees in relation to the use and management of information are shown.
There exist several studies dealing with some of the practices defined as evidences of information capability development under the information orientation model (Sabherwal and Chan, 2001; Chou, Chan, Cheng and Tsai, 2007; Anantatmula, 2008; Lai, Li, Wang and Zhao, 2008; Sharma, Bhagwat and Dangayach, 2008; Song, Nason and Di Benedetto, 2008; Coltman, Devinney and Midgley, 2011; Carmichael, Palacios-Marques and Gil-Pechuan, 2011; among others, cited in Zárraga-Rodríguez and Alvarez, 2013). However, these studies do not consider the set of practices defined in the information orientation model as a whole. Taking into account those studies, Zárraga-Rodríguez and Alvarez (2013) completed the original set of practices pointed out by Marchand et al. (2000) and addressed three more practices to be considered when assessing the use and management of information within a company.
One of the new practices suggested by Zárraga-Rodríguez and Alvarez (2013) deals with the dissemination of information (IM_D), which would be part of the information management construct. The other two new practices suggested deal with the use of information technologies as support for information sharing (IT_ISS) and as strategy support (IT_SS). These practices are pooled into the information technologies construct. In this study we use the set of eighteen practices when assessing information capability.
A capability implies the combined use of a series of competences, and a competence is defined as the ability of the organization to deploy a combination of resources and achieve a given target using the processes of the organization (Amit and Shoemaker, 1993 cited by Peppard and Ward, 2004; Ashurst et al., 2008; Bharadwaj, 2000). In this study we consider the common underlying dimensions to the information practices to be the information competences.
Although the terms data and information are often used synonymously, in practice managers differentiate information from data intuitively and describe information as data that has been processed (Lin, Gao, Koronios and Chanana, 2007; Pipino, Lee and Wang, 2002). Therefore, it could be reasonable to suppose that practices associated with the information management construct can be pooled into two competences: the data management competence, which would comprise practices related to the management of data, and the information management competence, which would comprise practices related to the management of information. We present the first hypothesis of this work as follows:
H1: information practices related to the management of the information life cycle can be pooled in two main competences.
The information technologies construct refers to practices related to the integration of information technology into day-to-day business. The concept of day-to-day business comprises both the operational and strategic levels. It could therefore be reasonable to suppose that practices associated with the information technologies construct can be pooled into two competences: the operational information technology use competence, which would comprise practices related to the use of information technologies as support at the operational level, and the strategic information technology use competence, which would comprise practices related to the use of information technologies as support at the strategic level. The second hypothesis of this work is:
H2: information practices related to the integration of information technology into day-to-day business can be pooled in two main competences.
The information culture construct considers practices where behaviour and values assumed by employees in relation to the use and management of information are shown. Some behaviour and values can be naturally shared, assumed and internalized by the people in the organization, but other behaviour and values may to a certain extent have to be forced from the outside. Hence, it could be reasonable to suppose that practices associated with the information culture construct can be pooled into two competences: the internally assumed culture competence, which would comprise behaviour and values that are voluntary shared, assumed and internalized by the people in the organization and involve a higher-level culture in relation to the use and management of information, and the instilled culture competence, which would comprise values and behaviour shared as a result of the efforts made by managers to ensure effective communication in the organization. These are behaviour or values that are conditioned by and to a certain extent forced from the outside. Our third hypothesis is:
H3: information practices where behaviour and values assumed by employees in relation to the use and management of information are shown can be pooled in two main competences.
A capability is embedded within the organization and the presence and effectiveness of the capability is reflected in business performance (Peppard and Ward, 2004). The information orientation model proposed by Marchand et al. (2000) provides the theoretical foundation for linking information capability and job performance, and is supported by other studies (Owens, Wilson and Abell, 1995; Sila and Ebrahimpour, 2005; Ooi, Lin, Tan and Chong, 2011; Laosirihongthong, The and Adebanjo, 2013). There also exist many studies that provide evidences for linking information quality and job performance (see DeLone and McLean, 1992; DeLone and McLean, 2003; Petter, DeLone and McLean, 2008; Madnick, Wang, Lee and Zhu, 2009; Gorla, Somers and Wong, 2010; among others).
In this study we are focused on the link between information capability and information quality. It is not unreasonable to suppose that quality information could be considered an expected output when information is used and managed in an efficient way, that is, when a company has information capability. In particular we explore which information competence can be expected to have influence on the quality of the information managed. The fourth hypothesis of this work is:
H4: information competences affect information quality.
| Information management construct | Information technologies construct | Information culture construct |
|---|---|---|
| IM_S: Sense the information* | IT_OS: Employ information technology to support daily operations* | IC_I: Prevent the manipulation or hiding of information* |
| IM_C: Collect the information* | IT_BPS: Employ information technology for business process support* | IC_F: Establish formal and reliable sources of information* |
| IM_O: Organize the information* | IT_IS Employ information technology for innovation support* | IC_C: Transmit information about the performance of the company to all employees* |
| IM_P: Process the information* | IT_MS: Employ information technology for management support* | IC_S: Exchange sensitive and non-sensitive information collaboratively* |
| IM_M: Maintain the information* | IT_SS: Employ information technology for strategy support | IC_T: Trust each other* |
| IM_D: Disseminate the information | IT_ISS: Employ information technology for information sharing support | IC_P: Be concerned about obtaining and applying new information* |
| * Practices proposed by Marchand et al. (2000) | ||
Table 1 shows the meaning of the information practice codes in Figure 1. Observe that the set of practices considered in the information capability model in Figure 1 reflects not only those proposed by Marchand et al. (2000) but also the new ones proposed by Zárraga-Rodríguez and Alvarez (2013)
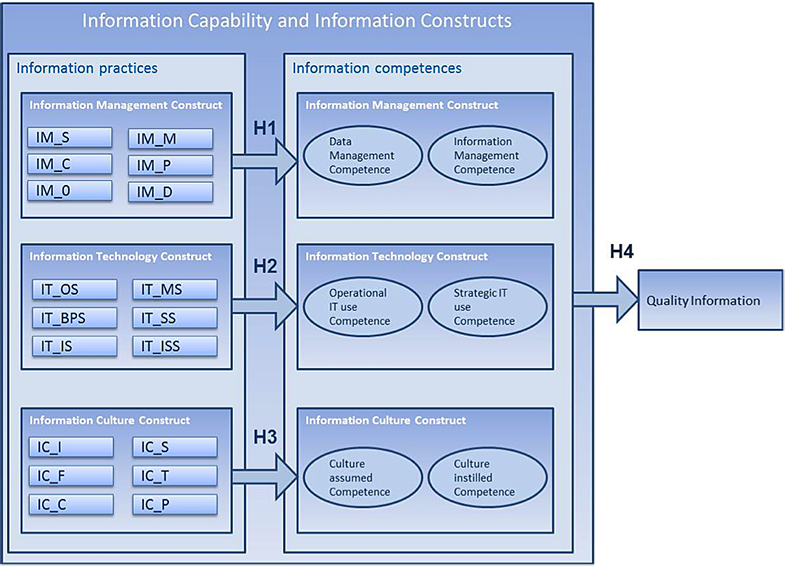
Figure 1 summarises the model we want to confirm, which is based in the original information orientation model proposed by Marchand et al. (2000); our model provides more in-depth knowledge about the information practices and the information competences that evidence information capability in a company.
In order to measure the quality of the information managed, the fact that information quality is a multidimensional construct should be taken into account. Therefore, we focused on establishing a set of attributes that information had to fulfil in order to be considered quality information, and we used them when we defined the statements in the questionnaire survey. We selected the information quality attributes that have been the most extensively studied; they are shown in Table 2.
| Information attributes | References |
|---|---|
| Accuracy Consistency Believability Relevance Completeness Accessibility Timely for use |
Huh, Keller, Redman and Watkins (1990) Wand and Wang (1996) Gable, Sadera and Chan (2008) Sedera, Gable and Chan (2004) Wang and Strong (1996) Doll, Xia and Torkzadeh (1994 DeLone and McLean (1992) Nelson, Todd and Wixom (2005) Gorla et al. (2010) |
Research method
This section presents the research method applied in the exploratory study. The data collection method used was a questionnaire survey. The final instrument contained four main sections: practices related to the management of the information life cycle (that is, the information management section), practices related to the integration of information technology in day-to-day business (the information technology section), practices related to behaviour and values assumed by employees and displayed when using information (the information culture section), and information quality dimensions (the information quality section).
The instrument was tested by faculty members, senior managers and Euskalit members in order to make sure the items’ meanings were clear and that the questionnaire was easy to answer (Euskalit is the Basque Foundation for Excellence, a private non-profit organization founded in 1992 by the Department of Industry and Energy of the Basque Government, which supports the Basque Government’s policy of promoting quality in the Basque Country).
A total of 27 statements that had been developed from a literature review were presented in the questionnaire. Respondents had to indicate their agreement to statements on scale of 1 (strongly disagree) to 10 (strongly agree). In the information management section, there were 7 items, in the information technology section there were 6 items, in the information culture section there were 7 items, and in the information quality section there were 7 items.
The questionnaire was administered via a web page, which participants accessed via a link included in an e-mail they received. Therefore we used a self-administered survey technique which avoids the interviewer error or bias and reduces the cost of reaching the sample. However, one of the most important disadvantages of self-administered surveys is their low response rate. In order to improve the response rate a covering letter of appeal was written. The covering letter explained the objective of the study, stressed why the study was important and advanced the time needed to fulfil it. It also assured confidentiality and provided the name and the contact e-mail of the lead researcher to allow participants to verify the legitimacy of the questionnaire. After one week a second reminder e-mail was sent.
Our target population for the study was companies committed to total quality management. We focused on these companies because total quality management is considered to be an information intensive management system (Matta, Chen and Tama, 1998). Thus, it seems reasonable to expect that companies that have obtained quality awards have also promoted information capability development and that information practices are actually common practices in these companies.
Our empirical study was carried out in the Basque Country in northern Spain. The Basque region is the European region with the highest density of quality awards (Heras-Saizarbitoria, Miramon and Casadesús, 2012). The Basque government provides quality awards according to points obtained by the companies during external evaluation, which employs the scoring system used by the European model of excellence. The participants were selected according to their commitment to quality management and were contacted by Euskalit, who sent an e-mail with the covering letter and the link to the questionnaire to 292 companies that had received a quality award; the respondents were managers, who reported their agreement with each statement. 46 of them responded, yielding a response rate of 15 per cent.
A low response rate can lead to a bias in the sample and therefore can undermine the generalizability or the external validity of the results. It is therefore important to assess the non-response bias. The most commonly used methods to assess non-response bias are the comparison of respondents and non-respondents and the comparison of early to late respondents using statistical tests (Miller and Smith, 1983; Forza, 2000; Lindner, Murphy and Briers, 2001; King and He, 2005; Clottey and Grawe, 2014; among others).
In this study it was difficult to assess the non-response bias by comparing respondents and non-respondents because relevant data necessary to sample non respondents were not available. Following the protocol proposed by Lindner et al. (2001), we defined late respondents as the later 50% of the respondents and we assessed non-response bias by comparing responses of each group on multiple survey items using a t-test comparing group means. We found no statistically significant differences (p-values = >0.05) between the early responders and late responders. However, the small size of the groups of early and late respondents threatens the statistical power of the test to detect differences between them.
Our data analysis had two main objectives. First, we wanted to explore the common underlying dimensions (factors) of the data obtained through the questionnaire. We performed a factor analysis in order to summarize the information obtained in a smaller set of new composite dimensions with a minimum of information loss. Second, we want to explore the relationship between information quality and practices related to the management of the information life cycle, practices related to the integration of information technology in day-to-day business, and practices related to behaviour and values assumed by employees and displayed when using information. Using the new variables obtained in the first step, we used multiple regression analysis to examine these relationships.
Results and discussion
This section presents the key findings of the study. We report our findings in terms of the two main objectives of the study. First we present a factor analysis of the questionnaire items pooled into four domains: information management, information technologies, information culture and information quality. Then we analyse the relationship between the factors identified by responses in the four domains using multiple regression analysis.
Factor analysis
The variables used in the factor analysis are on the metric scale and correspond to the items from the questionnaire pooled into four domains: information management, information technologies, information culture and information quality. The correlation matrix between each set of variables justifies the application of factor analysis since there are a substantial number of correlations greater than 0.3.
The statistical procedure used to obtain the factor solution was the analysis of main components. To determine the number of factors to be extracted we used a combination of two criteria: the latent root criterion (considering the factors that have latent roots or eigenvalues greater than 1) and the criterion of percentage of variance (setting the percentage of the total variance that factors should represent).
Although among the social sciences a solution that represents 60% of the total variance is considered satisfactory, in this paper we have established an upper threshold. Therefore, when choosing the number of factors to consider, if the eigenvalue of the factor is greater than 1.0, the factor is taken directly into account, and if the eigenvalue of the factor is smaller than 1.0 but the cumulative variance improvement is significant when we include it, then the factor is considered. After selecting the number of factors to be considered, in order to correctly interpret the factors an orthogonal rotation with the varimax method was performed. To decide which factor for each variable should be included, we considered factor loadings above 0.5 as our cut-off point, and they are presented in bold.
To check the internal consistency of the scales, Cronbach's alpha was calculated and it was always within the acceptable range of 0.7 to 0.95.
| Factors and items | 1 | 2 |
|---|---|---|
| Information management-after (α=0.9) | ||
| My organization has defined processes to ensure that the information is available to stakeholders as needed (people can find it easily). | 0.768 | 0.474 |
| My organization has defined processes to have updated databases so as to ensure that people are using the best information available. | 0.842 | 0.392 |
| My organization has defined processes that ensure the distribution and exchange of information and the scope to be covered. | 0.923 | 0.130 |
| Information management-before (α=0.85) | ||
| My organization cares about knowing the information needed by employees, customers, suppliers and other stakeholders and systematically collects it. | 0.435 | 0.752 |
| My organization systematically gathers information from the environment (competitors, legislation, markets) and the inner workings, filtering it to prevent overload. | 0.483 | 0.625 |
| My organization has defined processes for competitive and technology surveillance and it has defined processes that facilitate the detection and identification of information to anticipate problems with suppliers and partners. | 0.082 | 0.916 |
| My organization has defined processes to transform data into useful information that can be used for decision-making. | 0.426 | 0.749 |
| Eigenvalues | 4.593 | 0.919 |
| Cumulative percentage of variance | 65.6 | 78.7 |
Table 3 shows the results of the exploratory factor analysis for the information management domain. The results show the two components that accounted for 78.7% of the common variance: information management-before and information management-after. As mentioned previously, although the terms data and information are often used synonymously, in practice managers differentiate information from data intuitively and describe information as data that has been processed (Lin, 2007; Pipino et al., 2000). Therefore, information management-before refers to the perception that the organization has processes for data management, and information management-after refers to the perception that the organization has processes for information management. Therefore, H1 (information practices related to the management of the information life cycle can be pooled in two main competences) is confirmed.
| Factors and items | 1 | 2 |
|---|---|---|
| information technology use - strategic (α=0.89) | ||
| My organization uses information technology to automate and integrate the management of business processes, to facilitate people management and to interact and strengthen relationships with stakeholders. | 0.759 | 0.473 |
| My organization uses information technology to facilitate the development and exchange of new ideas. This also includes new products and services. | 0.876 | 0.238 |
| My organization uses information technology in competitive and technology surveillance, to anticipate possible outcomes of decisions before they are made, to predict values of indicators, etc. | 0.785 | 0.333 |
| My organization uses information technology to facilitate the sharing and exchange of information and to automate document location. | 0.785 | 0.363 |
| information technology use - tactical (α=0.73) | ||
| My organization uses information technology to support daily operations in order to improve individual productivity. | 0.283 | 0.864 |
| My organization uses information technology to facilitate the monitoring and analysis of internal and external business aspects (indicators) to assist decision-making. | 0.372 | 0.780 |
| Eigenvalues | 4.047 | 0.625 |
| Cumulative percentage of variance | 67.5 | 77.9 |
Table 4 shows the results of the exploratory factor analysis for the information technology domain. The results show the two components that accounted for 77.9% of the common variance: information technology use - strategic and information technology use - tactical. information technology use - tactical refers to the perception that the organization uses information technology as support at the operational level, and information technology use - strategic refers to the perception that the organization uses information technologies as support at the strategic level. Therefore, H2 (information practices related to the integration of information technology into day-to-day business can be pooled in two main competences) is confirmed.
| Factors and items | 1 | 2 |
|---|---|---|
| information culture - instilled (α=0.88) | ||
| My organization values people sharing sensitive information rather than manipulating or hiding it for their own benefit. | 0.753 | -0.332 |
| In my organization there are formal and reliable sources of information and the organization members use them. | 0.877 | -0.208 |
| My organization reveals information about the performance of the company to all employees in order to influence and direct individual performance and consequently the company's performance. | 0.910 | 0.036 |
| In my organization the free exchange of sensitive and non-sensitive information in a collaborative way is common practice among team members and between areas. | 0.836 | -0.238 |
| In my organization the free exchange of sensitive and non-sensitive information in a collaborative way with external stakeholders (customers, partners, suppliers, society, etc.) is common practice. | 0.660 | -0.285 |
| information culture - internally assumed (α=0.79) | ||
| Members of my organization trust each other enough to talk about failures and mistakes in an open and constructive manner and without fear of unfair repercussions. | 0.179 | -0.874 |
| Members of my organization show concern and preoccupation with obtaining and applying new information that enables them to respond quickly to changes and that enables them to promote innovation in products and services. | 0.195 | -0.901 |
| Eigenvalues | 3.965 | 1.271 |
| Cumulative percentage of variance | 56.7 | 74.8 |
Table 5 shows the results of the exploratory factor analysis for the information culture domain. The results show the two components that accounted for 74.8% of the common variance: information culture-instilled and information culture-internally assumed. Information culture-instilled refers to the perception that employees share a set of values and behaviour as a result of the efforts made by managers to ensure effective communication in the organization; these are behaviour or values that are conditioned by and to a certain extent forced from the outside. Information culture-internally assumed refers to the perception that there are also behaviour and values that are shared, assumed and internalized by the people in the organization and involve higher-level culture in relation to the use and management of information. Therefore, H3 (information practices where behaviour and values assumed by employees in relation to the use and management of information are shown can be pooled in two main competences) is confirmed.
| Items | |
|---|---|
| Information quality (α=0.94) | |
| I can easily locate and access the information I need. | |
| The information is integrated and coordinated (although I make use of different sources the information does not change). | |
| Information is relevant, clear, and concise, and it is processed (not just data). | |
| I get the information I need to perform my job. | |
| The information I receive is accurate. | |
| I can trust the information I receive. | |
| I receive the information in a timely manner. | |
| Eigenvalues | 5.244 |
| Cumulative percentage of variance | 74.9 |
Table 6 shows the results of the exploratory factor analysis for the information quality domain. The results show that one component accounted for 74.9% of the common variance: information quality; it is also the only component with an eigenvalue >1.0. Information quality refers to the perception that there are some quality dimensions that are usually perceived in the information used and managed.
Multiple regression analysis
From the factor analysis, the original set of variables was replaced with new ones created from additive scales. All the variables that loaded high on one factor were combined, and the average score of the variables was used as a substitution variable. As a result we obtained a total of seven variables to consider: information management - before (IMB) and information management -after (IMA), which are associated with the information management domain; information technology use - strategic (ITS) and information technology use - tactical (ITT), which are associated with the information technology domain; information culture - instilled (ICI) and information culture - internally assumed (ICIA), which are associated with the information culture domain; and information quality (IQ), which is associated with the information quality domain.
We wanted to explore the relationship between the set of the six predictor variables (information management-before, information management-after, information technology use - strategic, information technology use - tactical, information culture - instilled and information culture - internally assumed) and the dependent variable, namely the quality of the information managed.
Using multiple regression analysis, we were able to get a model that allowed us to explain how the independent or predictor variables influenced the dependent variable. We first employed the best subsets regression method to determine which predictor (independent) variables should be included in the multiple regression model. This method allowed us to identify the best-fitting regression models that could be constructed with the specified predictor variables. We computed this method using the statistical software program Minitab.
| Vars | R2 | Adj. R2 | Mallow's Cp | S | IMB | IMA | ITT | ITS | ICI | ICIA |
|---|---|---|---|---|---|---|---|---|---|---|
| 1 | 60.4 | 59.5 | 20 | 0.73453 | X | |||||
| 1 | 47.5 | 46.3 | 40.3 | 0.84621 | X | |||||
| 2 | 69..3 | 67.9 | 8.1 | 0.65432 | X | X | ||||
| 2 | 64.9 | 63.2 | 15.0 | 0.70012 | X | X | ||||
| 3 | 72.8 | 70.8 | 4.7 | 0.62364 | X | X | X | |||
| 3 | 71.6 | 69.5 | 6.6 | 0.63742 | X | X | X | |||
| 4 | 73.6 | 71.1 | 5.3 | 0.62100 | X | X | X | X | ||
| 4 | 73.1 | 70.5 | 6.1 | 0.62693 | X | X | X | X | ||
| 5 | 74.5 | 71.3 | 6.0 | 0.61850 | X | X | X | X | X | |
| 5 | 73.7 | 70.4 | 7.2 | 0.62786 | X | X | X | X | X | |
| 6 | 75.1 | 71.3 | 7.0 | 0.61885 | X | X | X | X | X | X |
Table 7 shows the results. Each line of the output represents a different model, and the two best models for each number of predictors appear.
R2 shows the percentage of the dependent variable that can be explained by the predictor variables in the model. In general, the higher the R2, the better the model fits the data. Adjusted R2 shows the percentage of the dependent variable that can be explained by the predictor variables in the model, adjusted for the number of predictors in the model. This adjustment is important because the R2 for any model will always increase when a new term is added. A model with more terms may appear to have a better fit simply because it has more terms. The adjusted R2 is a useful tool for comparing the explanatory power of models with different numbers of predictors. The adjusted R2 will increase only if the new term improves the model more than would be expected by chance, and it will decrease when a predictor improves the model less than expected by chance. Mallows' Cp is a statistic that is commonly used as an aid in choosing between competing multiple regression models. A Mallows' Cp value that is close to the number of predictors plus the constant indicates that the model is relatively precise and unbiased in estimating the true regression coefficients and predicting future responses. However, the Mallows’ Cp should be evaluated in conjunction with other statistics included in the best subsets output, such as R2, Adjusted R2 and S (standard error of the regression), for more accurate decision-making.
Table 7 shows that moving from the best model with three variables to models with four or five variables slightly improves the model fit (adj. R2). It should also be noted that moving from the best model with three variables to models with four or five variables slightly improves the value of S, and the lower the value of S is the more accurate the predictions made with the regression line are. We started by considering that the best subset of variables would be given by these three variables: IMA, ITT and ICIA.
Once we selected the best subset, by using a multiple regression analysis we obtained a model that allowed us to explain how the independent or predictor variables influence the dependent variable. A three-predictor multiple linear regression model with three predictor variables was proposed: information management-after (IMA), information technology use - tactical (ITT) and information culture - internally assumed (ICIA).
| Dependent variable | Independent variables | Coefficient | Significance | Model Adj. R2 | F | Significance |
|---|---|---|---|---|---|---|
| IQ (Information quality) | IMA ITT ICIA | 0.382 0.279 0.268 | 0.000 0.026 0.001 | 0.708 | 37.414 | 0.000 |
We used Minitab statistical software for the regression analysis, and Table 8 shows the output provided by the tool. According to the value of the adjusted R2 (0.708), the model has a very reasonable fit. Moreover, the proposed model is adequate as the F-statistic = 37.414 is significant at the 1% level (p-value = < 0.001).
Three variables were found to have a positive and significant relationship with the information quality dimension: information management-after (IMA; b=0.382; p = < 0.01), information technology use - tactical (ITT; b=0.279; p=0.026) and information culture - internally assumed (ICIA; b=0.268; p=<0.01). Therefore, H4 ( information competences affect information quality.) is not confirmed because only three information competences were found to have positive and significant relationship with the information quality.
We also considered two other models with four and five variables, but neither of the coefficients of these new variables was statistically significant.
Conclusions
Companies that are aware of the importance of handling quality information when making the decisions will find in this study a set of practices that can implemented in order to develop their information capability. As the study reveals, to the extent that a company has information capability, the quality of the information it manages will be higher.
As evidenced by the exploratory factor analysis, practices related with the management of the information life cycle can be summarized in two dimensions: information management - before and information management - after. In practice, managers intuitively differentiate information from data and describe information as data that has been processed. According to this idea information management - before comprises practices associated with data management and information management - after comprises practices associated information management.
Practices related to the integration of information technology into day-to-day business can also be summarised in two dimensions: information technology use - strategic and information technology use - tactical. information technology use - tactical comprises practices associated with the use of information technology as support at the operational level, and information technology use - strategic comprises practices associated with the use of information technologies as support the strategic level.
Practices where the behaviour and values assumed by employees in relation to the use and management of information are shown can be summarized in two dimensions: information culture - instilled and information culture - internally assumed. Information culture - instilled comprises practices conditioned by and to a certain extent forced from the outside. Information culture - internally assumed comprises practices that reveal a positive and proactive attitude towards the use and management of information shared by employees.We have found a positive and significant relationship between some information practices and the quality of the information managed. The study has allowed areas of improvement to be identified by pointing out practices that, if they were commonly implemented, would improve the use and management of information and make it more efficient, which would be reflected in the quality of the information managed. Specifically, practices associated with information management, practices associated with the use of information technologies as support at the operational level and practices that reveal a positive and proactive attitude towards the use and management of information shared by employees are key and have a significant influence on the quality of managed information in companies that took part in this study.
The companies analysed were committed to total quality management and had won a quality award. Correctly applying a total quality management model involves establishing processes that must be under control by using the right indicators. The monitoring of the overall performance of the quality system would be enabled by using the appropriate indicators, which have to be produced and updated. An information system designed by taking information capability into account would be the most suitable because it would provide information with higher quality dimensions.
As for research limitations, the first one is that the questionnaires were answered by managers, which could have introduced a bias. Given that information flows throughout the company and involves everyone’s work, it would be better to know the perception of all the employees. The second limitation is the low response rate which can lead to a bias.
Acknowledgements
The researchers would like to acknowledge the support of Euskalit and those companies which took part in the study, as well as the helpful comments of reviewers.
About the author
Marta Zárraga-Rodríguez received her PhD in Industrial Engineering at the University of Navarra and lectures in Business Administration, Statistics and Economics at ISSA-School of Management Assistants of the University of Navarra. She has been conducting and publishing research on the analysis and development of companies’ capabilities. She can be contacted at mzarraga@unav.es.
Maria Jesús Alvarez holds a Ph.D. degree in Agricultural Engineering from the UMP (Universidad Politécnica de Madrid). She is a professor of Operational Research at TECNUN (Universidad de Navarra) in the Management Industrial Engineering Department. Her research activities are in Operations Research applied to logistics and to the improvement of the productivity of the systems. She can be contacted at mjalvarez@tecnun.es.