Comparative analysis of homepage Website visibility and academic rankings for UK universities
Melius Weideman
Website Attributes Research Centre, Cape Peninsula University of Technology, PO Box 652, Cape Town 8000, South Africa
Introduction
It is clear from both the industry and academic research that marketing is essential to push products and services out to the consumer. The use of Websites to achieve this has been a common tactic since the early days of the Internet. Lately, universities have been forced to change from being isolated academic enterprises to real-life businesses, competing for common pools of paying clients. Their Websites have played a central role in this effort to market a university. A university's Website is expected to be a flag-waving device for its reputation for teaching and/or research. In parallel with this, there has been a paradigm shift of focus onto social media, where the younger generation is highly aware of and dependent on technology for their social interactions. It is a combination of these factors which have caused university Websites to shift from operating in a traditional academic environment to the public realm. On this platform, students expect to be able to interact with their university through its Website and/or the Learning Management System on a daily basis.
The objective of this research was to measure the visibility of a sample of UK university Website homepages to search engine crawlers. The results would give an indication of not only how the universities compare to each other but also show the degree of optimisation having been done on these Web pages. This was considered necessary to combat the inherent user reluctance to read past the first search engine results page - Website visibility for university homepages is no longer a nice-to-have option, but a must-have.
The total number of UK universities could not be determined exactly. Various sources claim different figures and 150 was found to be an approximate average number. A sample had to be taken, and the well-known Russell and 1994 groupings were used to define this sample from the population. A total of 38 universities were thus found and used for the empirical experiments.
In this project the focus was on the homepages of the sample taken from this population of universities – specifically the ease (or lack thereof) with which search engine crawlers could index them, enabling users to later find them through search engines.
This background has provided the motivation for this research project. No empirical evidence could be found that a study of this kind has been done specifically on UK universities. The research problem is that no guidance exists on the current comparative status of top UK university homepage visibility, leading to possible lost opportunities.
Background and other research
Search engines
Search engines are well established in the Internet world, and have grown from garage-driven, primitive software startups to financially successful corporations employing thousands of experts. Google and Yahoo!, currently the two leaders in USA market share (Adamo 2013) provide search results in a similar format – natural results occupy the bottom left corner on a result screen, and paid results the top and right hand side of the screen.
The latest search engine market share figures confirm that Google, Bing and Yahoo! are the undisputed market leaders in the USA (Adamo 2013). Their combined size of the search market is 96.2%, leaving other search engines a miniscule portion of the market.
Website visibility
Websites have a number of attributes, some more easily measurable than others. Usability comes to mind, as well as a large number of usage metrics including hits, bounce rate, page views and pages per visit. Website visibility is another metric which describes the ease (or lack thereof) with which a search engine crawler can index a given Web page, once found. This degree of visibility to a crawler is a combination of a large number of factors, as opposed to a single value on a linear scale. Some of these factors which could improve the visibility of a Website include the quality and quantity of inlinks, keyword usage in Web page body text and the use of metatags (Weideman 2009). The implementation of these factors is sometimes collectively termed as whitehat search engine optimisation (SEO). Similarly, some blackhat SEO techniques also exist. These are used by Website designers in an attempt to cajole crawlers and algorithms to allocate a higher ranking to a Website than it deserves, based on the quality of its content. Website visibility can be achieved by applying either or both whitehat and blackhat SEO (Malaga 2010). With blackhat, however, the chances exist that a search engine could blacklist a Website and remove it from its index, one of the worst fates of any Website.
Crawler access to Websites
Much research has been done on Website visibility and access to these Websites by search engine crawlers. Oralalp (2010) has investigated the Internet visibility of Turkish Websites and had difficulty in using only one attribute for measuring this feature. Four separate activities and some tasks were identified, which were needed to evaluate the visibility of a Website (Espadas et al. 2008). Aguillo (2009) used the phrase 'Institution footprint in the Web' as a way to define Website visibility, describing three indicators for this measurement: usage, impact and activity. One recent Website visibility model (Sullivan 2011) appeared in non-academic literature, which categorised elements having an effect on Website visibility. However, no evidence could be found for the basis for the Sullivan model. No empirical data, interviews or a literature study supported its construction. It appeared to have been based on practical experience and insight only, hence is not used further in this project, even though some similarities between the two are evident.
Future research could investigate links between the Sullivan and the Weideman model. The Sullivan model does provide practical guidance on, for example, the role of off-page and on-page search engine optimisation elements (Malaga 2010). The only model on Website visibility found, based on standard academic research and peer review, was the Weideman model (Weideman 2009). This model identifies and ranks both positive and negative visibility elements. The most highly rated positive elements are: inlinks, body keywords and anchor text. The quantity and quality of inlinks (hyperlinks on other Websites) seemed to play a large role in creating more traffic (Rathimala 2010; Weideman 2009). Other authors did a hyperlink analysis on seven Canadian faculty Websites, identifying clusters of visibility patterns on these Websites (Yi et al. 2008). It seems that these scholars agree on the value of hyperlinks pointing to a Website being an indication of trust in its intrinsic value. Table 1 indicates the respective weights allocated to the various elements contributing to the visibility of a webpage, which have been used in this research.
| Elements | Score |
|---|---|
| Inlinks | 82.3 |
| Body keywords | 54 |
| Hypertext/anchor text | 32.8 |
| Metatags | 27.3 |
| TITLE Tag | 19.3 |
| H1 Tag | 17.1 |
| Outlinks | 15.9 |
| i-Age of site | 12.1 |
| Domain names | 9.1 |
| b-Manual search engine submission | 5.0 |
| b-Paid inclusion service | 5.0 |
| b-Paid placement service | 5.0 |
| i-Age of document | 5.0 |
| HTML naming conventions | 4.4 |
| i-Age of link | 2.9 |
| i-Topical relationship of linking site | 2.1 |
| i-Relevance of site's primary subject matter to query | 0.7 |
UK universities
Universities are competing for common pools of paying clients. Authors have proved that universities in general have to be positioned in a global market to guarantee economic survival (Nicolae & Marinescu 2010).
The UK Higher Education landscape has changed in the past decade or two, due to a number of mergers and name changes (Redesigning the information landscape for higher education 2011; Teeside University 2011; The Higher Education Academy 2011). A group of United Kingdom (UK) universities formed a 'cluster of excellence' in 1994, based on the fact that between them they draw two-thirds of the contract funding and research grants in the UK (1994 Group 2011) The Russell Group is a similar collection of universities, grouping themselves into another cluster of excellence.
A sample had to be taken to be used in this research and the combination of these two lists was taken as the sample for the project – see Table 2.
| Source | No | Code | Name | Domain |
|---|---|---|---|---|
| 994-21 | 1 | BA | University of Bath | http://www.bath.ac.uk/ |
| RUS-01 | 2 | BI | University of Birmingham | http://www.birmingham.ac.uk/ |
| 994-22 | 3 | BK | Birkbeck, University of London | http://www.bbk.ac.uk/ |
| RUS-02 | 4 | BR | University of Bristol | http://www.bristol.ac.uk/ |
| RUS-03 | 5 | CA | University of Cambridge | http://www.cam.ac.uk/ |
| RUS-04 | 6 | CF | Cardiff University | http://www.cardiff.ac.uk/ |
| RUS-19 | 7 | CO | University College London | http://www.ucl.ac.uk/ |
| 994-23 | 8 | DU | Durham University | http://www.dur.ac.uk/ |
| 994-24 | 9 | EA | University of East Anglia | http://www.uea.ac.uk/ |
| RUS-05 | 10 | ED | University of Edinburgh | h ttp://www.ed.ac.uk/ |
| 994-25 | 11 | ES | University of Essex | http://www.essex.ac.uk/ |
| 994-26 | 12 | EX | University of Exeter | http://www.exeter.ac.uk/ |
| RUS-06 | 13 | GL | University of Glasgow | http://www.glasgow.ac.uk/ |
| 994-27 | 14 | GO | Goldsmiths, University of London | http://www.gold.ac.uk/ |
| RUS-07 | 15 | IC | Imperial College | http://www3.imperial.ac.uk/ |
| 994-28 | 16 | IE | Institute of Education, University of London | http://www.ioe.ac.uk/ |
| RUS-08 | 17 | KC | King's College London | http://www.kcl.ac.uk/ |
| 994-29 | 18 | LA | Lancaster University | http://www.lancs.ac.uk/ |
| 994-30 | 19 | LR | University of Leicester | http://www.le.ac.uk/ |
| RUS-09 | 20 | LE | University of Leeds | http://www.leeds.ac.uk/ |
| RUS-10 | 21 | LI | University of Liverpool | http://www.liv.ac.uk/ |
| 994-31 | 22 | LO | Loughborough University | http://www.lboro.ac.uk/ |
| RUS-11 | 23 | LS | London School of Economics | http://www2.lse.ac.uk/ |
| RUS-12 | 24 | MA | University of Manchester | http://www.manchester.ac.uk/ |
| RUS-13 | 25 | NE | Newcastle University | http://www.ncl.ac.uk/ |
| RUS-14 | 26 | NO | University of Nottingham | http://www.nottingham.ac.uk/ |
| 994-35 | 27 | OA | School of Oriental and African Studies | http://www.soas.ac.uk/ |
| RUS-15 | 28 | OX | University of Oxford | http://www.ox.ac.uk/ |
| 994-32 | 29 | QM | Queen Mary, University of London | http://www.qmul.ac.uk/ |
| RUS-16 | 30 | QU | Queen's University Belfast | http://www.qub.ac.uk/ |
| 994-33 | 31 | RE | University of Reading | http://www.reading.ac.uk/ |
| 994-34 | 32 | SA | University of St Andrews | http://www.st-andrews.ac.uk/ |
| RUS-17 | 33 | SH | University of Sheffield | http://www.sheffield.ac.uk/ |
| RUS-18 | 34 | SO | University of Southampton | http://www.southampton.ac.uk/ |
| 994-36 | 35 | SU | University of Surrey | http://www.surrey.ac.uk/ |
| 994-37 | 36 | SX | University of Sussex | http://www.sussex.ac.uk/ |
| RUS-20 | 37 | WA | University of Warwick | http://www.warwick.ac.uk/ |
| 994-38 | 38 | YO | University of York | http://www.york.ac.uk/ |
Academic university rankings
Many universities and other organisations are maintaining lists of university rankings based on academic value, which is different from Website visibility ranking (Sugak 2011). One of these rating systems, for example, is Academic Ranking of World Universities. Recent research identifies these kinds of studies as belonging to the emerging field of Webometrics (Thelwall 2010). Some of these ranking sources are listed in Table 3. Different lists produce different results, as can be expected since they use widely varying methods of measurement to arrive at their ranking tables. University attributes such as research outputs, student perception, size, student-to-staff ratios and others are measured and used in the ranking formulae. The academic ranking of universities worldwide has been widely publicised lately, with many subsets being touted: UK only universities, all-African university lists, European universities only and others.
| Name | Domain |
|---|---|
| Academic Ranking of World Universities (ARWU) | http://www.arwu.org |
| QS World University Rankings® 2010/2011 | http://www.topuniversities.com/university-rankings/world-university-rankings/2010 |
| Ranking Web of World Universities | http://www.webometrics.info/top12000.asp |
| Times Higher Education World University Rankings | http://www.timeshighereducation.co.uk/world-university-rankings/2010-2011/top-200.html |
| Wikipedia Ranking of World Universities | http://en.wikipedia.org/wiki/Academic_Ranking_of_World_Universities |
However, similar patterns do emerge when comparing some of these rankings. For example, Oxford and Cambridge universities often appear in the top two or three positions of the UK lists.
In contrast to these academic rankings however, this research focusses on the ranking of university Websites according to the visibility of their Website homepages. As noted earlier, the quantity and quality of hyperlinks pointing to these homepages play a major role in search engine rankings. Much research has been done on hyperlinks and the patterns they create.
During the early phase of Internet development, Middleton and others presented a model suggesting both structure and content for a typical university Website (Middleton et al. 1999). It strongly promoted user-centred design, arguing that individual, group and institutional information needs should be identified to guide the design process. No research was done on the perception search engine crawlers had of these Websites. This is understandable, since the meteoric rise of search engine traffic only started around the time Google took Yahoo! on as leader in the search engine wars, around 2006. Furthermore, a survey was done by the same authors of the UK Higher Education Websites at the time, listing the size of each homepage. The size of a Web page determines to a large extent the time it takes to download, and therefore it influences the user experience. Google started including download time as one of its ranking factors (Cutts 2010). The role played by the size of a Web page in download time has diminished as broadband access has become more common.
It is claimed in a 2006 study that hyperlinks provide the most common structure on which Web studies are based (Heimeriks et al. 2006). Amongst others the links between EU universities were graphed in this study and it was clear that many universities can be grouped into clusters, often based on home language. The UK, German and French universities showed a particularly strong interlinking structure. A similar pattern was evident inside a country; Dutch universities typically had more links to other Dutch universities than to those outside the country. Again this pattern was evident in social linking structures inside universities, between departments and humans.
The clustering of regional university links was confirmed in another study (Thelwall et al. 2008) where Microsoft search results were used. These authors found that some countries were poorly connected, while particularly the UK and Germany had well established linkage structures. This again confirmed the findings of Heimeriks.
A number of authors have made the claim that there is a strong correlation between the concept of trust and value implied by referencing a source, as used in search engine algorithms and the citation concept of the academic world (Cronin 2001; Weideman 2009). A series of two research articles report on findings of interlinking between three different university departments in three different countries. The first determined that linking between departments is a good reflection of informal scholarly communication (Li et al. 2005a). The second builds on this citation/linking similarity and further investigates the link patterns formed by these interlinks (Li et al. 2005b). A difference in these patterns was noted, reflecting differences between disciplinary and national boundaries but still mirroring offline scholarly communication.
It is clear that hyperlink studies done on the interlinking been Websites play a large role in not only user perception of Website value or importance but also the value search engine algorithms allocate to domains. This fact is reflected in the high score given by search engines to inlinks when determining ranking of a Website on a search engine result page (Weideman 2009).
A previous study identified a strong correlation between visibility and academic rankings (Weideman 2011). It was proved that out of the top eight visibility scorers in South African universities, seven were also in the top eight academic rankings for the country. No reason could be found for the existence of this correlation. High visibility comes from a concerted effort on the design of the university Website, while high academic rankings stem from a variety of academically oriented factors. These could include a number of different elements such as the number of Nobel laureates and the research output produced by a university. This study also focused on determining if the same strong positive correlation existed between the two types of scores for top scoring UK universities.
Methodology
The domain for each university from the sample list was taken from Internet sources and then checked for authenticity. It was inspected in terms of the sub-domains, news content, links pointed to, contact detail and logo to ensure that it was actually the official university Website. If any one of these elements indicated that it was not the official university Website, the process was repeated with another domain until the correct one was found.
The sub-motives for this research project included the demystifying of Website visibility, enabling the design team to include visibility as part of the design strategy. It was assumed that not all universities would have access to expensive specialist test programs to measure Website visibility. As a result, it was decided to use only freely accessible Web-based tools for measurements, to make this process repeatable. If any visibility elements could not be measured in this way, they would be omitted. The three test programs used are:
Alexa Internet was founded in 1996 and attempted to provide intelligent Web navigation based on user feedback. This service currently provides free global metrics for competitive analysis, benchmarking, market research, or business development. The program gathers user information from those users who have downloaded their toolbar and provides developers with a set of tools with a wide scope of application. As with many online services, it has a free (limited) option and other paid plans with more powerful tools. Users can:
- add traffic and review widgets to Websites by simply copying and pasting supplied HTML code,
- view traffic and many other sets of statistics,
- do a Website audit,
- create and host a customised toolbar
- register a Website with Alexa and a number of other features.
Alexa was used in this research to provide the number of inlinks, i.e., hyperlinks from other Websites to the one in question. One of its more powerful features is the ability to 'Claim your site', i.e., register it with Alexa (after proving ownership). Owners of claimed sites can update title and description tags, and act on user reviews of the site.
The Grader program was designed to measure and analyse Website marketing efforts. It currently consists of a suite of four sets of programs, titled: Marketing.Grader.com, Twitter.Grader.com, Book.Grader.com and Search.Grader.com. The search function was used to provide automated feedback on the details of the university Websites' use of tags - title tag, description and heading respectively. It is possible to obtain this information manually from any live Website but updating it normally involves special access (typically through FTP) to the Website. This program automates this feature, saving the researcher much time and effort. Grader allows users to view keyword ranking positions, paid search status and monthly searches for top keywords.
Ranks is a program aimed at developers and other more technical users. It has a set of Webmaster tools which allows optimisers, for example, to check the status of various on-page factors. Again it has a free, limited version, with the option to pay and get access to more powerful tools. Some of these include:
- Web page analyser,
- search engine comparator,
- social network checker,
- file difference comparator,
- link validator, etc.
In this research, Ranks was used to check the frequency and density of body keywords, which gives an indication of the weight keywords and key phrases carry on a given Web page.
Based on a detailed inspection of these university Website homepages and on expertise in the use of the chosen programs, it became clear that these programs can provide some of the measurements required: see Figure 1.
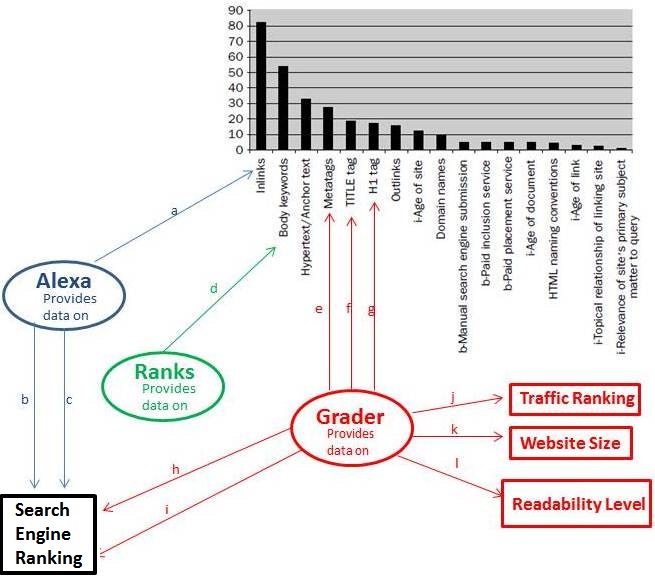
Because of the large volume of evaluative work involved, the first six elements identified in the Weideman model only will be measured and investigated. These six are:
- Inlinks
- Body keywords
- Anchor text
- Metatags
- Title tag and
- H1 tag.
When adding their weights and comparing it to the total weight, these six (out of 17) contribute a weight of 232 out of 300.
The test programs were used in the following way:
- Inlink counts - provided by Alexa
- Keyword optimisation - provided by Ranks
- Hypertext - not done
- Description metatag - provided by Grader
- Title tag - provided by Grader
- H tags - provided by Grader
Other useful measurements provided by these programs but not used in this project include traffic rankings, readability levels, and others (see Figure 1).
It became clear that only one of the proposed measurements would provide a simple list of values which could be ranked by sorting, the inlink count. The others would produce data which is more subjective and other methods had to be found to classify and then rank them.
Figure 2 lists these methods.
- The position of a university in a list is simply a number used to identify it. The list could be sorted alphabetically, for example, where the position is no indication of performance.
- The weight is a value associated with an element of Website visibility, as allocated by the model on which this research is based. A higher weight indicates that an element has a higher positive influence on the visibility of a Web page
- The rank of a university is the position it occupies in a list of universities as a result of its performance in a certain area. University P could be ranked 38, which implies that it has performed the best after a given measurement has been done.
- In some cases an objective measurement was not possible, for example when comparing the value of different description metatags. In these cases, a class had to be created inside the rank, where universities whose measurements were similar could be grouped as being in the same class, effectively earning the same (averaged) rank. In all cases where universities were grouped in a class, the new averaged rank replaced the initial rank figure. In the example of Figure 2, universities T, U and V are in the same class (4), earning them a rank of (32+33+34)/3 = 33.
- Finally, a score was calculated by multiplying each weight with the final rank of the university for that measurement.
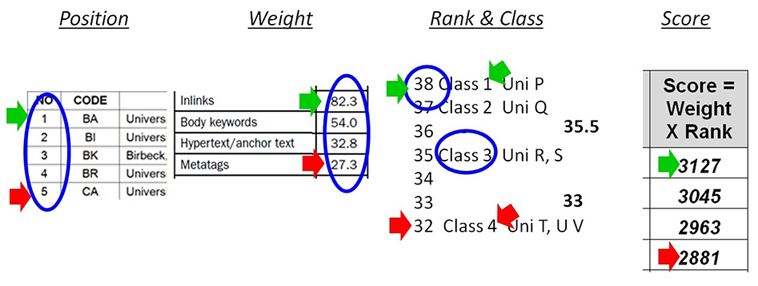
Figure 2: Measurement methods
Results
Inlinks
The number of inlinks to a given Website has been described as playing a major role, by some as the most important one, in Website visibility (Sullivan 2011; Weideman 2009). This element was considered first, and allocated the highest weight of 82.3 (see Figure 1).
It was not necessary to define classes, since the thirty-eight universities produced thirty-eight unique inlink counts. Thus the class and the rank had the same value, namely from 38 down to one. Alexa was used for this measurement; see Figure 3 for an example of how Alexa displays this value.
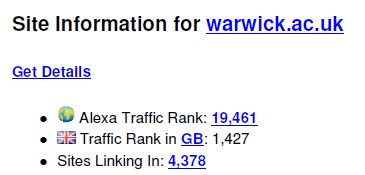
The thirty-eight universities were sorted according to the highest number of inlinks, with the highest rank first, down to the 38th position. The rank was then allocated, with the university listed first achieving the highest rank (38). Finally, for each university the rank was multiplied by the weight to achieve the score. This system was used to ensure consistency across all the measurements, since there would always be a total of thirty-eight universities competing and the same table of weights as multiplying factor will be used. Table 4 contains the list with these rankings.
| Pos | Code | Inlinks | Rank | Score | Pos | Code | Inlinks | Rank | Score | |
|---|---|---|---|---|---|---|---|---|---|---|
| 1 | WA | 4378 | 38 | 3127 | 20 | LA | 2315 | 19 | 1564 | |
| 2 | LS | 4175 | 37 | 3045 | 21 | LO | 2221 | 18 | 1481 | |
| 3 | LE | 4066 | 36 | 2963 | 22 | SA | 2106 | 17 | 1399 | |
| 4 | DU | 3897 | 35 | 2881 | 23 | QU | 2086 | 16 | 1317 | |
| 5 | NO | 3893 | 34 | 2798 | 24 | MA | 1768 | 15 | 1235 | |
| 6 | LI | 3666 | 33 | 2716 | 25 | CF | 1715 | 14 | 1152 | |
| 7 | CA | 3635 | 32 | 2634 | 26 | BR | 1583 | 13 | 1070 | |
| 8 | YO | 3466 | 31 | 2551 | 27 | SU | 1474 | 12 | 988 | |
| 9 | OX | 3465 | 30 | 2469 | 28 | OA | 1438 | 11 | 905 | |
| 10 | LR | 3378 | 29 | 2387 | 29 | BK | 1364 | 10 | 823 | |
| 11 | BA | 3220 | 28 | 2304 | 30 | RE | 1316 | 9 | 741 | |
| 12 | KC | 3192 | 27 | 2222 | 31 | EX | 875 | 8 | 658 | |
| 13 | GL | 3185 | 26 | 2140 | 32 | QM | 728 | 7 | 576 | |
| 14 | NE | 3123 | 25 | 2058 | 33 | SH | 686 | 6 | 494 | |
| 15 | IC | 2984 | 24 | 1975 | 34 | GO | 644 | 5 | 412 | |
| 16 | SX | 2485 | 23 | 1893 | 35 | IE | 540 | 4 | 329 | |
| 17 | EA | 2386 | 22 | 1811 | 36 | CO | 315 | 3 | 247 | |
| 18 | ES | 2380 | 21 | 1728 | 37 | SO | 310 | 2 | 165 | |
| 19 | ED | 2356 | 20 | 1646 | 38 | BI | 171 | 1 | 82 |
Body keywords
Secondly, the use of body keywords in a Web page has been proven to be the second most important contributing factor to Website visibility (Weideman 2009). However, this is a more subjective measure than mere counting as for inlinks, so the class system had to be used to group Web pages which are of equal quality in terms of body keyword usage. Ranks provides a keyword analysis tool, by graphing the frequency of keywords and key terms used on the target Web page. See Figure 4 for an example of how Ranks measures and displays these values.
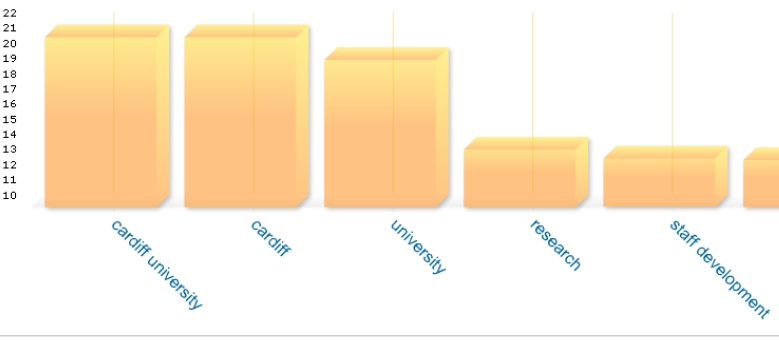
Next, the universities were ranked on a scale, using the classes, based on how relevant the keyword optimisation was done (knowingly or unknowingly) on each homepage. An assumption was made that prospective students would be looking for universities by name, and the classes were created accordingly.
- Class 1 is the most relevant keyword grouping, down to Class 5 being the least relevant.
- Class 1: First keyword/phrase is the full university name in separate keywords (the official spelling was taken to be the name on the university homepage).
- Class 2: First keyword/phrase is not the full university name in separate keywords, second keyword/phrase is the full university name in separate keywords.
- Class 3: First and second keyword/phrase combined is the full university name in separate keywords.
- Class 4: None of Class 1, 2 or 3 contains parts of the name, but the university name appears in the first five keywords or key phrases, other keywords or key phrases are descriptive of a university.
- Class 5: University name not used in first five keywords or key phrases but other related terms are present.
This second visibility element has a weight of 54.0, according to Figure 1. This weight was used to create the final score for each university, where the rank times the weight equals the score. Where more than one university occupies a class, the average for that class was allocated. For example, from Table 5, the first seven universities are in the same class and therefore have the same rank (averaged). The next group of 11 again were all in Class 2, and had the same score.
| Pos | Code | Rank | Score | Pos | Code | Rank | Score | |
|---|---|---|---|---|---|---|---|---|
| 1 | CF | 35 | 1890 | 20 | BA | 16 | 864 | |
| 2 | IE | 35 | 1890 | 21 | BR | 16 | 864 | |
| 3 | LO | 35 | 1890 | 22 | EA | 16 | 864 | |
| 4 | NE | 35 | 1890 | 23 | LE | 16 | 864 | |
| 5 | QU | 35 | 1890 | 24 | NO | 16 | 864 | |
| 6 | ES | 35 | 1890 | 25 | OX | 16 | 864 | |
| 7 | LI | 35 | 1890 | 26 | SH | 16 | 864 | |
| 8 | DU | 26 | 1404 | 27 | WA | 16 | 864 | |
| 9 | LA | 26 | 1404 | 28 | BK | 7 | 351 | |
| 10 | SU | 26 | 1404 | 29 | IC | 7 | 351 | |
| 11 | BI | 26 | 1404 | 30 | KC | 7 | 351 | |
| 12 | CA | 26 | 1404 | 31 | QM | 7 | 351 | |
| 13 | ED | 26 | 1404 | 32 | OA | 7 | 351 | |
| 14 | GL | 26 | 1404 | 33 | CO | 7 | 351 | |
| 15 | LR | 26 | 1404 | 34 | EX | 7 | 351 | |
| 16 | MA | 26 | 1404 | 35 | RE | 7 | 351 | |
| 17 | SO | 26 | 1404 | 36 | SA | 7 | 351 | |
| 18 | SX | 26 | 1404 | 37 | YO | 7 | 351 | |
| 19 | GO | 16 | 864 | 38 | LS | 1 | 54 |
Anchor text
During the experiments it was noted that anchor text could not be identified, graded or listed by any one of the defined tools. As a result, this feature was not measured and its scoring omitted from this research.
Description metatag
The fourth most important element identified in earlier research was the description metatag. This is an optional textual Web page component which the browser does not display, except if the user specifically requests it through the menus. Most search engines will display the first part of this metatag on their result pages. It is supposed to contain a keyword-rich description of the Website's content, to allow crawlers to evaluate a Website and users to scan it for relevance. The Grader tool extracted this metatag, allowing further inspection and evaluation. See Figure 5 for an example of how Grader displays this detail.

A ranking was again done on the 38 universities, based on the relevance of their homepage description metatags. In general, best practice prescribes that this metatag should be one or more full sentences, keyword rich and include the most important keywords towards the start. A class definition was also necessary, since some university homepages had different but similar tags in terms of value. This element had a weight of 27.3 (from Table 1), hence the score was calculated by multiplying the weight by the rank.
- Class 1: Multiple sentence, keyword rich, well written, strong university related.
- Class 2: Multiple sentence, university related, some relevant keywords.
- Class 3: Single sentence, university related, some relevant keywords.
- Class 4: Short phrase, few relevant keywords.
- Class 5: No relevant keywords.
- Class 6: No metatag.
The resultant scores are listed in Table 6.
| Pos | Code | Rank | Score | Pos | Code | Rank | Score | |
|---|---|---|---|---|---|---|---|---|
| 1 | BI | 37 | 1010 | 20 | CA | 17 | 464 | |
| 2 | ED | 37 | 1010 | 21 | EA | 17 | 464 | |
| 3 | GL | 37 | 1010 | 22 | ES | 17 | 464 | |
| 4 | IE | 34 | 928 | 23 | LR | 17 | 464 | |
| 5 | OA | 34 | 928 | 24 | OX | 17 | 464 | |
| 6 | SX | 34 | 928 | 25 | SO | 17 | 464 | |
| 7 | BK | 28 | 764 | 26 | SA | 17 | 464 | |
| 8 | CF | 28 | 764 | 27 | WA | 17 | 464 | |
| 9 | IC | 28 | 764 | 28 | YO | 17 | 464 | |
| 10 | KC | 28 | 764 | 29 | QU | 10 | 273 | |
| 11 | LO | 28 | 764 | 30 | DU | 5 | 137 | |
| 12 | QM | 28 | 764 | 31 | LS | 5 | 137 | |
| 13 | BA | 28 | 764 | 32 | NE | 5 | 137 | |
| 14 | LI | 28 | 764 | 33 | SU | 5 | 137 | |
| 15 | SH | 28 | 764 | 34 | EX | 5 | 137 | |
| 16 | GO | 17 | 464 | 35 | LE | 5 | 137 | |
| 17 | LA | 17 | 464 | 36 | MA | 5 | 137 | |
| 18 | CO | 17 | 464 | 37 | NO | 5 | 137 | |
| 19 | BR | 17 | 464 | 38 | RE | 5 | 137 |
Title tag
The fifth visibility element to be considered was the content of the title tag. It differs from the description metatag in that search engines display fewer of its characters but it is also optional, invisible to the browser and it is displayed on search engine result pages as the title of each result. Most browsers also display the content of this title tag – see Figure 6. According to prior research this element has a weight of 19.3 (see Figure 1).
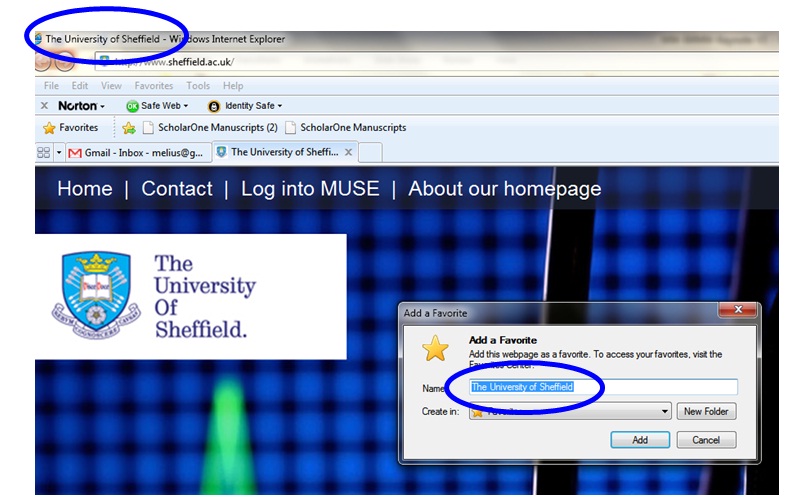
Figure 6: Example of how the TITLE tag is displayed by a browser
Similar to the previous steps, a ranking scale was developed (38 down to one), and again Classes had to be created to group similar entries.
- Class 1: Starts with full university name, plus other highly relevant keywords.
- Class 2: Full university name mixed with other relevant terms.
- Class 3: Only full university name.
- Class 4: University full name first, plus no-value terms (e.g., Welcome, Homepage.
- Class 5: Starts with no-value words.
A summary of the scores earned by the homepages for the title tag is given in Table 7.
| Pos | Code | Rank | Score | Pos | Code | Rank | Score | |
|---|---|---|---|---|---|---|---|---|
| 1 | RE | 38 | 733 | 20 | LE | 21 | 405 | |
| 2 | BK | 35 | 666 | 21 | LR | 21 | 405 | |
| 3 | NE | 35 | 666 | 22 | LI | 21 | 405 | |
| 4 | CO | 35 | 666 | 23 | MA | 21 | 405 | |
| 5 | BR | 35 | 666 | 24 | NO | 21 | 405 | |
| 6 | GL | 35 | 666 | 25 | SH | 21 | 405 | |
| 7 | SA | 35 | 666 | 26 | SO | 21 | 405 | |
| 8 | DU | 21 | 405 | 27 | SX | 21 | 405 | |
| 9 | IC | 21 | 405 | 28 | YO | 21 | 405 | |
| 10 | IE | 21 | 405 | 29 | KC | 9 | 164 | |
| 11 | LO | 21 | 405 | 30 | LS | 9 | 164 | |
| 12 | QM | 21 | 405 | 31 | QU | 9 | 164 | |
| 13 | OA | 21 | 405 | 32 | ES | 9 | 164 | |
| 14 | SU | 21 | 405 | 33 | CF | 4 | 68 | |
| 15 | BA | 21 | 405 | 34 | GO | 4 | 68 | |
| 16 | BI | 21 | 405 | 35 | LA | 4 | 68 | |
| 17 | CA | 21 | 405 | 36 | EA | 4 | 68 | |
| 18 | ED | 21 | 405 | 37 | OX | 4 | 68 | |
| 19 | EX | 21 | 405 | 38 | WA | 4 | 68 |
Heading tags
Finally, the H1 tags (with a weight of 17.1) of each homepage were considered. Again the (Heading) tag is an optional mechanism which browsers use to display headings or other important sections in a text environment slightly larger and bold against their surroundings. This is similar to the way larger fonts and boldfacing is used in word processing to emphasise text. Various levels are available to the coder: H1 is the highest (biggest font), down to H6 being the smallest. Apart from highlighting text to the human eye by using H tags, the crawler also attaches more value to an H1 tag than to other levels, or to ordinary text. Again best practice prescribes that only one H1 should be used per page, keywords should be included and some other lower level H-tags should be present. See Figure 7 for an example of how Grader displays a Web page's H tags.
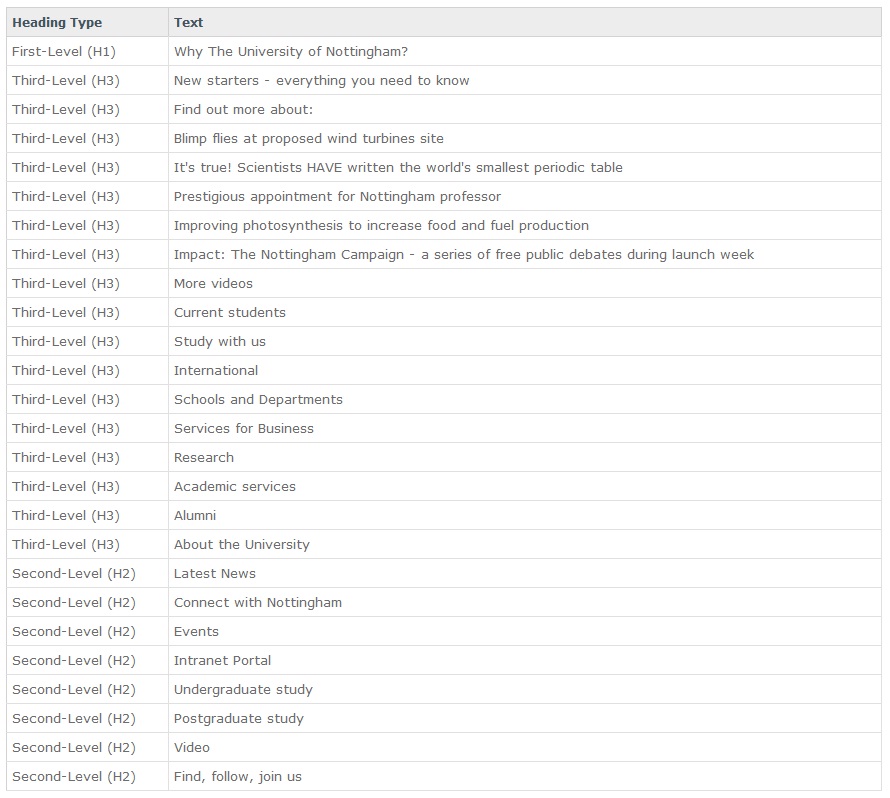
Figure 7: Example of how Grader displays H tags
A ranking scale was developed (38 down to one), and again classes had to be created to group similar entries.
- Class 1: One H1, very descriptive, some H2 and H3.
- Class 2: One H1, descriptive, some other Hs.
- Class 3: One H1, some H2 and/or H3.
- Class 4: One H1.
- Class 5: No H1, some H2 and H3.
- Class 6: Multiple H1 OR no Hs OR Hs present but no-value content.
A summary of the scores earned by the homepages for the H tags is given in Table 8.
| Pos | Code | Rank | Score | Pos | Code | Rank | Score | |
|---|---|---|---|---|---|---|---|---|
| 1 | BK | 38 | 650 | 20 | CF | 18 | 299 | |
| 2 | OA | 37 | 624 | 21 | DU | 18 | 299 | |
| 3 | NO | 37 | 624 | 22 | LS | 18 | 299 | |
| 4 | GO | 28 | 470 | 23 | NE | 18 | 299 | |
| 5 | IC | 28 | 470 | 24 | CO | 13 | 214 | |
| 6 | IE | 28 | 470 | 25 | BA | 13 | 214 | |
| 7 | KC | 28 | 470 | 26 | BR | 13 | 214 | |
| 8 | LA | 28 | 470 | 27 | ED | 13 | 214 | |
| 9 | LO | 28 | 470 | 28 | LR | 13 | 214 | |
| 10 | QU | 28 | 470 | 29 | YO | 13 | 214 | |
| 11 | SU | 28 | 470 | 30 | QM | 5 | 86 | |
| 12 | BI | 28 | 470 | 31 | ES | 5 | 86 | |
| 13 | CA | 28 | 470 | 32 | EX | 5 | 86 | |
| 14 | EA | 28 | 470 | 33 | GL | 5 | 86 | |
| 15 | LI | 28 | 470 | 34 | LE | 5 | 86 | |
| 16 | MA | 28 | 470 | 35 | OX | 5 | 86 | |
| 17 | SO | 28 | 470 | 36 | RE | 5 | 86 | |
| 18 | SA | 28 | 470 | 37 | SH | 5 | 86 | |
| 19 | WA | 28 | 470 | 38 | SX | 5 | 86 |
Cumulative scores
The cumulative total of all university homepage scores was then calculated. This was the total of all five score columns determined in the previous sections; see Table 9. A higher degree of Website visibility for a homepage is indicated by a higher score.
| Pos | Code | University | Total score |
|---|---|---|---|
| 1 | LI | University of Liverpool | 6246 |
| 2 | CA | University of Cambridge | 5377 |
| 3 | GL | University of Glasgow | 5305 |
| 4 | DU | Durham University | 5126 |
| 5 | NE | Newcastle University | 5049 |
| 6 | LO | Loughborough University | 5011 |
| 7 | WA | University of Warwick | 4993 |
| 8 | LR | University of Leicester | 4874 |
| 9 | NO | University of Nottingham | 4828 |
| 10 | SX | University of Sussex | 4716 |
| 11 | ED | University of Edinburgh | 4679 |
| 12 | BA | University of Bath | 4552 |
| 13 | LE | University of Leeds | 4454 |
| 14 | ES | University of Essex | 4332 |
| 15 | CF | Cardiff University | 4173 |
| 16 | QU | Queen’s University Belfast | 4114 |
| 17 | IE | Institute of Education, University of London | 4023 |
| 18 | YO | University of York | 3985 |
| 19 | KC | King’s College London | 3972 |
| 20 | LA | Lancaster University | 3970 |
| 21 | IC | Imperial College | 3966 |
| 22 | OX | University of Oxford | 3950 |
| 23 | LS | London School of Economics | 3699 |
| 24 | EA | University of East Anglia | 3677 |
| 25 | MA | University of Manchester | 3651 |
| 26 | SU | University of Surrey | 3404 |
| 27 | BI | University of Birmingham | 3372 |
| 28 | SA | University of St Andrews | 3350 |
| 29 | BR | University of Bristol | 3278 |
| 30 | BK | Birkbeck, University of London | 3254 |
| 31 | OA | School of Oriental and African Studies | 3214 |
| 32 | SO | University of Southampton | 2908 |
| 33 | SH | University of Sheffield | 2613 |
| 34 | GO | Goldsmiths, University of London | 2277 |
| 35 | QM | Queen Mary, University of London | 2182 |
| 36 | RE | University of Reading | 2047 |
| 37 | CO | University College London | 1942 |
| 38 | EX | University of Exeter | 1637 |
The minimum score any university could obtain was calculated as follows: the lowest rank possible is 1, and totalling the weights of the five elements considered yields: 82.3 + 54 + 27.3 + 19.3 + 17.1 = 200. The maximum score possible would be the sum of the individual weights (200) multiplied by the number of top scores achieved (38), giving a theoretical maximum of 7600.
Discussion and conclusion
Visibility result interpretation
From Table 9 the calculated versus actual minimum and maximum scores are: 200 vs 1637 and 7600 vs 6246. These figures seem to indicate that the top-scoring university's score was not far below the maximum, while the bottom scorer was well above the minimum possible. The highest scorer had a score of 3.8 times that of the lowest one. This is in stark contrast to the results of a similar study done on South African universities. Here the highest scorer out of 23 universities was 8.4 times better than the lowest one (Weideman 2011).
When comparing the final results with those obtained during the phases of measurement, the two highest scorers overall exhibited an interesting pattern. Neither of them ever featured in the top five during the five measurements. However, both scored consistently in the top half where it mattered most, namely where the weighting of the visibility factors was high. On the inlink measurement (highest weight), Liverpool and Cambridge were 6th and 7th, on the second highest weight (keywords) they were 7th and 12th, and on the fourth highest (description metatag) they scored 14th and 20th. This indicates that it is relatively easy to improve a university's Website visibility ranking, compared to increasing its academic ranking, for example. The focus has to be on the few highest scoring elements, to ensure that the harvest on the heavier weighted elements is richer.
The results also indicate that there is a surprisingly wide spread on the scale of scores. It has to be accepted that older domains (correlating to older universities) have a higher trust value with search engines, and have had more time and opportunities to harvest inlinks (highest weight) from outside sources. However, any Website owner should have at least the homepage content rewritten by a technical copywriter, to enhance the keyword weighting (second highest weight) for its specific target market. Combined with the relative ease of writing a good description metatag (4th highest weight), title tag (5th highest weight) and H tags (6th highest weight), the lack of a high number of inlinks can be offset by these other elements.
Some of the results exposed some gross ignorance of best practice in Website visibility design. Considering only the easy-to-do changes (metatags and H tags), the following were serious omissions:
- The 10 Class 6 occupants (more than 25% of the total) of the description metatag group had no entry here at all.
- The 10 Class 5 and 4 occupants (more than 25% of the total) of the title tag group contained no-value terms such as 'Home' or 'Web page'
- There were fifteen occupants of the lower classes in the H tag group, where even the most basic guidelines were ignored.
It should be noted that any user can view the source code of most university homepages. In this way one can learn from the leaders and translate their good ideas, well-written text blocks and metatags into relevant text for one's own homepage.
Academic ranking result interpretation
For the purposes of this research, the 2010/2011 Times Higher Education rankings were used in the comparison. Only the top thirty-one universities from the UK, Ireland, Scotland and Wales are listed here: see Table 10.
| Pos | Region Rank | University | Overall score |
|---|---|---|---|
| 1 | 1 | University of Cambridge | 91.2 |
| 2 | 1 | University of Oxford | 91.2 |
| 3 | 3 | Imperial College London | 90.6 |
| 4 | 5 | University College London | 78.4 |
| 5 | 7 | University of Edinburgh | 69.2 |
| 6 | 13 | University of Bristol | 61.4 |
| 7 | 14 | Trinity College Dublin | 60.3 |
| 8 | 15 | King's College London | 59.7 |
| 9 | 16 | University of Sussex | 59.5 |
| 10 | 17 | University of York | 59.1 |
| 11 | 19 | Durham University | 58.9 |
| 12 | 20 | London School of Economics and Political Science | 58.3 |
| 13 | 21 | University of Manchester | 58 |
| 14 | 22 | Royal Holloway, University of London | 57.9 |
| 15 | 24 | University of Southampton | 57.7 |
| 16 | 26 | University College Dublin | 57.5 |
| 17 | 31 | University of St. Andrews | 56.5 |
| 18 | 35 | Queen Mary, University of London | 54.6 |
| 19 | 37 | Lancaster University | 54.4 |
| 20 | 40 | University of Glasgow | 54.2 |
| 21 | 45 | University of Sheffield | 52.5 |
| 22 | 47 | University of Dundee | 52.2 |
| 23 | 52 | University of Birmingham | 51.8 |
| 24 | 54 | University of Aberdeen | 51.4 |
| 25 | 56 | Birkbeck, University of London | 51.2 |
| 26 | 56 | Newcastle University | 51.2 |
| 27 | 60 | University of Liverpool | 50 |
| 28 | 63 | University of Leeds | 49.8 |
| 29 | 68 | University of East Anglia | 49 |
| 30 | 68 | University of Nottingham | 49 |
| 31 | 74 | University of Exeter | 47.6 |
An attempt was made to determine whether or not there was a statistical correlation between the Website visibility rankings and the academic rankings of the top thirty-one UK universities. A Pearson correlation was initially considered but rejected because of its reliance on a normal distribution, which rankings do not present.
Finally, a Spearman (raw) test was done, which produced a p-value of 0.942 (see Table 11), thereby proving that there is no significant correlation between the two rankings and any apparent correlation is merely coincidental.
| Spearman's rho Correlations | ||
|---|---|---|
| Academic ranking | ||
| Web visibility ranking | Correlation coeffcient | -0.017 |
| Sig. (2-tailed) | 0.942 | |
| N | 21 | |
In conclusion it can be claimed that there is no correlation between academic and Website visibility rankings for UK universities. The author did not expect a strong correlation, since the factors used to determine them have no apparent link. Academic rankings are based on various elements of academic excellence, while visibility rankings are based on the application of good practice Web design for visibility. The UK results are according to the expectation.
These findings are in stark contrast to the study done on South African university Websites (Weideman 2011). The South African results are against the expectation and are considered to be an exception. The reasons for this difference in correlation between UK and South African university Website rankings are not immediately clear. One speculative answer is that it could be the result of the age difference between the two sets of universities. The United Kingdom as a country is much older than South Africa (only 361 years old in 2013). Secondly, some of the younger, and recently merged, South African universities are still hampered by the country's past of racial segregation, and of being deprived of basic resources. Expertise in Website design is one of these resources. Thirdly, the sample sizes for the two studies differ: twenty-three out of a population of twenty-three for South Africa, versus thirty-eight out of approximately 150 for the UK. Finally, another possible reason for this difference is the attitude of the staff members of the respective universities from the two countries. The UK is an established first world country, which has achieved much over centuries, including academic excellence. South Africa, being relatively young, still has to establish itself in many areas and a spirit of competition is evident on many levels of society. It could be that some South African academics automatically strive towards more than one type of achievement, both academic and technical in this case. UK university staff could be more complacent, where academics focus more strongly on excelling in their own sphere, rather than including other areas as well. Even though academics normally do not design university Web pages (typically done by technical staff), they often have to provide content to populate these Web pages. However, this is pure speculation and detailed research on the last concept falls outside the scope of this study. Further research on the technical issues at stake would be required to investigate elements of this phenomenon.
Another expansion of this research project could include the use of professional programs to do the measurement of the visibility of homepages. A new approach would be to obtain the keywords and phrases for which home pages should be optimised (from the universities themselves). These should then be used to do actual searches on search engines and use the search engine result positions of the participating university homepages to rank them.
Acknowledgements
The author would like to acknowledge Mrs Prashini Rughanandan and Mrs Corrie Uys, for their assistance with the empirical and statistical work of this research project.
About the author
Melius Weideman is a Professor heading the Website Attributes Research Centre at the Cape Peninsula University of Technology in Cape Town. He graduated with a PhD in Information Science from the University of Cape Town in 2001, and focuses his research on Website visibility and usability. He can be contacted at: weidemanm@cput.ac.za