Analysis of the user queries of an e-commerce bookstore in terms of the Library of Congress classification and key publishers
David F. Nettleton, Ricardo Baeza-Yates
Department of Information Technology and Communications
Mari-Carmen Marcos
Department of Communication
Universitat Pompeu Fabra, c/Roc Boronat, 138 - 08018 Barcelona, Spain
Introduction
The organization of knowledge and information by humans is an essential endeavour in any academic field. Likewise, the study of how information organizes itself in natural or artificial systems is also essential in order to reveal underlying interrelations and inter-dependencies between different categories and items of information. As defined by Tague-Sutcliffe (1992) and more recently by Bar-Ilan (2008), 'informetrics is the study of the quantitative aspects of information in any form, not just records or bibliographies, and in any social group, not just scientists'. If informetrics is the most general area of study, then bibliometrics is more specifically concerned with the quantitative aspects of recorded information (bibliographies, libraries and so on), and Webometrics is concerned with metrics of the Web, the Internet or other online social networks.
In this paper, we are concerned with measuring some specific aspects of information derived from the query activity of the users in an online e-commerce book-store. Our users formulate queries which lead them to a Web page which contains links to one or more book summary pages. Some users formulate free-text queries containing information about the author, publisher or content of the book. Other users search for the book using the ISBN (International Standard Book Number), or browse the online catalogue and then click on the book title or cover icon. Independently of how the user searches for a book, the end result is a ‘hit' on an ISBN, that is, a unique book identifier. Furthermore, frequent book groupings (or affinities) can be identified as different users hit on the same or similar sets of books during a query session. This is the type of activity which we will analyse here, and we will use metrics which allow us to measure this activity in a way that is advantageous for the purposes of an online bookstore business. Three metrics will be used which depend on the representation of the data as a graph: communities, hubs and bridges. These concepts will be explained in more detail later in the paper, in the section on metrics. We can state intuitively that the 'community' metric groups together objects which have some kind of common affinity; secondly, the 'hub' metric identifies objects that have many links (are focal points); thirdly, the 'bridge' metric identifies objects that provide paths between different communities.
In the first part of the paper we consider the online bookstore environment, research objectives, motivation, experimental method, previous work, state of the art and book classification systems. In the second part of the paper we consider the technical aspects such as the definition of the data, sampling, extraction, formatting, user sessions and derived data. In the third part we explain how we have represented the bookstore activity log as a graph, and define the derived graph metrics (hubs, bridges and communities). In the fourth part of the paper we present the empirical analysis firstly in terms of the frequencies of the publishers and book categories in the tabular data. Then we perform a graph-based analysis by ranking the publishers and book categories in terms of the hub and bridge metrics. This is followed by the application of graph visualization techniques, using the Gephi software program (Bastian et al. 2009) and involving the extraction of communities and visualization of the resulting graph. We then identify the key publishers and book categories for each community, and perform a stability analysis on the communities over time. In the final section we summarize and conclude the present work.
Background: online bookstores
In this section we give some background of the environment from which the available study data have been obtained. The example we give in this section is not the actual Website we have analysed, which cannot be named for confidentiality reasons. However, it does give a good idea of the Website from which we have obtained the data, given that it has a similar functionality and structure.
In the Barnes and Noble Web site a user can enter from the home page, select the ‘Textbooks' option from the horizontal main menu, then choose the sub-category ‘Computer', after which the Website shows an ordered list of top matches of books for that sub-category. Typically, on the left an icon with the cover of the book is shown, and on the right-hand side the title, author, price, publisher and format. At this point, if the user wishes to see more details about a given book, s/he can click on the icon or on the title, which opens a page with more extensive information about the corresponding book. If we hover over the icon or the title with the mouse, we will see from the line which appears in the lower part of the browser, that the link is composed of the book title and its (13 digit) ISBN.
Another type of user accesses the Website remotely, that is, from another Website. A typical example of this is a referral Website such as a search engine (e.g., Google or Yahoo!) or a book price comparison agent (such asFetchBook.Info) which searches for and compares product prices from different Websites. In the case of online bookstores, an agent would crawl different online bookstores for the same book and return a price comparison with the corresponding references.
Another type of user would be librarians and employees of other bookstores who systematically search for book details and prices. Yet another distinct type of user would be non-human, that is, automatic processes or robots which search systematically to find details for large numbers of books online.
Hence, this user activity can be registered and described for each book reference accessed, by a Weblog line containing a user identification, timestamp and book ISBN. These are the data we analyse in this paper. We note that we do not consider or analyse free-text user queries, only the ISBN accessed. In the Weblog we analysed, queries with ISBN but without a free-text query accounted for 90% of all the queries made. The analysis of the free-text queries is out of the scope of the present paper and has been studied previously in detail in other works (Nettleton and Codina-Filba 2010; Codina-Filba and Nettleton 2010; Nettleton and Baeza-Yates 2008; Nettleton et al. 2007).Research objectives
The research objectives are summarized as follows:
- Represent Web activity data log as a graph. We have chosen a type of data log that is not typically processed in a graph format. Hence we have to consider issues such as how to define relations between the key objects (users and books) as nodes and edges of a graph.
- Analyse the data as a graph. We have to consider issues such as which graph metrics to use for the analysis.
- Evaluate utility of representation and analysis. The results of the graph analysis will be evaluated for the contribution of insight into the dynamics of the chosen data.
Motivation
The majority of data mining applications and studies of online Weblogs (excluding online social networks) tend to analyse the transactional data in a tabular form. However, less work has been done on representing and then analysing this transactional data as a graph. We will now briefly discuss this with reference to the literature.
In general, the field of data mining applied to commercial data has a strong focus on the analysis of transactional data using a tabular representation of the data as input to the posterior analysis and data modelling phases. This can be clearly seen in the focus of the current key reference books on data mining (Witten et al. 2011; Ratner 2012; Tsiptsis and Chorianopoulos 2010; Nisbet et al. 2009; Cleve et al. 2005).
Graph mining of commercial data, on the other hand, tends to focus on data which can be directly represented as a graph, such as telecommunications network data, online social networks, e-mail messages, geo-location data, and so on (Cook and Holder 2006; Aggarwal and Wang 2010).
From these works we could conclude that the mining of typical transactional data which cannot be directly represented as a graph, such as sequential customer activity logs, is generally processed in a tabular form without considering graph processing techniques. Two of the few examples of the graph mining of this kind of transactional data are from AlZoubi et al. (2011) and Huang and Chang (2009). We will look at these references in more detail later.
Notwithstanding this scenario (from the literature), we propose that if we represent the data as a graph, we can derive statistical factors and identify key elements in a way which offers a complementary vision of the data (with respect to traditional transaction mining) and which may give additional insights to the tabular data analysis. Some data mining techniques which are typically applied to tabular data are association analysis and rule induction to identify key profiles and tendencies.
In this paper we consider representing the access log of an e-commerce bookstore as a graph, deriving a book-book relation. This allows us to generate a set of graph mining metrics, based on communities, hubs and bridges. As mentioned previously, the 'community' metric groups together objects which have some kind of common affinity, the 'hub' metric identifies objects which have many links (are focal points) and the 'bridge' metric identifies objects which provide paths between different communities. Hence, these three metrics represent strategic characteristics of the graph data structure which can be interpreted in terms of the underlying data.These concepts will be explained in more detail later in the paper, in the section on metrics. Then, using these metrics we apply different statistical, visualization and modelling techniques to identify influential book categories and publishers. The book-book relation is derived in terms of books which are referenced in user query sessions, that is, two books are related if two or more users referenced both those books together in the same query session.
Hence, the motivation of the work is to provide actionable information to an analyst in the book publishing and sales sector, identifying trends and relations between publishers and book categories which may be otherwise undetected. In online bookstores, when a user queries a given book B, a list is often shown in some part of the screen of other books which also tend to be consulted together with book B, e.g., 'customers who viewed this item also viewed/bought…'. This is known as cross-selling and deciding which books to show can be derived from simple frequencies. Another sales ploy is up-selling, that is, getting the customer to buy something similar but more expensive.
Using graph analysis, by identifying hubs and bridges in a graphical representation of the relations between the books, publishers and categories, we can obtain information which may give additional insights for cross-selling. If we can identify a top list (which, however, is dynamic and changes over time), we can, for example, push these profiles to the customers and also make sure they are not excluded from the catalogue. A top list is understood as a list of the most relevant profiles (in terms of book categories and publishers) which not only sell the most but also boost the sales of other profiles. Also, bookstores often present a list of newly published titles first to visitors. Different factors can influence the choice of which titles to show.
In real terms, an online bookstore would have to evaluate the information extracted from a graph representation and compare it with the current baseline methods. Current methods may be simply generating a monthly report of frequencies of hits on book titles and categories, or more sophisticated methods may be used such as transactional data mining to extract frequent item sets and association rules.
Another key aspect for the online bookstore is the organization of the online catalogue: how to define the categories in the main menu and submenus, and which titles to focus on and include or exclude from the catalogue. Thus, by identifying key profiles, we can use these to build the core of the catalogue. In the current context (the data analysis of transactional logs) these profiles depend on the detected trends in the data. We analyse the data over a business period of three months, to detect aspects which are constant, and those which are transient.
Experimental method
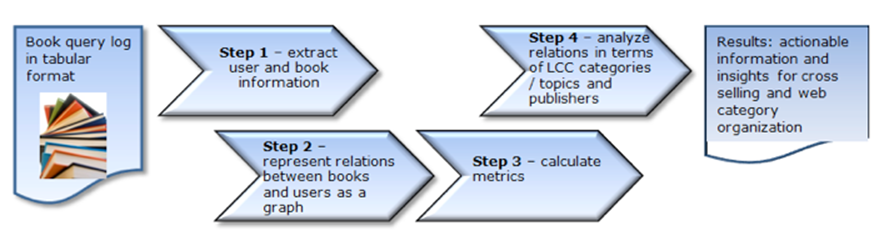
Figure 1 shows a schematic representation of the steps followed to convert the raw query log into actionable information. The experimental method shown in Figure 1 can be detailed as the following sequence of steps:- Pre-process data (extract from raw log, sample and filter).
- Java program loads data from step (i) into graph structure format, identifying relations between books and users, export data in graph relational format.
- Import graph relational format from step (ii) into Gephi graph software processing program (Bastian et al. 2009). Calculate graph metrics (communities, hubs and bridges).
- Gephi: visualize graphs, export data with community, bridge and hub values from Gephi.
- Analyse data exported from step (iv) to identify predominant/prototype publisher/book category profiles ranked by the hub and bridge metrics, and for each community.
- Calculate similarity of communities over time to quantify stability/volatility, using a normalized mutual information statistical technique.
Previous work and state of the art
We will first review the previous work in two areas: (a) graph analysis of online data, and (b) the analysis of online Web search logs. The former is concerned with the analysis of different types of information related with online social networks, from which the work in the current paper has evolved.
In the context of the graph analysis of online data, in previous work, different approaches have been adopted. For example, in Martinez-Arqué and Nettleton (2012) we considered and demonstrated how to representatively sample online graph data. Also, in Saez-Trumper et al. (2011) a graph representation of online social network data was analysed in order to identify key users and features. A comprehensive survey of the data mining of social networks represented as graphs. can be found in Nettleton (2013).
In the context of the analysis of online Web search logs, we also see a variety of problem areas which have been tackled. One approach is to try to define general behaviour models of the observed user activity. For example, in Nettleton and Codina-Filba (2010) a conceptual model was presented for Web search based on a cost function and an indicator that signals whether a given user will continue with a given search or not. Also, collective behaviour on the Internet was considered by Codina-Filba and Nettleton (2010) in which the Google Trends tool was used to derive tendencies based on the frequency of user Web queries. Another approach is to use a diversity of advanced analytical (data mining) techniques to extract knowledge from data logs. For example, in Nettleton and Baeza-Yates (2008) and Nettleton et al. (2007) a diversity of machine learning techniques were applied to select and group Web queries and answers, and to analyse Web search query sessions and clicked documents, from high-volume Web search engine logs.
Secondly, we will look at relevant work in the area of the processing of transactional data as a graph, or vice versa.
The DB-Subdue system (Chakravarthy et al. 2004) takes graph data and represents it in a way that can be processed by SQL queries. In order to achieve this, the graph is represented by a tree data structure, which allows queries, including joins, on relations and substructure matching. The C-Trend system (Adomavicius and Bockstedt 2008) on the other hand, maps multi-attribute temporal data to a two-dimensional directed graph which is then analysed to identify trends over time for telecommunications network transaction data. In Cortes et al. (2004) telecommunication network IDs are defined as the nodes and the edges represent the communication between pairs of network IDs. The chosen data structure and update method allows a representation of the graph and its evolution over time. It also allows the identification of sub-graphs, defined as communities of interest, which can be used for fraud detection.
The National Institute on Complex Data Structures is a Canadian research group that specialises in the representation and mining of transactional data as graphs. As one of their projects, they developed statistical models and techniques to analyse network structure and relationships between nodes on the graph, using only the transactional data. Another approach of this group is to use unsupervised learning to identify groups of nodes that have similar network behaviour, or form cliques with a high mutual interactivity. Another approach of used by this group is to use supervised learning techniques to predict the characteristics of a node, using as input the node's communication activity.
The application of graph partitioning to document clustering is considered by Ding et al. (2001). The authors construct a word-document matrix based on a calculation of mutual information between words and documents. Their partitioning method uses a min-max cut algorithm which the authors claim results in partitions which are better balanced and have a greater quality.
Another work which has applied a graph representation to telephony transactional data is that of Volinsky (2010). The author incorporates the temporal dimension to analyse the evolution over time (often short periods such as two days) in order to identify fraudulent groups of users and viral marketing. The data is sparse in nature and therefore, for efficiency reasons, the author's approach opts for storing one large graph as many small graphs.
From the literature we conclude that a significant interest has been shown in the analysis of telecommunications transaction data incorporating the temporal dimension (Adomavicius and Boekstedt 2008; Cortes et al. 2004). Exceptions to this are the work of Chakravarthy et al. (2004) who applied a generic method which does not include time, and Ding et al. (2001) who applied a graph representation to document clustering, again without the temporal aspect. Singh (2007), Singh et al. (2007) and Gretarsson et al. (2011) consider graphs with multiple node and edge types, with special application to graph visualization, and in Caravelli et al. (2009) multi-modal graphs are applied to the representation of biological data. Although the literature is not very extensive on this last theme, several visualization applications and representation languages exist whose objective is to process multi-modal graphs (ISO 1997; Gretarsson et al. 2009; Carey and Bell 1997).
In the final part of the state of the art we will briefly look at some of the current ideas for metrics and how to identify relations between the entities represented in the graph.
Chidlovskii (2011) considers the problem of item recommendation in social media sharing systems. The paper presents a novel method for learning the optimal contribution of each relation to a given recommendation task, by minimizing a loss function on the training dataset. Luo et al. (2011) describe a social diffusion process, which is used to evolve a graph based on interactions between the participants, forming cliques and other graph structures. It represents a stochastic process in which clusters are identified by a k-nearest neighbour type process using a Euclidean distance. He (2011) considers the mining social influence in a graph. Given pair-wise influences between researchers, the authors propose three model variants: a simple additive model, a weighted additive model and a clustering-based additive model. Steyvers and Griffiths (2007) consider the problem of clustering large graph databases and propose the following metrics: (i) node similarity based on topical affinity or topical interaction strength; (ii) edge feature metric which determines if an edge exists between two given nodes; (iii) a global metric which measures the representativeness of a node on a specific topic.
Finally, AlZoubi et al. (2011) propose a graph-based approach to generate Boolean association rules from a large database of customer transactions. The method scans the database once to construct an association graph and then traverses the graph to generate all large item-sets (set of items that occur together). The objective of their work was to reduce the computation cost of processing large item-sets, given that other algorithms need to make multiple passes over the database, whereas the graph representation approach only needs one pass. Huang and Chang (2009) carried out similar work before Alzoubi but using synthetic data instead of the real dataset used by AlZoubi.
Book classification
In the present work we have used the Library of Congress classification as a reference for book categories. One determining aspect for using the Library of Congress instead of the Dewey system was that the online bookstore was based in the United States and it was found that a greater number of the books in the search log were identifiable using the Library of Congress value rather than the Dewey value. The Library of Congress Classification is a system of library classification designed specifically for the purposes and collection of the Library of Congress of the United States. It has been said that the Library of Congress classification lacks a sound theoretical basis (Hjørland and Smiraglia 2008; Broughton 2004) given that many of the classification decisions were determined by practical requirements of the Library of Congress, rather than being based on classification theory.
Another alternative classification method is BISAC (Book Industry Standards and Communications), whose subjects headings are designed from a more commercial point of view for the book publishing industry. The BISAC suggests a structure which a bookstore could use to present its sales offering to the customer. However, in the case of online bookstores, many do not follow the BISAC structure and instead design their own customized categorization, which we assume depends on their own customer behaviour and profile analysis. This is the case for the online bookstore considered in the present study, and, for example, that of Barnes and Noble. Also, the BISAC categorization is less detailed than the Library of Congress classification. In the light of these two considerations we decided to use the Library of Congress classification.
The online bookstore we consider specialises in technical books, although it does sell books from other areas. As an example, computer software books would be categorized as follows. The top level class is Q (Science), the second subdivision QA1-939 (Mathematics), the third subdivision QA71-90 (Instruments and machines), the fourth subdivision is QA75-76.95 (calculating machines), the fifth subdivision is QA75.5-76.95 (electronic computers, computer science), and the sixth subdivision QA76.75-76.765 (computer software). However, if we take the specific case of a given book on Java programming, its full reference is found to be QA76.73.J38, that is, it falls within the range of electronic computers, computer science, but not computer software. Here, we propose to obtain a more natural (user query driven) grouping of the books, but retaining as a reference the more rigid or artificial Library of Congress categories. In this way we can use the classification to index into natural groups and see where the Library of Congress categorization coincides with our user query driven grouping, and where it does not.
Data and data formatting
The data are taken from an online bookstore based in the United States, which is medium sized in terms of sales volume. For confidentiality reasons we cannot disclose the name or specific details of the business. We can say that the content and functionality of the bookstore is similar to that of the example given previously.
Data description
In the following sub-sections, we will describe the data extraction processing, sampling, formatting, pre-processing, derived data processing, and finally give an example of log data and data extraction/pre-processing.
Data extraction, sampling and formatting
With respect to data selection, the ecommerce bookstore data log registers sixty days of user activity with respect to book queries, recorded from 15th January 2004 to 15th March 2004. With reference to the age of the data used (2004), we justify this because of the limited availability of Weblogs from online commercial Websites of this type. Also, we note that the aspects that we analyse in this paper (the relation between the access frequencies in terms of the Library of Congress category and the publishers) will not have changed significantly since 2004. Thus, the results presented are still valid. Finally, the techniques presented in the paper can be applied to similar, more recent data, if the reader possesses such data. That is, the techniques are atemporal and therefore do not depend on the data itself.
Users are identified by extracting the IP address and a unique 10 character alphanumeric user ID from the data log. The user ID is necessary because different users may be accessing from the same IP address. The application requires the users to identify themselves (login) with a valid user ID.
First we made a pseudo-random selection of five days from the total of sixty days, in order to sample the data and obtain a manageable volume for graph processing given our hardware and software capacity. The days chosen were working days (Monday to Friday), because we are interested in working day business activity. The data from Saturdays and Sundays was found to be somewhat different from the weekdays and its analysis is out of the scope of the current paper. We followed a standard statistical sampling procedure (Lohr 2009; Deming 1966), including checking that the extracted daily samples were representative of all the available workdays in the complete sixty day range of data. This was performed by comparing the similarity of the distributions of key variables, categories and statistical properties. We specifically checked the query frequencies and volumes, distribution of frequencies of publishers and book categories, among other attributes, for each of the extracted days, and compared them with the same frequencies for the workdays of the whole sixty day range.
As we have mentioned, we limited the amount of data by sampling, given that, although this volume of records may seem trivial for tabular analysis, when converted into a graphical representation it can produce a combinatorial explosion, due to the connectivity and topology of the graph. Hence, the volume extracted was considered as the limit of the computational capacity of the hardware and software that we had available to process the data as a graph. Also, many typical graph analysis processes, such as the calculation of statistics (e.g., average path length), have a high computational cost, which has to be taken into account.
For each day we have selected the data from 0830 to 1830h because this is the prime business- or working-hour time period of interest. Each day represents a distinct day of the week (Monday to Friday) and the five days span the whole time period: 15th January, 27th January, 2nd February, 11th February and 12 March. We have sampled the data based on frequency of occurrence for books and users, in order to eliminate high volume robot and application programming interface users.
Definition of a user session or query
A query is defined as an access to a given ISBN, as described previously. We do not consider or analyse free-text user queries, only the ISBN accessed. Hence a query session is a sequence of accesses to ISBNs by the same user. We note that in the present work we do not analyse or distinguish individual query sessions, rather we consider the complete set of books (maximum of twenty-one) consulted by a user in a ten-hour period.
With respect to a user session, we defined a maximum of twenty-one book accesses in a given ten-hour period (0830 to 1830). This threshold was established by empirical study of the query sessions, in which it was observed that users with high access frequencies (for example, hundreds) were not individual users but were associated with robots or application programming interfaces. The sessions consisting of less than twenty-one queries were found by extensive observation to be coherent individual sessions. This threshold may appear high in the first instance, but, as explained previously, the access log includes professional users such as librarians and employees of other bookstores who make systematic searches.
We defined a minimum frequency of two for the user-book relation, that is, at least two different users must have searched for a given book in the defined time period. Thus our study deals with the medium frequency items (books and users). This gives us an average of 450 distinct books in the ten hour period. For the users, it gives us an average of 300 distinct users over the same ten hour period. For example, in the data file corresponding to 15th January 2004, there are a total of 132,214 records, of which we extracted 12,587 valid records.
We note that an action is something done by a user in the website, such as selecting a book icon and clicking on it, or formulating a free-text query in the search box. In Table 1, which shows an extract of the user Web activity log, in column 4 we see that all the user actions are 'SELECT'; in column 5 of Table 1 we see the detail of the action, which includes the ISBN number of the book selected, the user ID and the session ID (these data will be explained in more detail in the following sections); finally, in column 6 of Table 1 we see the action code which indicates if the user action terminated correctly (indicated by 1) or not (indicated by -1).
Data validation filters:
- Action code must be 1 (ok): gives a total of 122,959 records
- Must be a valid ISBN in the action field: gives a total of 80,046 records.
- Only users whose total number of book consultations was less than twenty-one in one day's data (0830 to 1830): gives 12,587 records.
Later in this section, we will see how these filters are applied to real data.
Derived data
The International Standard Book Number is a unique identifier for books, which has been adopted as an international standard. We have used the ten digit version which has four components: a group/country/language identifier; the publisher code; an item number (the specific book); and a checksum character or check digit. For example, if the ISBN is 81-7525-766-0, the group will be 81, the publisher 7525, the title 766 and the check digit 0. We note that the length of the publisher code is variable.
From the data records, we extracted the session ID (which we interpret as the user ID), the date, time, time zone, and ISBN. The session ID is made up of the first ten alpha-numerical characters after the slash ‘/' in the action field (see Table 1). However, the first six characters are the unique identifier and the last four characters vary on each distinct access (to prevent caching between the client and the bookstore server). Other derived data has been obtained by developing an application programming interface in Java to access the Library of Congress online catalogue using the ISBN to obtain the title, topic classification (Library of Congress) and publisher for each corresponding book. This additional information, not available in the original log file, is important to interpret the results and identify the books by topic and publisher. We programmed the graph data structures in Java, using hash tables and adjacency lists for computational efficiency.
Hence, the data extraction and data quality processing can be summarized by the following three points:
- Filter out invalid user records: robots, application programming interfaces and Internet service providers.
- Filter out invalid records: those with no ISBN, and/or action code incorrect.
- Enrich the data records with additional information: book category and pub-lisher derivable from ISBN.
Example of log data and data extraction and pre-processing
In Table 1 we see an example of the raw Web log. The first field is the IP (Internet Protocol) address of the visitor, the second field is the date and time stamp, the third field is the time zone (-7 means 7 hours before Greenwich Mean Time, that is, Pacific Standard Time), the fourth field is the Web page action, the fifth field contains the action details or parameters, the sixth field contains the action code. The records are ordered chronologically by the second field. In Table 1 we see that in general the IP address agrees with the user ID, however as we mentioned previously different users (with distinct user IDs) can have the same IP address. This is the case when the IP address corresponds to an Internet service provider server or a server to which several different user PCs are connected. Also, some users have dynamic IPs (which change over time); hence one user can have different IP addresses in the IP field for different accesses. Thus, the user ID is the reliable unique identifier used to identify the users and user query sessions, instead of the IP address.
| IP address | Date & time | Time zone | Action name | Action detail | Action code |
|---|---|---|---|---|---|
| 891.12.123.71 | 15/Jan: 08:34:40 | -07 | SELECT | /klw8hcdpp0/sm/0596004842 | 1 |
| 99.432.15.11 | 15/Jan: 08:34:45 | -07 | SELECT | /fsw.gif | -1 |
| 891.12.111.71 | 15/Jan: 08:35:06 | -07 | SELECT | /klw8hcdpp0/sm/0321115619 | 1 |
| 32.64.128.256 | 15/Jan:08:35:39 | -07 | SELECT | /81nue1k1t6/sm/0072930969 | 1 |
| 17.19.23.29 | 15/Jan:08:35:39 | -07 | SELECT | /83s33j6t8m/ss/L?su=mql | 1 |
| 22.640.23.170 | 15/Jan:08:35:40 | -07 | SELECT | /ncfksakrmn/sm/0735618992 | 1 |
| 412.910.321.126 | 15/Jan:08:35:40 | -07 | SELECT | / md7x7h 1i1i/ss/1?qs=gamma&Go.x=0&Go. | 1 |
| 891.12.111.71 | 15/Jan: 08:36:27 | -07 | SELECT | /klw8hc33z1/sm/0201710382 | 1 |
| 310.103.159.21 | 15/Jan:08:36:28 | -07 | SELECT | /5wt9g1tyx1/sm/1587051346 | 1 |
| 521.161.1.15 | 15/Jan:08:36:30 | -07 | SELECT | /5jc8p4a23r/fi HTTP/1.0 | -1 |
| 19.333.010.64 | 15/Jan:08:37:41 | -07 | SELECT | /gaaieu9ho4/ss/1?qs=art+of+problem+solving | 1 |
| 891.12.111.71 | 15/Jan: 08:41:11 | -07 | SELECT | /klw8hcndh8/sm/076453484X | 1 |
From the action detail field (field 5) of Table 1 we can see that the first record contains an ISBN number, 0596004842, and a user ID, klw8hc (as we explained previously, the first six alphanumerical characters after the ‘/' of the action detail). In terms of data extraction, we had to process the date and time field and the action detail field in order to obtain a reformatted version of the date, time, ISBN, and user ID. We have highlighted the four records corresponding to user klw8hc as we will follow these records through Tables 2 and 3.
| IP address | Date | Time | Time zone | User ID | ISBN |
|---|---|---|---|---|---|
| 891.12.123.71 | 15/01 | 08:34:40 | -07 | klw8hc | 0596004842 |
| 891.12.123.71 | 15/01 | 08:35:06 | -07 | klw8hc | 0321115619 |
| 32.64.128.256 | 15/01 | 08:35:39 | -07 | 81nue1 | 0072930969 |
| 22.640.23.170 | 15/01 | 08:35:40 | -07 | ncfksa | 0735618992 |
| 891.12.123.71 | 15/01 | 08:36:27 | -07 | klw8hc | 0201710382 |
| 310.103.159.21 | 15/01 | 08:36:28 | -07 | 5wt9g1 | 1587051346 |
| 891.12.123.71 | 15/01 | 08:41:11 | -07 | klw8hc | 076453484X |
Table 2 shows the information extracted in the desired format into separate database fields. In Table 2 there are seven records, which correspond to the records in Table 1 which had a valid ISBN and action code. Again we see the four records highlighted which correspond to user ‘klw8hc'.
| User ID | Time | LCC category | Publisher | Title |
|---|---|---|---|---|
| klw8hc | 08:34:40 | TK5105.888 Electrical engineering | O'Reilly | Learning Web design |
| klw8hc | 08:35:06 | TK5105.8885 Electrical engineering | Peachpit | Adobe Photoshop 7 Web design with GoLive 6 |
| klw8hc | 08:36:27 | TK5105.888 Electrical engineering | Addison-Wesley | The non-designer's Web book |
| klw8hc | 08:41:11 | QA76.76 Maths. | I.D.G. Books World-wide | Creating cool HTML 4 Web pages |
| 5bdua1 | 15:50:52 | QA76.73.S67 Maths. | O'Reilly | Oracle PL/SQL programming |
| 5bdua1 | 15:51:43 | QA76.76 Maths. | O'Reilly | Mastering Oracle SQL |
| 5bdua1 | 15:51:51 | QA76.9.D3 Maths. | McGraw-Hill | Oracle9i : the complete reference |
| 5bdua1 | 15:54:40 | QA76.73.S67 Maths. | O'Reilly | Oracle PL/SQL programming |
| ma3bs5 | 16:38:42 | QA76.9.D3 Maths. | McGraw-Hill | Oracle9i : the complete reference |
| ma3bs5 | 16:46:46 | QA76.76 Maths. | O'Reilly | Mastering Oracle SQL |
| ma3bs5 | 16:47:04 | QA76.9.D3 Maths. | McGraw-Hill | Oracle9i : the complete reference |
Finally, in Table 3, we see an example of the data synthesized into user sessions, that is, sequences of book queries originating from the same user. Table 3 shows three query sessions for three different users, the first corresponding to user ID ‘klw8hc'. The first query session runs from 08:34:40 to 08:41:11 and contains four book queries, the second query session runs from 15:50:52 to 15:54:40 and contains four queries, and the third query session runs from 16:38:42 to 16:47:04 and contains three queries.
Graph representation of data and metrics
In this section we explain how we have represented the bookstore activity log as a graph, and define the derived graph metrics (hubs, bridges and communities) which we use in the empirical section to analyse the data as a graph.
In terms of graph processing, we create different graph structures, based on the two main data objects which exist in the data: the user and the book. This creates three different visions of the data: user-book/book-user, book-book and user-user.
(i) The raw data consists of records of queries of books by users. A user can realize N queries of M books, which can consist of multiple queries of the same book. A user is identified by a session ID and a book is identified by an ISBN code.
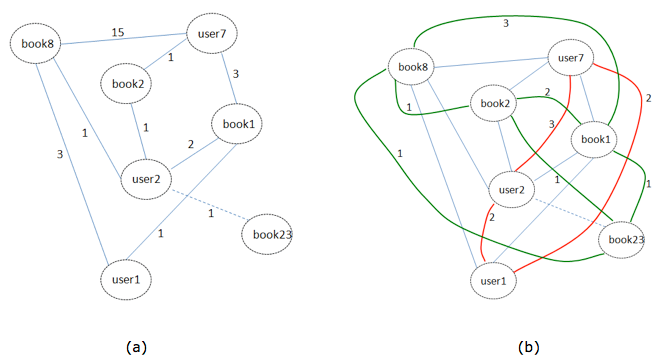
In Figure 2a we see an example of a graph constructed using these two types of nodes. We observe that book 8 has been queried fifteen times by user 7, once by user 2 and three times by user 1. On the other hand, we can deduce that user 7 has queried books 8, 2 and 1 with the frequencies indicated on the corresponding edges.
(ii) In Figure 2b we see a graph which is derived from the graph of Figure 2a, and in which there are edges between the book nodes. The number 3 on the link between books 1 and 8 means that three users (users 7, 2 and 1) searched for books 1 and 8 together (co-occurrences).
(iii) Also in Figure 2b we see another type of edge, defined between user type nodes. The number 3 on the link between users 7 and 2 means that user 7 searched for 3 books (ISBNs) which user 2 also searched for.
Derived metrics
We used three key metrics to evaluate the information contained in the graph: hub, bridge, community modularity. We also define a normalized mutual information (NMI) method for evaluating the stability/volatility of the communities over time. These metrics are described in the following text.
Hub metric - HITS
A hub node is characterized by having a large number of direct connections to other nodes. In order to quantify the hub value of a node, we have used the popular HITS algorithm, as defined by Kleinberg (1999).
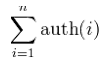
As well as the characteristics of the hub node itself, HITS also takes into account the characteristics of the neighbor nodes of the hub node. HITS (signifying Hyperlink-Induced Topic Search) calculates two values for each node, a hub value and an authority value which are defined in terms of one another. The authority value of a node x is the sum of the normalized hub values of the nodes that point to x. The hub value of a node x is the sum of the normalized authority values of the nodes that x points to. The process is as follows: Initially, ∀p , auth(p) = 1 and hub(p) = 1. Then, two two types of updates are performed, desginated as the Authority update rule and the Hub update rule. The hub/authority scores of each node are calculated by repeated iterations of the Authority Update Rule and the Hub Update Rule. This calculation gives an approximation of the scores whose precision depends on the number of iterations and the convergence/cut-off. Authority update rule: ∀p, auth(p) is updated by:
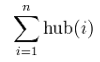
where n is the total number of nodes connected to p and i is a node connected to p. Hence, the Authority score of a node is the sum of all the Hub scores of nodes that point to it. Authority update rule: ∀p, hub(p) is updated by:
where n is the total number of nodes which p is connected to and i is a node which p is connected to. Hence, a node's Hub score is the sum of the Authority scores of all its linking nodes.
Bridge nodes
These are nodes which may not necessarily have a high frequency but which are strategically placed between other nodes such that they form a key part of the graph's connectivity. That is, their removal would cause a major disruption to the graph. Bridge nodes can be quantified by different metrics. One of the most commonly used is betweenness centrality, which is calculated in terms of the number of critical paths which go through a given node, from or to other nodes. However, hub nodes also tend to have a relatively high betweenness centrality, and often obfuscate the presence of low frequency bridging nodes. Hence, in this paper we also consider a second metric, called bridging centrality (Hwang et al. 2008), which is effective in distinguishing bridge nodes, and differentiating them from hub nodes. Hwang defines the bridging centrality of a node as the product of the betweenness centrality (CB) and the bridging coefficient (BC).
For a given node v:
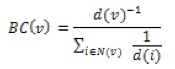
where d(v) is the degree of node v, and N(v) is the set of neighbours of node v. This value embodies local characteristics of node v. On the other hand, the betweenness centrality of node v is defined as:
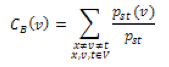
where Pst is the number of shortest paths from node s to t and Pst(v) is the number of shortest paths from s to t that pass through the node v. This value embodies global characteristics of node v. Finally, the bridging centrality of node v is defined as:
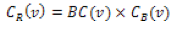
which combines the local and global bridging characteristics of v.
Extraction of communities from the graph data representation
We employ a specialized algorithm to detect communities within the graph, based on the optimization of a modularity measure. Blondel's Louvain method (Blondel et al. 2008) is used as implemented in the Gephi graph processing software (Bastian et al. 2009), which can be considered an optimization of Newman's method (Newman and Girvan 2004) in terms of computational cost. Firstly, it looks for smaller communities by optimizing modularity locally. As a second step, it aggregates nodes of the same community and builds a new network whose nodes are the communities. These two steps are repeated iteratively until the modularity value is maximized.
Evaluation of the stability of the communities using normalized mutual information
We have used as a starting point the formula defined by Strehl et al. (2000) and Manning (2008), which represents a quantification of cluster quality by measuring the relative proportions of each label class in each partition. In the current paper we define partitions as communities and the label class is publisher or topic. We also derive a variation of the basic formula, in which, instead of using all the partitions, we use only the top N communities, and instead of using all the publishers and topics, we only use the top N in each community. After studying the corresponding distributions, we assigned N=4. We call this variation the ‘Top N normalized mutual information'.
For example, consider the hypothetical case for community C1 on the 15th Jan. in which the top four topic categories are A, B, C and D, and the top four categories for community C2 in the same dataset are A, B, C and E. Then, in order to calculate the NMI, we will include the frequencies for C1 of A, B, C, D and E, and for C2 of A, B, C, E and D. The same is then performed for communities C3 and C4 in order to obtain the list of topic categories for each community and then calculate the NMI values for all four communities. If there are four partitions and four possible top classes per partition, this will mean that each partition will have a maximum of 16 classes (four of its own + four from each of the other three if they are all disjunctive) and a minimum of 4 classes (when the top four classes of all partitions co-incide).
We do this for two reasons: (i) to focus on the most significant partitions and classes given the high number of small communities (partitions) and low frequency publishers and topics (labelled classes); (ii) to reduce the computational cost of the calculation so that we can do it more easily on the fly. We can do this as long as we specify the same mutual universe of partitions and classes for each partition and class, and calculate the subtotals accordingly.
The formula is as follows:
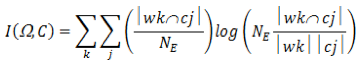
where Ω = w1, w2, …, wk are the clusters or partitions, C = c1, c2, …, cj are the labelled classes, and NE is the total number of elements. As we have commented, we previously identify the top four partitions and classes by a simple frequency calculation, and then proceed by using formula (6). This interpretation assumes maximum likelihood estimates of the probabilities, that is, the estimate of each probability is the corresponding relative frequency.
Initial exploration of the tabular dataset
In this section we present an initial exploration of the tabular dataset, which will allow us to obtain an idea of which publishers and book categories are the most important. By calculating the frequencies, this will allow us to compare the top ranked publishers and book categories in the tabular data with those identified by the graphical representation.
After visual inspection of the data, we confirmed that there is no relation between book types, publishers or book-book, user-user or book-user relations and the day of the week. Hence, any changes observed will be caused by other factors, for example, the evolution over a period of sixty days. In Table 4 we see the top five publishers for the 15th January and the 12th of March, marking the beginning and the end of the log period. We observe the same publishers, but in a different order and slightly different proportions. In Table 5 we see the top five Library of Congress categories for the same two days. We observe that two of the top five categories change and the percentage shares are in general higher for the top five for 12th March, in comparison with 15th January.
| 15 January | 12 March | ||
|---|---|---|---|
| Publisher | % | Publisher | % |
| O’Reilly | 0.1425 | Sybex | 0.1240 |
| Microsoft Press | 0.1351 | Addison-Wesley | 0.0983 |
| Prentice-Hall | 0.0899 | Prentice-Hall | 0.0599 |
| Addison-Wesley | 0.0724 | Microsoft Press | 0.0321 |
| Sybex | 0.0561 | O’Reilly | 0.0321 |
| 15 January | 12 March | ||||
|---|---|---|---|---|---|
| LC Class | % | Themes | LC Class | % | Themes |
| QA76.3 | 0.1353 | Programming, operating systems, databases. | QA76.76.063 | 0.173 | Operating systems |
| QA76.76.063 | 0.1007 | Operating systems | QA76.73.J38 | 0.104 | Java programming |
| QA76.73.J38 | 0.0552 | Java programming | QA76.9.D3 | 0.098 | Databases |
| QA76.9.D3 | 0.0441 | Databases | QA76.73.C153 | 0.087 | C++ programming |
| QA76.9.C55 | 0.0278 | Databases | QA76.76.H94 | 0.060 | Markup languages: HTML, XML |
Analysis based on graph metrics and visualization
In this section we present and interpret the visualizations of the book-book graphs generated using the Gephi program (Bastian et al. 2009). We identify key hub and bridge nodes, and then apply Blondel’s modularity metric (Blondel et al. 2008) to identify communities, which can be seen in Figures 3 and 4, identified by different colours and labels C1 to C4. The size of the node in Figures 3 and 4 is proportional to the between-ness centrality value. In these figures, we have filtered out nodes with a frequency less than 100 for the sake of clarity (N.B., in the underlying dataset the nodes are not filtered). The complete graphs have between 2500 and 3000 nodes per day. The coloured shading and labels in Figures 3 and 4 indicate the different communities identified. For all the graph visualizations, we have used the Gephi 0.8 alpha software and the Force Atlas layout option (Hu 2005; Noak 2006).
As we commented previously, the samples extracted were checked in order to establish that they were representative of the complete dataset. That is, the key statistics of the dataset (distributions of key variables, correlations of degree and clustering coefficient of the nodes and edges, standard deviations, diversity of book and publisher categories, etc.) are similar (Martinez-Arqué and Nettleton 2012).
Statistics based on graph metrics
From Table 6 we observe that two categories, information technology and health, have the highest frequencies as top five categories, both for hub/betweenness centrality and bridging centrality, and are those which repeat most over different days. On 15th January for the hub/betweenness centrality metric, we see that the top five book categories were health, information technology, religion and history in that order. Also, there were two information technology books in the top five, and the other book categories occurred once. From Table 7 we observe that for hub/betweenness centrality, three publishers are seen to predominate, each on different days: Mayfield Publishing Company, IDG Books Worldwide and Lippincott Williams & Wilkins. The books published by Lippincott were on medicine, those of IDG were information technology books, and those of Mayfield Publishing Company cover a diversity of topics. For bridging centrality we do not see any clear tendency in terms of frequency of occurrence of publisher.
| Date | Hub/Betweenness centrality | Bridging centrality |
|---|---|---|
| Thurs 15 Jan | Health (1), Information technology (2), Religion (1), History (1) | Religion (1), Health (1), Finance (1), Arte/Design (1), Theatre (1) |
| Tues 27 Jan | Health (1), Philosophy (1), Anthropology (1), Fiction(2) | Architecture (1), Law (1), Economics (1), Information technology (1), Health (1) |
| Mon 2 Feb | Information technology (4), Religion (1) | Religion (1), Art & design (2), History (1), Chemistry (1) |
| Wed 11 Feb | Health (4), Information technology (1) | Fiction (1), Information technology (2), Mathematics (2) |
| Fri 12 Mar | Information technology (1), Photography (1), Literature (1), Applied Psychology (1), Fiction (1) | Art (1), Literature (1), Information technology (1), Engineering (1), Education (1) |
| Date | Hub/Betweenness centrality | Bridging centrality |
|---|---|---|
| Thurs 15 Jan | OBooks (1), Autodesk (1), Broadman (1), Vintage (1), Benjamin (1) | Baker Books (1), American Diabetes Assoc. (1), Westview Press (1), Tokyopop (1), McGraw Hill (1) |
| Tues 27 Jan | Mayfield Pub. Co. (3), Tor (1), Time Inc Home Ent. (1) | Norton (1), West Group (1), Addison-Wesley (1), Sams (1), Prentice-Hall (1) |
| Mon 2 Feb | IDG Books Worldwide (3), Frances Lincoln (1), Hungry Minds (1) | Abingdon Press (1), H.N.Abrams (1), Vintage Books (1), Scarecrow Press (1), Prentice-Hall (1) |
| Wed 11 Feb | Lippincott Williams &Wilkins (4), Premier (1) | Chronicle Books (1), Meredith (1), C&T Publishing (1), Oxford Univ. Press (1), F.A. Davis Company (1) |
| Fri 12 Mar | Sybex (2), Univ. Pennsylvania Press (1), Penguin (2) | Phaidon (1), Routledge (1), Sybex (1), Delmar (1), Allyn & Bacon (1) |
In terms purely of overall frequency in the dataset, the highest ranked books are all information technology, corresponding to Microsoft training material for Windows and SQL Server, Visual Basic .NET, and Cisco CCNA certification. This is consistent for all five days analysed.
Visualization of book-book relation
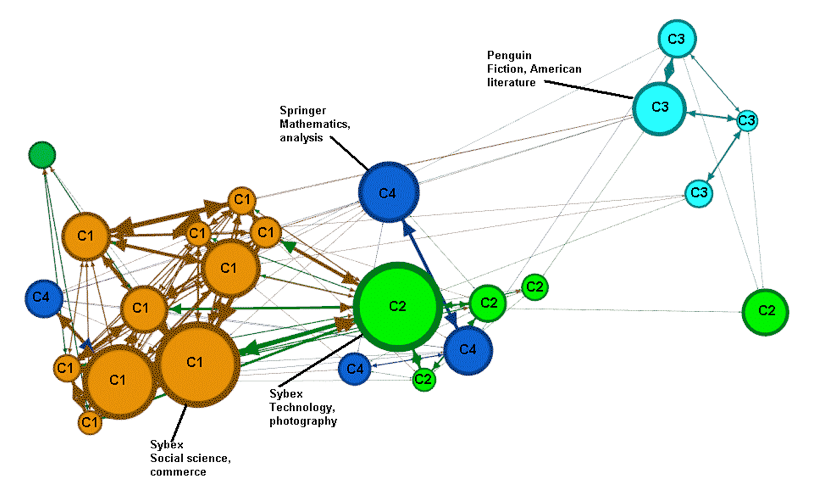
In Figures 3 and 4 we see the Force Altas visualization using the Gephi software for the first and last of the five selected days (the other three graphs are not shown for brevity). We have post-processed the graphs by choosing the visualization option in which the size of the nodes is proportional to the betweenness centrality metric (the betweenness centrality measures the number of shortest paths which run through a given node. Hence it defines a global bridge in the graph). Then we have used the modularity (community extraction) algorithm to identify the communities and label the nodes with their community identifier. Finally we have filtered the visualization to show only nodes whose frequency is greater than 100.
Before going into the analysis, we will comment how the graph representation is useful to the analysis of the data log. Firstly, we have to be open to thinking about the data as a multidimensional interrelated structure and not as sequential or tabular. Consider that data mining and statistical techniques such as clustering can be applied to the tabular data directly to project the data onto a lower dimensional (typically two dimensional) space which can be visualized on two axes. The Gephi software does something similar by generating a graph in which the distance between the nodes, the size of the nodes and the groupings (communities) are all based on real (quantitative) metrics. Therefore we can consider the interpretation of the graph visualizations as complementary to other data mining techniques. However, the interpretation of the graphs requires more know-how than that required for a simple histogram, plot or frequency table ranking.
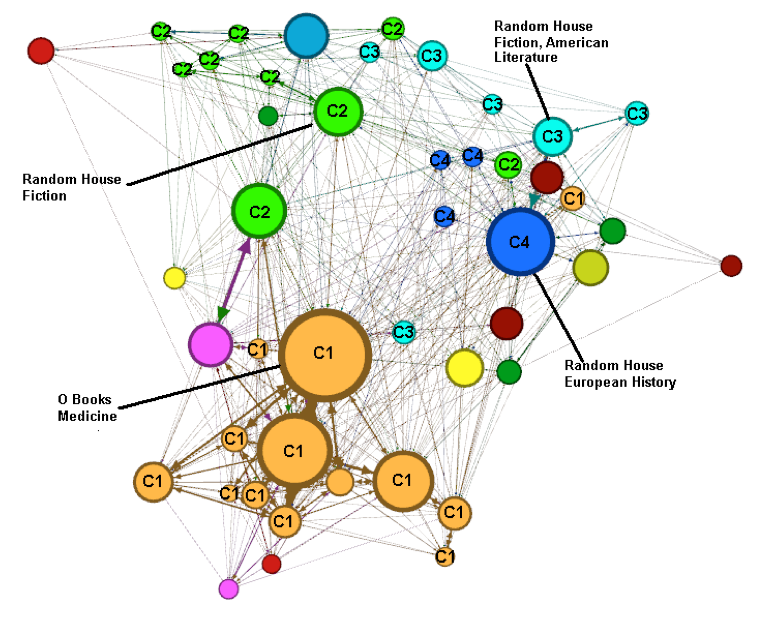
Thus, the top four communities (in terms of the modularity strength calculated by the community extraction algorithm) are identified by the labels C1 to C4. Also, we have labelled the biggest node in each community with its corresponding publisher and topic. For example, in Figure 3, we see community C1 occupies the lower part of the graph, community C2 is in the centre/top left, and C3 and C4 are in the top right. For com-munity C1, we see that the biggest node has the following characteristics: Publisher=O Books and Topic=Medicine.
Hence we could say that this node is the prototype of community C1, for which the dominant publisher and topic (though not the only ones) are O Books and Medicine respectively. The structural information represented by the graph allows for a more complex interpretation of the interrelations.
As we saw in Tables 4 and 5, the simple frequency-based analysis of the publishers and book categories in the web log was dominated by information technology, and medicine and fiction and their corresponding principal publishers were not present (or not considered significant). However, in the graph representation, we see that they have a structural importance.
Communities: comparison of the graphs
We will now consider the similarities and differences of the graphs generated for the five selected days, taking into account that they represent different reference points over time, and with respect to their community structure, key publishers and topics.
If we cross reference the top nodes for the communities (Table 8) with those shown in Tables 6 and 7 (hubs, column 2) for the corresponding dates, in general they coincide in terms of publisher and topic. This is because they both use the same metric (between-ness centrality) to identify the key nodes. For example, in Tables 6 and 7, for 15 January, health (medicine is considered a subtopic of health) is the top topic and O Books is the top publisher. In Figure 3 (15 January) and Table 8 (row 1) we also see that medicine and O Books are the topic and publisher associated with the biggest node in community C1. The same applies for the graphs corresponding to the other days (rows 2 to 5 of Table 8) and Figure 4 (12 March). The graphs of Figures 3 and 4 have been filtered so as only to show nodes with frequency > 100 for the sake of clarity.
| Graph | C1 | C2 | C3 | C4 |
|---|---|---|---|---|
| Thurs 15 Jan | O Books; medicine | Random House; fiction | Random House; fiction, American literature | Random House; European history |
| Tues 27 Jan | Mayfield Pub. Co.; philosophy | Mayfield Pub. Co.; health | Atheneum; leisure | Morrow; social science |
| Mon 2 Feb | IDG Books; computer software | IDG Books; computer operating systems | Atheneum; fiction, juvenile | Shambhala; architecture |
| Wed 11 Feb | Addison-Wesley; computer science | Lippincott; internal medicine | Lippincott; medicine, osteopathy | Premier Press; computer software |
| Fri 12 Mar | Sybex; social science, commerce | Sybex; technology, photography | Penguin; fiction, American literature | Springer; mathematics, analysis |
The conclusion with respect to the overall structure is that there are some general similarities which are constant and other aspects which are volatile for the five days sampled. In terms of the publishers and the topics, an initial interpretation is that the communities are defined more in terms of the topics rather than the publishers.
Analysis of volatility/stability over time of the main communities
In this section the objective is to establish if the communities identified in each of the five sampled days, change significantly over time. This can be a complex task; however, we can use a standard statistical technique (normalised mutual information) to compare the respective communities as clusters. This technique is generally used in statistics to quantify cluster quality. That is, it can be applied to compare clusters in any type of data, not just those in graph data. However, the communities themselves, as extracted by the Louvain Method (Blondel et al. 2008), are specific to graph analysis as their calculation is based on the graph topology.
In the context of the current work, we have used normalized mutual information to compare the communities (clusters) over different days to see if they were stable or if the book category and publisher assignments changed significantly over this period.
We used the normalized mutual information formula described previously to calculate this statistic for the top four communities and for the corresponding data for the five sampled days. We did this separately for the publishers and the Library of Congress categories. We used the publisher categories as they were and for the Library of Congress categories we took only the first letter as the class, in order to reduce the number of categories. Given the large number of Library of Congress categories and publishers with small frequencies, in both cases we have taken only the top four for each community. In order to do this we modified the basic normalized mutual information formula, as explained previously.
| Date | NMI LCC | NMI publisher | Modularity | ||
|---|---|---|---|---|---|
| Max. | Avg | Max | Avg | ||
| 15 Jan | 0.4753 | 0.1782 | 0.5774 | 0.2385 | 0.633 |
| 27 Jan | 0.3040 | 0.1379 | 0.4479 | 0.2966 | 0.657 |
| 2 Feb | 0.1607 | 0.0966 | 0.3421 | 0.2758 | 0.683 |
| 11 Feb | 0.3359 | 0.1803 | 0.3547 | 0.2610 | 0.701 |
| 12 Mar | 0.2010 | 0.1309 | 0.2823 | 0.2399 | 0.749 |
In Table 9 we see the maximum and average normalized mutual information values (see metrics section) for the Library of Congress categories and publishers for each day. We see a certain fluctuation over the different days for Library of Congress category and publisher, with 15th January and 11th February giving the highest values for Library of Congress category and 15th January, 27th January and 2nd February giving the highest values for publisher. We also see, in the last column of Table 9, the modularity value, which is a metric which measures the quality of the communities. It can be seen that the modularity value (seen in column 6 of Table 9) increases over the time period studied (going from 0.633 to 0.749). However, we can affirm that the quality of the community structure (which is what the modularity value measures) is similar for each of the corresponding dates. That is, a modularity value between 0.6 and 0.8 indicates a good quality of community structure.
| Date | LCC | Publisher |
|---|---|---|
| 15 Jan | H, P, Q, B, T | 13, 679, 8054, 7668, 8138, 8010 |
| 27 Jan | Q, T, P, H, B | 7674, 13, 7357, 7668, 7645, 19, 201, 534, 312, 688 |
| 2 Feb | Q, T, P, H | 13, 7645, 8118, 321, 7357, 689, 688, 201, 534 |
| 11 Feb | Q, T, H, P, R, B | 13, 201, 691, 324, 7817, 19, 321, 8036, 931836, 8247 |
| 12 Mar | Q, T, H, P, B, D | 7821, 14, 201, 415, 7167, 345, 8039, 8050, 8122, 7146, 930110 |
Table 10 shows, for each of the five days analysed, the top categories and publishers by the weighted frequency distribution (normalized mutual information subtotals) in communities. In Table 10 we see that publisher 13 (Prentice-Hall) and 201 (Addison-Wesley) are the only ones consistent throughout the period. Of the Library of Congress categories, we see that Q (science), T (technology), P (language and literature) and H (social sciences) are consistent throughout the time period. In conclusion, we can say that the top level Library of Congress categories are much more consistent than the publishers.
Discussion and lessons learned
Because of the volatile nature of online sales in general and the diversity of factors which influence the publishing industry in particular, it is difficult to obtain a data model which is robust over time. However, the information technology and health categories were identified in each of the five days' sampled datasets (Table 6). This information, given by the graph representation, was not present in the basic tabular frequency analysis of the book categories of Table 5, in which the information technology topics were dominant.
On the other hand, key publishers such as IDG Books and Prentice-Hall (Table 7) were dependent on the chosen day and did not follow a pattern over all the samples.
As a result of the data analysis and knowledge discovery, we can define two types of knowledge: (i) short-term volatile tactical knowledge which we must apply in the Web-site on the fly to show books related to the user’s Web search; (ii) medium and long term knowledge which we use to make strategic decisions about the catalogue design. For type (ii) we can use all our data mining techniques and algorithms to extract knowledge, however for type (i) we are strictly limited by computational cost (must be executable in less than 100 milliseconds) and the expected lifetime of the results.
Therefore, in the following we consider the metrics we have used in the current paper in terms of whether their computational cost would allow them to be used on the fly.
Top N normalized mutual information: yes, we can use this on the fly as it is calculated based on simple frequencies and limited to a maximum of four partitions and sixteen classes per partition;
Community identification (Modularity): yes, we can use Blondel’s fast algorithm;
Hub identification: yes, using the HITS algorithm and the degree values;
Bridge identification (betweenness and bridging centrality): no, this requires the calculation of all the average path lengths in the network, which has a high computational cost.
In order to solve the problem of the computational cost of calculating the bridges, we can consider two options: (a) only consider a given community or local region of the graph up to N hops around the prototype which identifies the user; (b) define some other metric or definition for a bridge which does not require the calculation of average path lengths. For example, we could identify nodes which connect the principal (top four) communities. As the community calculation is relatively fast, we can then identify nodes which have links between two or more of the top four communities. This metric could then be weighted by the number of such nodes identified.
Finally, we can comment that in practice, it would not be necessary to recalculate the metrics for the whole graph on the fly. Depending on the estimated lifetime of the current graph Gc (for example, using a metric which detects change in quality or graph structure between two given timestamps, or the number of newly queried books whose publishers or Library of Congress classifications are not found in Gc) it would only have to be regenerated once every MR hours. This would take into account that Gc represents the last N hours (which can overlap between days) of the ten-hour daytime periods, up-dated once every MR hours. N and MR could be calibrated based on the detected volatility of the key graph metrics, the default values being, for example, N=10 and MR =1.
Conclusions
From an informetric perspective, in the present work we have selected a set of metrics and a representation scheme which allow us to quantify information about user activity in an online bookstore. We have been able to measure the frequencies of individual book queries and common subsets of book queries, in terms of the publisher and the Library of Congress classification identifier. Furthermore, we have been able to measure structural characteristics about interrelations by using a graph representation for the book-book relation, and for book-pairs queried by multiple users. We have used graph structural information and concepts, such as hubs, bridges and communities, to identify dependencies and affinities. The books have then been described in terms of their corresponding Library of Congress categories and publishers. As we mentioned in the introduction to this paper, the Library of Congress classification is an artificial classification which in general is a reasonable model for partitioning topics, but which does not have a strong basis in information theory. From the user query driven groupings (communities, top ranked and dominant values) we have found in some cases a clear correspondence with the Library of Congress categories, and in other cases we have found groupings which contain a diversity of Library of Congress categories. Hence, the latter groupings require further study in order to establish the underlying affinities.
In terms of the three research objectives stated at the beginning of the paper, we have (i) successfully represented the Web activity data log as a graph, defining the relations between books and users based on activity; (ii) analysed the graphs based on the specific graph metrics of communities, hubs and bridges, and used the metrics to establish a ranking of the publishers and categories, together with visualization of the graph structure and identification of the dominant profiles for the four major communities; (iii) evaluated the utility of the analysis by using the graph structure to identify the key information of interest in terms of top publishers and book categories. The ranking and key topic and publisher information is in a form which can be interpreted by business experts in order to reorganize the Website menu structure and choose categories and publishers for cross-selling.
We propose that these metrics (hubs, bridges and community labels) can be used for two crucial aspects of the online bookstore business: (a) enhanced cross-selling of books (users who queried or bought this book or topic also queried or bought these other books or topics); (b) reorganization of the Website’s book catalogue, and the identification of which key books, categories or topics and publishers must be included. The Website’s selection menus, which allow the user to choose categories and subcategories of books, will be adapted as a consequence of the findings.
The graph representation has enabled us to identify significant topics, such as health and medicine or fiction, which were not previously identified as significant by the basic tabular frequency analysis of book topics, which is dominated by the information technology categories. Hence, we could recommend highlighting these topics in the selection menu of the Web page.
As a result of the data representation, metric calculations and data analysis, we have identified that a significant part of the data is volatile (relations vary over time) which means we need to extract knowledge and use it on the fly to show books related to the user’s Web search. We have made recommendations for how this could be done with some solutions for reducing computational complexity. On the other hand, the medium to long term knowledge can be used to make strategic decisions about catalogue design.
Acknowledgements
We would like to thank Sandra Alvarez García of the University of La Coruña, Spain, for the data pre-processing of the book information using their Library of Congress catalogue API. This research is partially supported by the Spanish MEC (project HIPERGRAPH TIN2009-14560-C03-01).
About the authors
David F. Nettleton is a Contract Researcher with the Web Research Group of the Universitat Pompeu Fabra, Barcelona, Spain and with the Data Privacy Group of the IIIA-CSIC, Bellaterra, Spain. He holds a Ph.D. in Artificial Intelligence from the Universitat Politècnica de Catalunya (Spain). He is Professional Member of the ACM and of the IEEE. Dr. Nettleton can be contacted at: david.nettleton@upf.edu.
Ricardo Baeza-Yates is Vice-President of Yahoo! Research Labs Europe and Latin-America. He was the founder of the Centre for Web Research in the Department of Computer Science of the University of Chile, and founder of the Web Research Group in the Information Technology Department of the Universitat Pompeu Fabra, Barcelona, Spain. He has a Ph.D. in Computer Science from the University of Waterloo, Ontario (Canada). Dr. Baeza Yates can be contacted at: ricardo.baeza@upf.edu.
Mari-Carmen Marcos is Associate Professor of Information and Library Sciences in the Department of Communication of the Universitat Pompeu Fabra (UPF), Barcelona. She received a Bachelors Degree and a Ph.D. in Information and Library Science from the Universidad Carlos III de Madrid and the Universidad de Zaragoza (Spain) respectively. She is a member of the Web Research Group at UPF. Dr. Marcos can be contacted at: mcarmen.marcos@upf.edu.