vol. 16 no. 1, March, 2011
vol. 16 no. 1, March, 2011 | ||||
The means of seeking health information has undergone huge changes in recent years, particularly the options provided by the Internet. As a result, people's assessment of information in various sources and channels may have altered. The paper examines how different groups of Icelander's evaluate the usefulness and the reliability of health and life-style information in different information channels. Furthermore, it explores how the evaluation has developed between 2002 and 2007. The study uses the term health and life-style which refers to the personal life-style choices made by people who are normally thought of as healthy and the impact this can have on their health and wellbeing (see also Pálsdóttir, 2009).
The concept of relevance has been identified as fundamental in relation to information behaviour. Reviews of the literature can for example be found by Borlund (2003), Saracevic (1975), Schamber (1994) and Mizzaro (1997). In spite of the significance of the concept it has proved difficult to define. The discussion has, to some extent, circled around the difference between ideas about two main classes of relevance, topicality or "system view", that is the match between the document and the query terms, and relevance as judged by the user, or how well the user feels that the information need is being met (see, for example, Harter 1992; Schamber 1994). Relevance judgements are described as being dynamic by their nature and change as people's knowledge structures change, as well as being multi-dimensional, that is different persons may judge the relevance of the same information differently (Schamber et al. 1990).
It has been suggested that the importance of relevance criteria, or the values that people use when they decide whether or not information is relevant to their need, is being assessed differently according to the topic and tasks which are being dealt with (Tang and Solomon 2001). Relevance criteria has been a subject of a number of studies and a range of criteria has been suggested (e.g., Barry 1994; Schamber 1994). Barry and Schamber (1998) have identified ten categories of relevance. Among them is depth, scope or specificity which refers how useful the information is, or how well it relates to the information need. Others have also identified usefulness of information as important criteria. Greisdorf (2003) argues that there exists a continuum, with people being most likely to evaluate topicality of the information, then pertinence and after that, the usefulness of the information.
According to Tang and Solomon (1998) the criteria used to judge relevance changes during the relevance process, leading to a modification of what information is considered to be needed, with usefulness being a criteria which people use in the later stages of the process. Another criteria of relevance which has been identified is reliability (Barry and Schamber 1998; Xu and Chen 2006). Reliability is related to and overlaps with several concepts such as trustworthiness, believability, credibility and quality of information (Savolainen 2007). In particular, the reliability of health information on the Internet has been discussed, with health specialists raising concern about the quality of the information (Bedell et al. 2004; Cline and Haynes 2001; Eysenbech et al. 2002). Previous studies have reported that people seek information on the Internet mainly because it is convenient, it offers a broad range of information and is up-to-date (Fox et al. 2000; Savolainen and Kari 2004) while less attention is being paid to the quality of the sources, such as accuracy, reliability and usefulness (Savolainen and Kari 2004).
Little is known about how the general public evaluates and compares health information in different information sources or channels but Fox and Jones (2009) have reported, that of those who seek health information online, 13% claim it to have had a major impact and 44% to have a minor impact on their health care. It has also been indicated that information on the Internet may be thought of as less reliable than information provided by health centres ( Marshall and Williams 2006). Furthermore, there has been a lack of studies who examine whether or not, or how, people's assessment of information has changed in line with the changes that have occurred within the information environment in the past years. Much of the research work in recent years has concentrated on how people seek and evaluate information on the Internet. In this study, however, the aim is to gain a more holistic picture by investigating how the general public's evaluation of information within a broad network of sources and channels has developed over a period of five years, between 2002 and 2007. The study concentrates on two criteria of evaluation, the usefulness and the reliability of information. It, furthermore, differs from traditional relevance research as it examines the participant's evaluations through a survey.
The data were gathered as postal surveys during the autumn of 2002 and spring 2007. For both data sets the sample consisted of 1,000 people, aged 18 to 80, randomly selected from the National Register of Persons in Iceland. The response rate was 51% in 2002 and 47% in 2007. Tables 1 and 2 present a comparison of the characteristics of the respondents with population parameters derived from Statistics Iceland.
| Demographic characteristics | Sample % (raw number) | Variation % | Confidence interval | Population % (raw number) |
|---|---|---|---|---|
| Sex | ||||
| Men | 45.4 (231) | +/- 4.3 | 41.0-49.7 | 50.01 (144,287) |
| Women | 54.6 (277) | +/- 4.3 | 50.3-59.0 | 49.99 (144,184) |
| Total | 100% (508) | 100% (203,046) | ||
| Age | ||||
| 18-29 | 22.6 (115) | +/- 3.7 | 18.9-26.3 | 15.1 (51,736) |
| 30-39 | 20.8 (106) | +/- 3.6 | 17.2-24.4 | 20.3 (41,714) |
| 40-49 | 22.0 (112) | +/- 3.7 | 18.4-25.7 | 21.1 (41,258) |
| 50-59 | 16.0 (81) | +/- 3.2 | 12.7-19.2 | 25.4 (31,482) |
| 60-80 | 18.6 (94) | +/- 3.4 | 15.2-22.0 | 18.1 (36,856) |
| Total | 100% (508) | 100% (203,046) | ||
| Education | ||||
| Primary | 31.6 (161) | +/- 4.1 | 27.5-35.7 | 43.9 (89,137) |
| Secundary | 44.2 (224) | +/- 4.3 | 39.9-48.5 | 43.9 (89,137) |
| University | 24.2 (123) | +/- 3.7 | 20.5-27.9 | 12.2 (24,772) |
| Total | 100 (508) | 100% (203,046) | ||
| Demographic characteristics | Sample % (raw number) | Variation % | Confidence interval | Population % (raw number) |
|---|---|---|---|---|
| Sex | ||||
| Men | 45.9 (215) | +/- 4.5 | 41.4-50.4 | 51.3 (114.424) |
| Women | 54.1 (253) | +/- 4.5 | 49.6-58.6 | 48.7 (108.437) |
| Total | 100% (468) | 100% (222.861) | ||
| Age | ||||
| 18-29 | 16.9 (79) | +/- 3.4 | 13.5-20.3 | 24.2 (53.970) |
| 30-39 | 18.9 (88) | +/- 3.6 | 15.3-22.5 | 19.8 (44.148) |
| 40-49 | 20.4 (96) | +/- 3.7 | 16.7-24.1 | 20.3 (45.174) |
| 50-59 | 17.6 (82) | +/- 3.5 | 14.1-21.1 | 17.0 (37.914) |
| 60-80 | 26.2 (123) | +/- 4.0 | 22.2-30.2 | 18.7 (41.655) |
| Total | 100 (468) | 100% (222.861) | ||
| Education | ||||
| Primary | 27.0 (127) | +/- 4.0 | 23.0-31.0 | 33.4 (74.435) |
| Secundary | 42.2 (197) | +/- 4.5 | 37.7-46.7 | 40.3 (89.813) |
| University | 30.8 (144) | +/- 4.2 | 26.6-35.0 | 26.3 (58.613) |
| Total | 100% (468) | 100% (222.861) | ||
Inspection of the confidence intervals in Table 1 and Table 2 shows that the distribution of age falls within the 95% confidence limits for three out of five age groups. Examination of the confidence intervals for sex in Table 1 and Table 2 shows that the distribution of men and women does not quite reflect the population. Educational level was measured as the highest level of education completed. Three levels were distinguished: primary school includes those who have finished compulsory education (ten years of education); secondary education (fourteen years) includes those who have completed vocational training, or secondary school; and university education. Inspection of confidence intervals in Table 1 and Table 2 shows that the ratio of people with secondary education is representative of the population. However, more people with university education and fewer with primary school education responded to the questionnaire, compared with the population.
The same sets of measurements were used for the data from 2002 and 2007.
(1) Socio-demographic information included the variables sex, age, marital status, geographical residence, education and income. Based on results of previous analysis of the data the variables sex, age and education were used in the analysis.
(2) Information-seeking clusters. Respondents purposive information seeking was examined by asking: 'Have you sought information about health and life-style in any of the following sources'? A list of over twenty information sources was presented and people asked to provide answers about every source. A five-point response scale was used (Very often - Never), 1 is the lowest activity level and 5 is the highest.
(3) Evaluation of information was examined by asking two questions: 'How useful do you find information about health and life-style in the following sources'?, and 'How reliable do you find information about health and life-style in the following sources'? The questions had a five-point response scale (5: Very useful/reliable - 1: Don't know).The same list of information sources was presented at both questions as at the question about purposive information seeking.
Factor analysis was used to extract latent factors on the questions about evaluation of information in the data from 2002 and 2007. It was expected that some of the items on the list of information sources presented were measuring the same factor or different aspects of the same factor, and that a scale could be used to measure each factor. The Principal Component Factoring method of extraction was employed to examine the factor structure of each question. In all cases, the criteria for factor loadings were set above 0.4, and oblique rotation (Oblimin) was adopted in all the analyses. For all the analyses, multiple criteria, based on eigenvalue > 1.00, a scree test and conceptual interpretability of the factor structure, suggested that extracting three factors would be adequate. The factors were named: media, health specialists and Internet. For the question about usefulness of information the factors explained 66.5% of the total variance in the data from 2002 and 67.3% in the data from 2007. The scales were checked for internal reliability. Cronbach's alpha ranged from 0.84 to 0.91 for the scales in 2002 and from 0.83 to 0.92 for the scales in 2007. Internal reliability, which reflects the precision of the measure (Cronbach 1951), of 0.70 is considered adequate (Nunnally 1978). For the question about reliability of information the factors explained 67.2% of the total variance in the data from 2002 and 70.3% in the data from 2007. Cronbach's alpha ranged from 0.86 to 0.90 for the scales in 2002 and from 0.85 to 0.92 for the scales in 2007.
Cluster analysis was used to determine how the participants formed distinct groups, based on their purposive information seeking in all the sources on the list presented by the question. This method was chosen because it can provide a perspective on the data different from traditional analysis of sociodemographic variables (Everitt, et al. 2001).
In 2002 the cluster analysis was performed in two steps. The first step involved an agglomerative hierarchical clustering method, the Ward's method, which is a Euclidian distance method (Everitt et al. 2001) and has been shown to outperform most other methods in identifying the number of clusters (Aldenderfer and Blashfield 1984). This method was used to produce a dendrogram illustrating a cluster fusion in order to identify the possible number of existing clusters. The next step in the analysis involved k-means clustering method, based on Euclidian distances. The k-means method has the advantage of not requiring individuals to be irrevocably allocated to a cluster. To improve the statistical fit of the solution, individuals are reassigned iteratively to clusters until each person is closer to the mean of their cluster than to any other cluster mean (Everitt et al. 2001). The k-means method is therefore likely to create more homogeneous clusters than, for example, hierarchical clustering methods. The k-means method requires the number of clusters to be specified beforehand. Ward's method indicated that three to four clusters might exist and in order to follow the recommendation to use the highest number of clusters, a four-cluster solution was drawn by the k-means method using the Iterate and Classify option within SPSS, version 11 (Everitt et al. 2001). Based on theoretical reasons which were built on analysis of the data in 2002, a four-cluster solution was also drawn in 2007 by the same k-means method (Aldenderfer and Blashfield 1984; Everitt et al. 2001; Pálsdóttir 2005 2008 2010).
The analysis of the clusters evaluations of the usefulness and the reliability of information was performed with ANOVA (one-way) and a post-hoc test (Tukey) conducted to examine significant differences across the clusters.
For each cluster, 95% confidence intervals were computed for the means of the scales media, health specialists and Internet to examine if differences in the clusters' judgements of the usefulness and reliability of them were statistically significant. If the confidence limits of the scales do not overlap it can be said with 95% safety that, within each cluster, a statistically significant difference exists across the means of the scales. If the confidence limits, on the other hand, overlap, the difference between the means is not statistically significant.
Four clusters were drawn based on participants' health and life-style purposive information seeking. The clusters, which were named with reference to their purposive information seeking activity as it was in 2002, differed in size. The passive cluster was largest with 192 members in 2002 and 148 in 2007. The moderately active cluster was the second largest with 112 members in 2002 and 105 in 2007. The other two clusters, the active cluster with 77 members in 2002 and 84 in 2007 and moderately passive with 90 members in 2002 and 52 in 2007, were smaller
The socio-demographic characteristics of the clusters were examined and it was found that there was a difference by sex across the clusters, with women being in a majority in all clusters both in 2002 (χ2(3)=23.78, p=0.001) and in 2007 (χ2(3)=38.74, p=0.001), except for the passive cluster, where there are more men. The age division of the clusters in 2002 (χ2(12)=48.76, p=0.001) and 2007 (χ2(12)=40.29, p=0.001) shows that the active and moderately passive clusters have a higher rate of young participants than the moderately active and the passive clusters, which have a fairly even age distribution and a higher rate of members from the older age groups than the other two clusters. The results for educational difference across the clusters in 2002 (χ2(6)=240.07, p=0.001) and 2007 (χ2(6)=18.40, p=0.010) show that the moderately passive cluster is the most educated one, with the highest rate of members with university education and the lowest with primary school education. The active cluster has the next most education. The passive cluster members have the lowest educational level, with the lowest percentage of members having a university degree. (See also Pálsdóttir 2010).
ANOVA was used to examine differences in judgements about the usefulness of information across the clusters. The results show a significant difference across the clusters for the media in 2002 (F(3,298)=8.4, p<0.001) and 2007 (F(3,370)=24.62, p<0.001), for health specialists in 2002 (F(3,233)=35.8, p<0.05) and 2007 (F(3,353)=27.71, p<0.001) and for the Internet in 2002 (F(3,117)=3.45, p<0.05). The clusters, however, did not differ significantly in their evaluation of information on the Internet in 2007 (p=.116). The results are presented in mean figures where, 1 is lowest and 5 is highest (Table 3).
| Topics | Passive | Moderately passive | Moderately active | Active |
|---|---|---|---|---|
| 2002 2007 | 2002 2007 | 2002 2007 | 2002 2007 | |
| media | 2.54ab 2.47a | 2.31a 2.39a | 2.79b 2.76b | 2.61b 2.82b |
| Health specialists | 2.99a 2.99a | 3.34b 3.39b | 3.22ab 3.16ab | 3.23ab 3.14ab |
| Internet | 2.01a 2.27a | 2.13ab 2.35a | 2.22ab 2.38a | 2.52b 2.62a |
A cluster mean is significantly different from another mean (Tukey, p<0.05) if they have different superscripts. A cluster mean with two superscripts is not statistically different from the means of two of the other clusters.
Table 3 shows that in 2002 the active and moderately active clusters found information in the media more useful than the moderately passive cluster. The passive cluster did not differ significantly from the other clusters (Tukey, p<0.05). In 2007 the active and moderately active clusters found information in the media more useful than both the moderately passive and the passive clusters (Tukey, p<0.05). Results about health specialists show that in both 2002 and 2007 the moderately passive cluster considered the information as more useful than the passive cluster. The other two clusters did not differ from neither the passive nor the moderately passive cluster (Tukey, p<0.05). In 2002 the passive cluster found information on the Internet least useful and the active cluster most useful. The other two clusters did not differ from neither the passive nor the active cluster (Tukey, p<0.05). In 2007, however, there was no significant difference across the clusters for their evaluation of the usefulness of information on the Internet (Tukey, p<0.05).
For each cluster, the confidence intervals (95%) were computed for the means of the information channels, to examine if the differences in the clusters evaluation of the usefulness of the information in the channels were significant. Results about the confidence intervals in 2002 are presented in Figure 1 and results from 2007 in Figure 2. The vertical lines in the pictures indicate the position of the upper and lower confidence limits for the media, Health specialists and the Internet, for each cluster. Furthermore, the median for the confidence limits is presented for each information channel.
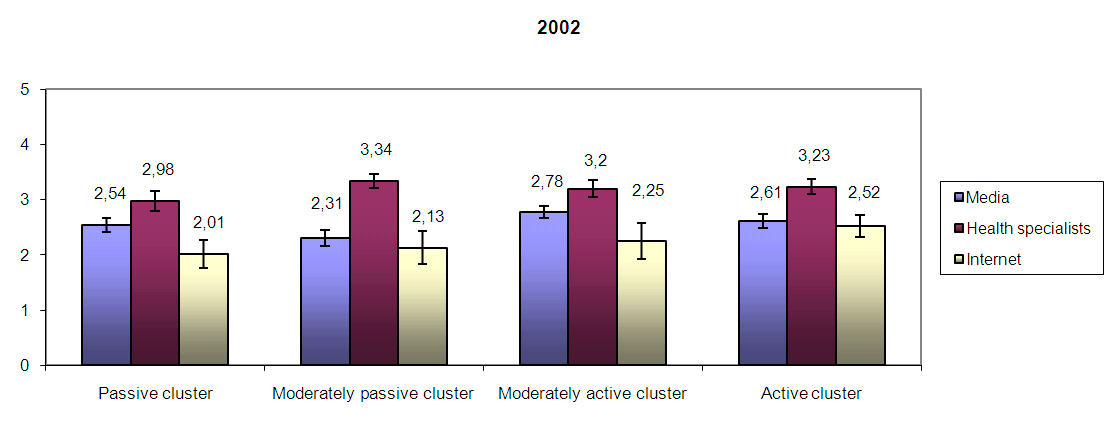
All the clusters found information from health specialists to be significantly more useful than information in the media and on the Internet in 2002. Information on the Internet was considered significantly less useful than information in the media by the passive and the moderately active clusters. As the confidence limits for evaluations of the media and the Internet overlapped for the moderately passive and active clusters, there were no significant differences in the evaluation (Figure 1).
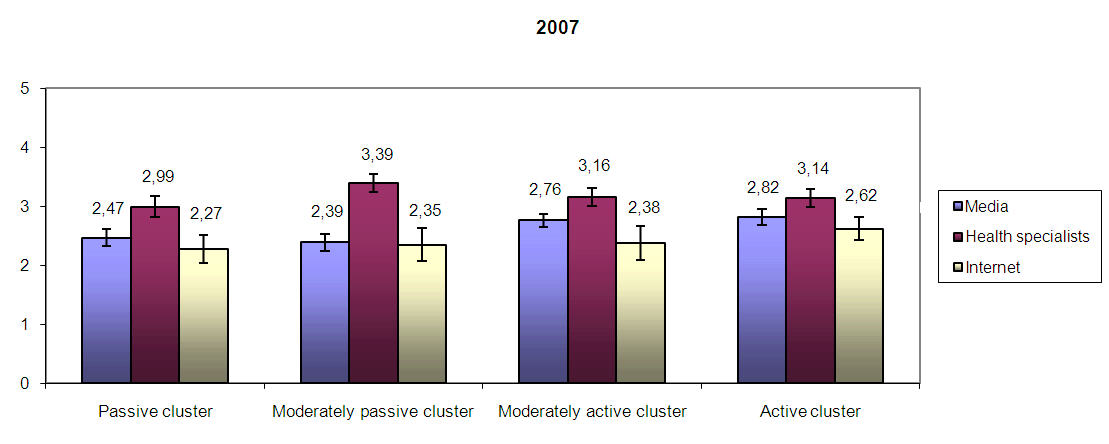
In 2007, information from health specialists was considered to be significantly more useful than information in the media and on the Internet, by all clusters, as in 2002. However, in 2007, the confidence limits for evaluations of the media and the Internet overlapped for all four clusters and therefore no significant difference were found in the evaluation (Figure 2).
ANOVA revealed a significant difference across the clusters for the media in 2002 (F(3,237)=10.5, p<0.001) and 2007 (F(3,279)=16.4, p<0.001), for health specialists in 2002 (F(3,337)=4.99, p<0.01) and 2007 (F(3,267)=13.85, p<0.001), and for the Internet in 2002 (F(3,128)=4.6, p<0.05) and 2007 (F(3,155)=6.93, p<0.001) (see Table 4).
| Topics | Passive | Moderately passive | Moderately active | Active |
| 2002 2007 | 2002 2007 | 2002 2007 | 2002 2007 | |
| media | 2.36a 2.20a | 2.20a 2.24a | 2.68b 2.65b | 2.60b 2.66b |
| health specialists | 2.99a 2.99a | 3.34b 3.39b | 3.22ab 3.16ab | 3.23ab 3.14ab |
| Internet | 3.19a 2.95a | 3.49b 3.55b | 3.36ab 3.41b | 3.35ab 3.35b |
A cluster mean is significantly different from another mean (Tukey, p<0.05) if they have different superscripts. A cluster mean with two superscripts is not statistically different from the means of two of the other clusters.
The active and moderately active clusters found information in the media more reliable than the moderately passive and passive clusters in both 2002 and 2007 (Tukey, p<0.05). Results about health specialists show that in 2002 the passive cluster considered the information as less reliable than the moderately passive cluster. The other two clusters did not differ significantly from the passive and moderately passive clusters in 2002. In 2007 the passive cluster found information by health specialists as less reliable than all the other clusters (Tukey, p<0.05). In 2002, the passive and moderately passive clusters found information on the Internet less reliable than the active cluster but the moderately active cluster did not differ significantly from the other three clusters. In 2007 the passive cluster still found information on the Internet as less reliable than the active cluster but neither moderately passive nor moderately active clusters differed significantly from the other two clusters (Tukey, p<0.05). (Table 4)
For each cluster, the confidence intervals (95%) were computed for the means of the channels, to examine if the differences in the clusters judgements of the reliability of the information of the channels were significant. Results about the confidence intervals in 2002 are presented in Figure 3 and results from 2007 in Figure 4. The vertical lines in the pictures indicate the position of the upper and lower confidence limits for the media, health specialists and the Internet, for each cluster. Furthermore, the median for the confidence limits is presented for each information channel.
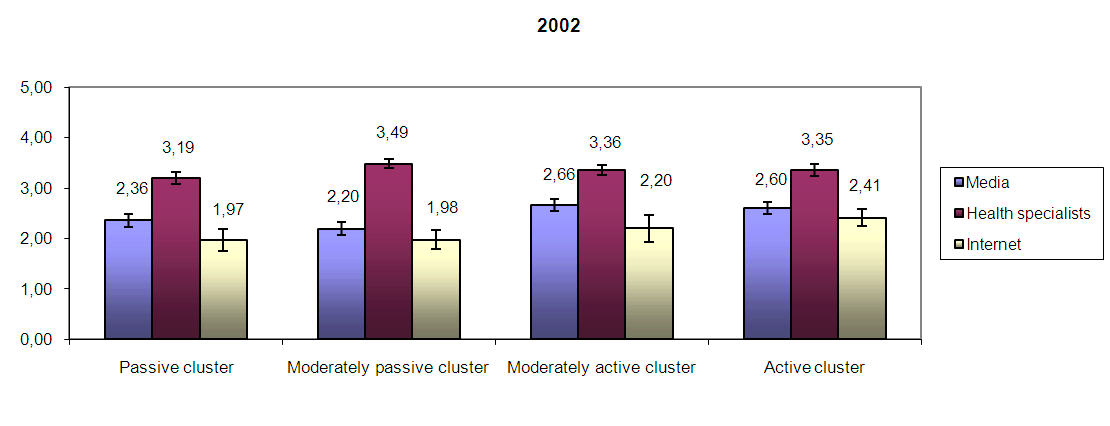
Figure 3 shows that in 2002 all clusters considered information by health specialists to be significantly more reliable than information in the media and on the Internet. The passive and the moderately active clusters found information on the Internet to be significantly less reliable than information in the media. For the moderately passive and the active clusters, the confidence limits for evaluations of the media and the Internet overlapped and therefore no significant difference was found.
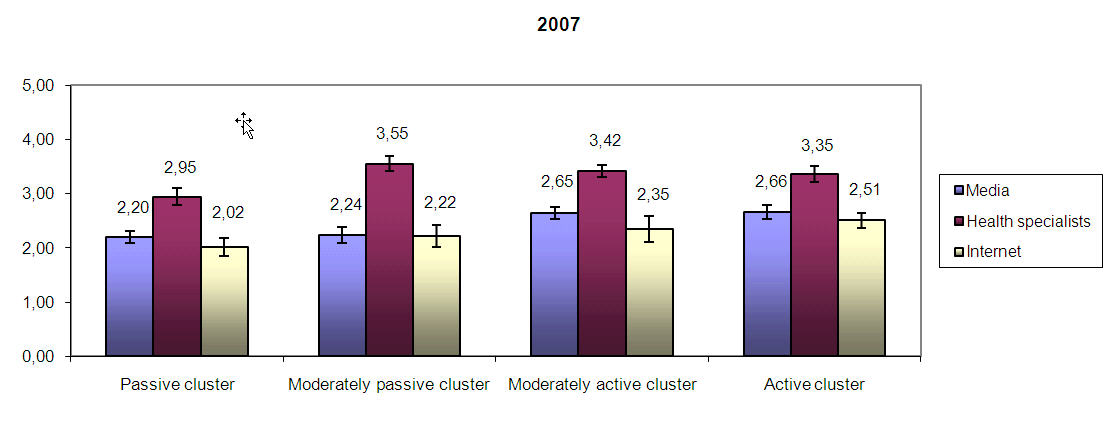
All clusters considered information from health specialists to be significantly more reliable than information in the media and on the Internet in 2007, as in 2002. The confidence limits for evaluations of the media and the Internet overlapped for all four clusters and therefore no significant difference was found.
Knowledge about how the general public evaluates health information in diverse information sources and channels and how the evaluation has developed in line with changes in the information environment has been scarce. The present study attempts to shed some light on the subject by examining how four clusters of people evaluated the usefulness and reliability of health and life-style information, within a broad network of sources in four information channels. It, furthermore, explored whether or not there has been a statistically significant change in the evaluation from 2002 to 2007.
The results from the study show that the passive cluster evaluates the usefulness and reliability of information, in general, lower than the other three clusters (Tables 3 and 5). The passive cluster has, furthermore, been found to seek information least often in all information channels (Pálsdóttir 2010). Although a statistical examination of the relationship between information seeking activities and the participants' evaluation of information has not been performed, the findings nevertheless show some signs that there might be a connection between these two factors. It might therefore be worthwhile to look into this matter in the future.
An examination of each cluster's judgements of how useful and reliable information in the media, health specialists and the Internet were in 2007, compared to 2002, found that in both 2002 and 2007, all the clusters considered information by health specialists to be more useful and more reliable than information in the other two channels. Results about the moderately passive and the active clusters in 2002 show that the means for the media were a bit higher than for the Internet, both for the evaluation of the usefulness and the reliability of information, but the difference was small and not statistically significant. There was, on the other hand, a bigger difference across the media and the Internet by the passive and moderately active clusters, who considered information on the Internet as neither as useful nor as reliable as information in the media. In 2007, however, this had changed and for none of the clusters a significant difference was found across the media and the Internet. Even thought the moderately active cluster still rated the usefulness and reliability of information on the Internet (2.38/2.35) lower than in the media (2.76/2.65) the difference across these two information channels was not statistically significant. The results confirm prior findings that information on the Internet is deemed less reliable than information provided by health centres (Marshall and Williams 2006). The findings are also somewhat similar to the results of two studies, conducted in seven European countries in 2005 and 2007, which examined how important people thought that health information on the Internet were compared to more traditional sources. The results indicate that the perceived importance of online health information is growing, particularly in countries that had high Internet usage (Kummervold et al. 2008).
Among the factors that may have an impact on how people perceive the Internet is how easily they can access it as how experienced they are at seeking online information (Ratchford et al. 2001). The prevalence of Icelanders with Internet access has increased steadily in the past years. In 2002, a total of 73% Icelanders had access to the Internet from their homes (Nordic Council of Ministers 2002), in 2007 the figure had gone up to 84%; of those 89% had high-speed access, (Statistics Iceland 2007). Previous examinations of the data from the current study has found the passive and moderately active clusters to seek information on the Internet less often than the other two clusters in 2002 and in 2007. However, the means of the passive and moderately active clusters for information seeking on the Internet in 2007 are a bit higher than the means for 2002 (Pálsdóttir 2010).
Thus, it is possible that better options of reaching online information, together with more experience at information seeking and thereby getting more acquaintance with health and life-style information on the Internet, has to some extent had an effect on the evaluation of the information. Another reason for the lack of difference between the media and the Internet in 2007 could be the blurring of the boundaries between publications in print and in digitalised form. Although an investigation comparing the availability of health information in Icelandic in the period 2002 and 2007 has not been made, it nevertheless can be presumed that the amount of online information has increased since 2002. Information that used to appear only in print was often also available in digitalised form in 2007, e.g., newspapers or magazines offering Websites. Furthermore, the amount of information on the Website of the Public Health Institute of Iceland has grown steadily in the period 2002 to 2007, with brochures, articles and news about research findings, published by the institute appearing on the Website.
The study is limited by the response rate which was 51% in 2002 and 47% in 2007. This can be considered satisfactory in a postal survey but nevertheless raises a question about the validity of the findings. On the other hand, the studies' findings are strengthened by the fact that the samples of respondents were compared to population parameters and found to reflect the population fairly well.
The Internet was still a relatively new medium in 2002, compared to the more traditional information channels, such as the media and health specialists. Bearing in mind that it takes time for people to adapt to new technology it may be considered natural that some groups in society were not ready to appreciate the information that could be found there in the same way as information in the more established information channels. The results of the study indicate that the importance of the Internet is growing and that may be well on its way to establish itself as equivalent to the more traditional information channels.
The study was funded by the University of Iceland Research Fund. The author wishes to acknowledge the contribution of The Social Science Research Institute, University of Iceland, for assistance and statistical advice during data collection and analysis.
Ágústa Pálsdóttir is a Professor in the Department of Library and Information Science, University of Iceland. She received her Bachelor's degree in Library and Information Science and Master of Library and Information Science from University of Iceland and PhD in Information studies from the Department of Information Studies, Åbo Akademi University, Finland.
| Find other papers on this subject | ||
© the author, 2011. Last updated: 6 March, 2011 |
|
