vol. 15 no. 4, December, 2010
vol. 15 no. 4, December, 2010 | ||||
Uganda has multiple organizations that gather and collect spatial data as part of their daily activities. Such activities include environmental protection, transportation, natural resources, demographic statistical collection, social services and defence. Accounts of the use of spatial data in these domains are numerous, so collecting and maintaining spatial data systematically at a national level is crucial for the development of a country. Understanding how, what and where to collect and maintain, and most of all, who should do that, is however just as important. This is an public information management question, because any choice in addressing these questions needs to be justified at by public development relevance.
Although many of the spatial data requirements are similar, the different responsible organizations in Uganda each collect theirown data, resulting in a situation where the same types of data are often maintained with different standards and at different locations. This is leading to redundancy. For Uganda, Karatunga (2006) estimates that this redundancy could be contributed to a variety of problems in the public administration system, including: poor knowledge of data availability, overlapping of data production activities, lack of best practice in the use of technology, difficulties in assessing data quality, overlapping of mandates, lack of national policy on spatial data access and use that government, private organizations and user have to follow to purchase, share, and exchange and deliver the same spatial services.
Most of these findings resonate in the more technically oriented international discourses on data infrastructures in general (Cordeiro and Al-Hawamdeh 2001). In the particular discourse on spatial data infrastructures (spatial datainfrastructures) the report of the US General Accounting Office (2004) noted that 'federal and state agencies have all stated that unnecessarily redundant geospatial data and systems exist throughout the federal government', and that single portal (referred to as Geospatial One-Stop) is one of the initiatives to support reducing redundancies in federal geospatial assets. In Europe there are similar policies. The European Parliament (2007) prescribes in the INSPIREDirective that 'The infrastructures for spatial information in the Member States should be designed to ensure that it is possible for spatial data collected at one level of public authority to be shared between other public authorities' and that 'In cases where multiple identical copies of the same spatial data set are held by or on behalf of various public authorities, the Directive shall apply only to the reference version from which the various copies are derived'. This latter article assumes that all copied, hence redundant, data, are not covered by the international Directive.
Technically, reduction of redundancies in spatial data collections is considered possible. Korte (1997;2001) provide technical methods of how redundancy and other problems multiple maps sets can be eliminated. Lamb and Hough (2003) deem that geographic information system efforts could facilitate the elimination of duplication and unnecessary redundancy in data collections and systems. Maguire and Longley (2005) offer solutions in the form of catalog geoportals to facilitate geo-information sharing and to avoid duplication. Chan et al. (2001:3) discuss that 'by reducing duplication, facilitating integration and developing new and innovative applications, and respecting user needs, spatial data infrastructures [spatial data infrastructures] can produce significant human and resource savings and returns'. These technical solutions are further justified by the argument that that less redundancy in the national spatial data set as a national resource implies improved ability as a country to handle societal and (inter-) organizational problems, and to further development.
This latter argument, assuming a direct link between lower redundancies within national resources on the one hand and more development on the other hand, is however questionable. First, there is very little empirical evidence whether this assumption is true. Secondly, one could question if reduction of redundancy is even advisable, for any developing country, such as Uganda. A counter argument is namely that the presence of redundancy in national resources provides the public sector with a reserve, and that it is essential for managing organizational knowledge. A frequently quoted article of Landau 1969 argues that
redundancy serves many vital functions in the conduct of public administration. It provides safety factors, permits flexible responses to anomalous situations and provides a creative potential for those who are able to see it. (Landau 1969:356)
and
There are good grounds for suggesting that efforts to improve public administration by eliminating duplication and overlap would, if successful produce the opposite effect. That so many attempts have failed and this alone is sufficient warrant for transforming a guideline into a problem. (Landau 1969:349)
This insight implies that if the redundancy is reduced, it may develop into a problem of insufficient redundancy. Redundancy serves thus a purpose in development and in public information management. A number of recent publications, drawing on Landau's seminal work, identified three positive reasons for redundancy:
1) Public management systems improvement.
Ting (2003) argued that redundancy of systems functionality establishes conditions under which similar components can be added to improve a systems performance. If these components have independently distributed probabilities of performing a task successfully, then their combination will be more likely to achieve a success together than either acting alone. Two components that are each independently 50% reliable will as well be effective as the one that is 75% reliable. In addition, Miranda and Lerner (1995) confirm the assumption posed in the paper of Landau 1969 that the deliberate introduction of redundancy can improve the organizational performance of the public sector system as a whole.
2) Better functioning of public sector organizations.
Low et al. (2000) have argued that redundancy has organizational benefits if it improves the (efficiency) chances of some part of an organization succeeding in its tasks, and thus reduces the likelihood of failure. They pointed out that increasing the number of components can lead to unpredictable interactions between them hindering organizational effectiveness. For example, in a situation where an organization has three units with similar tasks, it helps the organizational ability to address the problems effectively and serve its customers efficiently without delays. That is, functions of different units in an organization should be shared within units in that organization so that in case of a problem in one unit the other serves the customers. In addition, Choo (2007) argues that the information function of organization is part of the social belief system of that organization. Much of this belief system is a shared, common view of what is necessary. As a result, this may be based on data which are stored more than once, even within one organization. Finally, Ellingsen and Monteiro (2006) argued that fragmentation of datasets may be unavoidable and partly desirable, and that redundancies play productive roles in sense-making activities embedded in ongoing work routines.
3) More development though better governance.
With a better public sector system and improved public sector organizations, public sector governance can be improved. Specific for developing countries is that public sector governance is constrained because of the lack of complex redundancy (Caiden and Wildavsky 1974). Low income countries are poor not because of lack of money but their poverty extends to information, knowledge, trained manpower and public institutions. A poor country finds it hard to increase its wealth rapidly because its population lacks skills, its information base is bad and its government lacks redundancy of reserves, surplus, alternatives, security, and exchange of data. Caiden and Wildavsky (1974) have given a comprehensive and in-depth analysis of what redundancy actually means for a public administration and pointed to differences in redundancy between less-developed countries and developed countries. A system is regarded has having positive redundancy if it contains two or more elements whose functions are the same and if the removal of any of the duplicate elements may endanger the survival of the system.
Given the above reasons why redundancy may have positive implications, one could question the current paradigm within the spatial data infrastructure discourse (namely that redundancy should be reduced, or whether it should always be reduced). Our core research question was therefore:
To what extent is spatial data redundancy crucial for the development of the public management system in Uganda?
This led to three main sub-Obobjectives of the study in Uganda:
The structure of the paper follows these sub objectives: first we provide an insight in the location of the study and the types of data to collect. Next, we provide the method how to determine the extent of spatial data redundancy in Uganda, and how to collect the reasons why redundancy exists, and possible effects which that generates. Based on these findings, we interpret to which the existing redundancy is crucial for the public management in Uganda. The last section concludes by a reflection on the findings and interpretation in light of the core research question.
We focused our analysis on spatial datasets in Kampala and Entebbe. Such data sets are in general 'compiled from aerial photographs, other remotely sensed images, historical records, legal documents, and direct field observations and surveys…' (USGS web document 2005), and typically include geodetic control, digital elevation models, ortho-imagery, international and administrative boundaries, topographic maps, and gazetteers of geographical names, framework data of cadastral boundaries, transportation, land use and land cover land cover, forests, soils, and hydrology (Kalande and Ondulo 2006; Nebert 2000).
For the case of spatial data users and providers in Uganda Karatunga (2002) makes a distinction between core institutions, supporting institutions and other institutions. Core organizations involve sectors which fall in the five governments' priority programme areas: education, health, water and sanitation, roads and transport and communication and agriculture infrastructure. These sectors have recently started using spatial data to support planning, management, monitoring and evaluation. Supporting organizations involve the ministry of Finance, Planning and Economic development (MFPED), Lands and Surveys Department (LSD), Ministry of Local Government (MOLG), Karamoja Data Centre (KDC), National Forestry Authority (NFA) and Uganda Bureau of Statistics (UBOS). These organizations are members of the National Geographic Information Systems (GIS) task force that was established in 2000 by the Ministry of Finance, Planning and Economic Development. Other organizations include that do not have a direct impact on the operations within the main focus groups, yet are relevant because they are geographical information systems users, and deliver occasionally specific spatial data to central policy makers. Examples of this latter category are the National Environmental Management Authority (NEMA), and the Makerere University. Finally, there are a number of international projects that aim for spatial data collections. Examples include the World Bank and Global Environment Facility funded project on rural electrification in Uganda, where spatial data is used in the planning process of rural electrification (Kaijuka 2007), or the mapping of poverty, funded by World Bank, Rockefeller Foundation and UK Department for International Development (DFID) and managed by UBOS, where spatial data are used to map poverty statistics (Rogers et al. 2006).
The data collection consisted of four phases:
1. Orientation phase. A local workshop on the design of sustainable spatial data infrastructures helped to identify key stakeholders of each category of stakeholders and to make appointments for a first round of interviews. These interviews helped to identify the primary spatial data sets in the country, and generated a comprehensive list of sixty organizations.
2. Survey phase. All sixty identified organizations received a structured questionnaire. Fifty-one were returned; a response rate of 85%. This resulted in a list of five key organizations and a list of most redundant data sets.
3. Detailed interviews. These were held with the five key organizations and related to one the most redundant data sets, produced in five institutions.
4. Focus group discussion. This discussion aimed at getting opinions of all relevant parties about spatial data redundancy.
A few remarks can be made for the rationale behind the latter three phases:
Survey phase.
Although we considered using separate questionnaires for the different categories of users and producers as specified by Karatunga (2002), during the orientation phase it became clear that the majority of the organizations were often spatial data producers and users at the same time. So, the theoretical distinction between the types of organizations was not (or no longer) evident. Instead, we decided to use a hybrid questionnaire containing both open and closed type of questions. The questions were designed to target professional respondents, familiar with spatial data collection, production and use. Obviously, we could not include all possible producers, collectors and users of spatial data in Uganda. However, we ended up with a list of sixty different organizations. This seemed a reasonable representation of given the variety of sectors that they represented (government, academic institutions, local government, non-governmental organizations and UN agencies). We included all the members of the National Geographic Information Systems Task force and organizations.
Table 1 shows an overview of the number of questionnaires sent and responses received during this phase. We clustered the type of organizations according to the sectors central government, UN agencies and non-governmental organizations, and private organizations, because these provided similar clusters of answers.
| Sector | Number of questionnaire sent | Response received | Sector wise % response | % of total response |
|---|---|---|---|---|
| Central Government organizations | 32 | 29 | 91 | 57 |
| UN Agencies and Non-governmental organizations | 10 | 8 | 80 | 16 |
| Private | 18 | 14 | 78 | 27 |
| Total | 60 | 51 | 85 | 100 |
Detailed interviews phase.
The interviews followed the guidelines as described by Groenendijk and Dopheide (2003) and Kumar (1996). We used semi-structured and open questions. Five interviews were carried out, which lasted between 45 minutes and one hour. The officials who were to be interviewed were given questionnaires in advance to have an idea of what the interview would be like. This was mainly to have an early preparation and focus for the interviewee. Specific issues discussed during the interview were the extent of geo-information redundancy in Uganda, the perceived causes and impacts of this redundancy, the extent of awareness about internal and external policies that might relate to redundancy and the role of data custodians.
During the survey phase, it became clear that the administrative boundaries was the most frequently copied and most dispersed and maintained data set among all organizations. Moreover, the survey discovered that five different organizations produce the dataset, namely the Food and Agriculture Organization, the European Commission, the Uganda Bureau of Statistics, Ministry of Local Government and the Lands and Surveys Department. We decided therefore to focus further detailed interviews on this specific dataset and these specific five organizations. This resulted in a first set of conclusions on the research objectives. We used this set in the final phase of the research, during the focus group discussions.
Focus group discussion.
Despite the fact that the date of the scheduled focus group workshop coincided with abrupt floods which affected one part of the country, we were able to hold a five hour discussion on the areas of interest. The Workshop was organized on the 18th October 2007 and representatives from six organizations attended the discussion, which was based on the following issues:
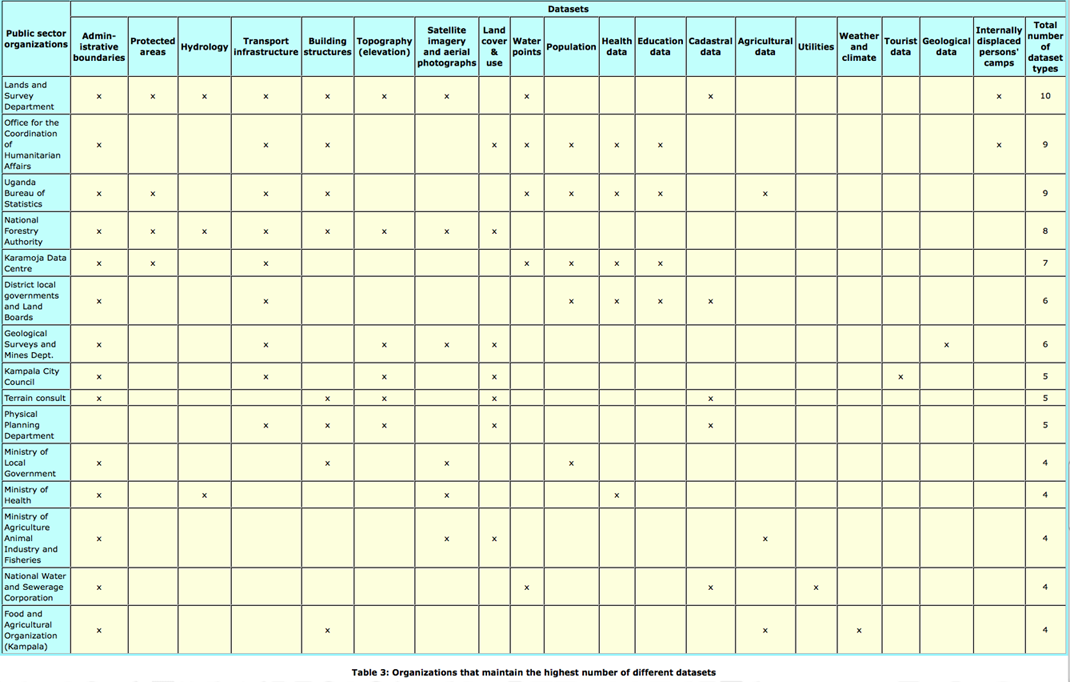
The survey and interviews confirmed that Uganda has many organizations that produce and use spatial data. Table 2 shows an overview of the datasets which are most frequently duplicated and Table 3 shows which organizations maintain the highest number of spatial dataset types. These tables show that the most commonly produced datasets among the geographical information community are the administrative boundaries. Among the fifty-five organizations surveyed at least twenty-three maintained a dataset of administrative boundaries. Furthermore, the Lands and Survey Department is the organization that maintains the highest number of different types of spatial data (10 types). Most organizations in Uganda compile spatial data from existing topographic maps, aerial photographs, remotely sensed images, historical records, legal documents and direct field observations and surveys. They usually comply hereby with national standards of content, geometric accuracy and presentation as set by the Lands and Survey Department.
| Dataset | Number of organizations keeping or maintaining these data |
|---|---|
| Administrative boundaries | 23 |
| Land cover and land use | 16 |
| Cadastral data | 13 |
| Transport infrastructure | 13 |
| Topography | 11 |
| Building structures | 10 |
| Water points | 9 |
| Satellite images & aerial photographs | 8 |
| Hydrology | 7 |
| Protected areas | 6 |
| Population | 6 |
| Health data | 6 |
| Education data | 5 |
| Agricultural data | 4 |
| Weather and climate | 4 |
| Utilities | 3 |
| Tourist data | 2 |
| Geological data | 2 |
Given the frequent duplication the administrative boundaries are however a special case where redundancies occur. A closer look at these data shows that they divide the national territory into units of administration: local, regional and national. The spatial features of these units include the international, regional, district, county, sub-county, parish and village boundaries. The form of these datasets vary from a scale of 1:1000000 for international boundaries 1:100000 for national ones 1: 2500 for regions and districts 1: 2500 for sub-counties 1: 10000 for urban areas, 1:25000 and 1:50000 for rural areas.
According to Ministry of Local Government, Uganda has the administrative units (regional, districts, counties, sub counties, parishes and villages) which result from the administrative boundaries; 1 city, 96 districts, 5 city divisions 13 municipalities, 37 municipal divisions 169 counties, 958 sub counties, 83 town councils, 5,225 parishes and 44,402 villages (Ministry of Local Government 2006)
With administrative boundaries being the most redundant spatial data set, we continued our analysis on why so many public organizations are maintaining this data set for their own purpose. After having compared how the data of administrative boundaries were obtained, maintained and distributed, we found that in most cases the original data had the same content, but that the individual organizations changed the content, the attributes and the format to suit their own needs. This in itself is not so problematic, yet, upon distributing these adapted data to third parties, redundancies start to emerge. Third parties then start to experience problems from differences in number of administrative units, differences in names of administrative areas and location specific artefacts, differences in location references of similar boundaries, differences in scale and versions, and differences in completeness and actuality.
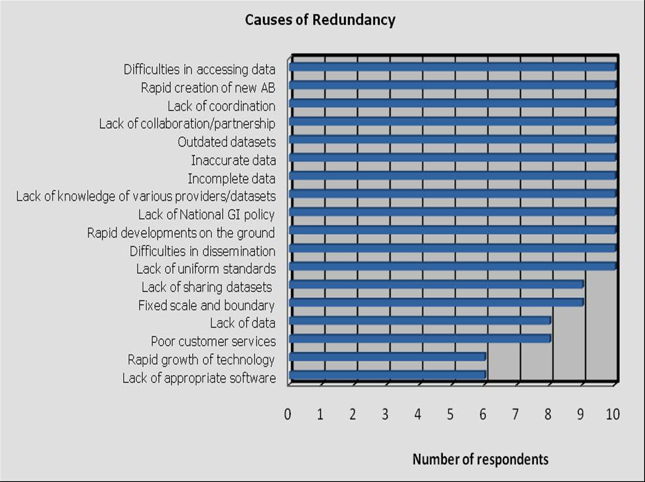
In the evaluation of the causes for redundancy, respondents came up with various reasons why they were duplicating certain data sets. Figure 1 lists the most frequent reasons which respondents specified during open interviews. Although the list only provides the most frequently mentioned reasons, one can roughly see a pattern of more technical reasons on the one hand (inaccurate data, incomplete data, lack of uniform standards, etc.), and more institutional reasons on the other hand (difficulties in access, lack of collaboration, lack of national sharing policy). Respondents perceived that the technical and institutional constraints co-evolved alongside each other, and that these could not be decoupled. Data access, for example, is a constraint of having the technical facilities, but simultaneously also of having the appropriate authority. If either of the two is missing, accessing data from other organizations automatically becomes impossible. As a result, one is forced to duplicate the data, as a means to reduce the dependency on access possibilities.
A second observation was that three developments occur with the handling of the administrative data sets. Firstly, at the start of projects, users typically retrieve the administrative data the origin from the Lands and Survey Department. Upon receipt, each recipient organization adapts these data and, through this adaption, produces a new version of this data set. This in itself is not necessarily problematic, but these new versions seep through to the third party clients of each of these agencies, which in turn distribute them to other dependent organizations. The emerging redundancy is thus path dependent.
A third observation was that a significant number of respondents indicated that spatial data redundancy started to occur after geographical information systems had been introduced to their respective organizations. Before the rapid growth of spatial information technology in the 1990s, it was simply too expensive for individual organizations to acquire any mapping equipment or related software. During the 1990s, mapping software, geographical information systems packages, and online mapping programs facilitated spatial data use and spatial data exchange. Without significant financial investments and facilities organizations began to experiment with spatial data technologies, and as a result implicitly generated redundancy in spatial data.
Significant was the opinion among many respondents that this redundancy presented an opportunity for organizations to compare datasets, to ease availability of data, and to improve accuracy of data. This led organizations to ignore negative side effects of redundancies and continue in the experimental paths which they had started. As a result, redundancy increased as well.
The group discussion and interviews revealed that redundancy has both negative and positive effects. The result of gradual adaption of original data and further distribution of these data sets is high fragmentation of data at lower levels. Rather than a coherent set of consistent interdependent data (as described by (Williamson et al., 2003), what emerges is a set of disparate, fragmented data, which are supposed to have the same content, yet are in practice different. Such as development are similar to what de Man (2007) called fragmentation of data infrastructures and what de Vries (2006) described as localization of data infrastructures. This is a negative effect, because the redundancies in data with similar content may reflect a mismatch of the data content with reality. A second effect is that different versions in time emerge, because of the different speeds at which the datasets are passed on in the fragmented datasets. Meta-data on versioning might solve this problem (following Nebert (2004)), but this only helps if one could compare one version to other versions. In practice the actuality of the version is not clear. A third effect relates to the different discretions by which each organization creates its own data sets on administrative boundaries. The thirds party recipients of these data sets are often unaware of the underlying rationale behind these discretions.
A more positive effect in the eyes of the respondents related to improved quality. Respondents working at the operational level in all addressed organizations elaborated about an increase in quality and availability as a result of redundancy. This seems contradictory. The products produced using different administrative boundaries by each organization are of varying product accuracy. The smaller the scale (the European Commission is maintaining administrative boundaries at a of scale 1:280,000) the lower the accuracy and fewer feature representation on the map. With a big scale (the Uganda Bureau of Statistics is using a scale of 1:10,000 for similar boundaries) the accuracy is high and more features are represented on the map. Yet responses pointed out that this type of redundancy leads to a kind of competition which could potentially increase the quality of the output.
The Uganda Electricity Transmission Company Limited stated, for example that redundancy improves availability, quality, and accuracy and has led to cheap and affordable datasets. The argument hereby was that if more than one organization engages in data collection, there is a potential for more frequent updates and higher availability throughout the year. It was mentioned by one respondent that redundancy offers better products and higher frequency of updates, because each of the producers wants to offer users the best of all the products, and associate with quality. Meanwhile, users appreciate the presence of multiple producers of the same dataset, so that they can update data their own data at different times of the year. In addition, two respondents stated that redundancy also creates competition and forces an organization to overcome inaccuracies. This led during the focus groups to an overall opinion that collectively, the available data are of relevant quality and are more up to date than individual data sets.
A second positive effect was that redundancy was perceived as a mechanism to improve data access. One official stated that accessibility of data had improved because there are a lot of organizations producing administrative boundaries dataset these days. He stated that in earlier days it was difficult to access datasets because it was only produced and monopolised by one organization, the Lands and Survey Department. Now the administrative boundaries can be accessed any time you need it. In such as case, redundancy functions as a back-up mechanism. Respondents even pointed out that the surplus of access provided by redundancy is a blessing to the public sector, because previously public sector data were lost frequently.
A third positive effect was that redundancy provides an increasing ability to compare data quality. Responses from at least six organizations indicated that redundancy presents opportunity for organizations to compare datasets, ease availability and improves accuracy. Here, organizations are able to compare own datasets with those of other organizations for accuracy checks. For example, respondents from the infrastructure companies stated that before using the administrative boundaries datasets retrieved from the Land and Survey Department and the electoral commission they normally check and compare the quality of each of these datasets. Compared to earlier times where there was monopoly of one organization producing, there did not exist an opportunity to check the quality, because there was only one source.
Finally, one of the effects noted during the interviews was that redundancy might help in conflict resolution. This seems as unlikely as the perception that redundancy would increase data accuracy. However, one official cited a district boundary conflict between Moyo and Yumbe district caused by varying mappings from different organizations. In addition, an Lands and Survey Department official stated that there are a lot of boundary conflicts in the country caused by different producers. He cited the conflict between Pader and Kitgum districts in 2001, where an official from the Karamoja Data Centre nearly lost his life in when he used an administrative map for his fieldwork which was depicting a 'wrong' boundary. However, inaccurate data, once it is printed, has the powerful effect for residents to verify and correct data. Residents may derive alternative maps showing a wrong boundary. These boundary conflicts are push mapping organizations to help better understand local perceptions of boundaries, and be more critical of established boundaries.
From the evidence on the extent and the causes of redundancy of spatial data, the primary drivers for redundancy seem to originate from fragmented work processes in the public sector in Uganda, differences in timing of certain spatial data collection projects and uncertainties about which public organization is responsible for which dataset. These are however crucial issues in public management in general, and public information management in particular. One of the crucial negative effects of redundancy, therefore, is clearly in the inter-organizational efficiency within the public sector. It is unknown for most parties when information is available, and once it is available, the quality may be disputed and additional processes may be necessary to address the quality issue. Such work processes are thus counter-productive for the public sector.
Contrastingly, the existing redundancy is perceived as a necessary condition by most organizations, as long as the redundancy serves a particular governance or development purpose. The presence of duplicate data is especially relevant in a context where resources are scarce and dispersed. In other words, it is better to have the data double, then to have no data at all. The fact that redundancy is increasing with the increase of geographical information systems adoption among Ugandan organizations is not contradicting this, because their adoption does not imply having additional resources, it merely implies becoming more dependent on spatial data. This dependency leads to closer relations with other spatial data providers and users (Berisso and de Vries 2010). Especially in the early stages of geographical information systems adoption it is likely that redundancy increases rapidly, however with the side effect that the need to coordinate the public sector integration is also emerging among the spatial data stakeholders.
Overall, therefore, there is a duality in the arguments favouring or rejecting the redundant status quo. The same redundancy is perceived as negative and positive at the same time. Perhaps there is a need, therefore, to differentiate between substantive redundancy and strategic redundancy, similar as the difference of substantive and strategic uncertainty made by Koppenjan and Klijn (2004). Whereas the first type follows from the substance of the data, the second follows from the (strategic) reasons why certain organizations may opt for redundant data and subsequent redundant capture processes. When looking at the substance of redundancy it must be noted that administrative boundaries cannot all be considered as one single product. On a number of occasions, the administrative data are simply different in terms of content and outlook. In these cases what appears to be redundancy is not always redundancy. This may explain why reduction of so-called redundant data capture through improved information sharing and standard data definitions; formats may not always be the most effective strategy in practice. Hence any proposal solution and policy towards reducing redundancy should start with an in-depth analysis of both the content of datasets concerned and the strategic reasons why redundant data and practices are kept in place.
Returning to the original question if and to which extent spatial data redundancy would be crucial for the development of the public management system in Uganda, we can conclude that as long as the technological resources and the human capacity in Uganda are still limited, the presence of redundancy of spatial data in the public sector is vital for the public management of Uganda as a whole. It allows the public sector to maintain a minimum store of data, necessary for public sector activities. A number of side effects are that redundancy may lead to independent quality checks, more exchange and comparison of data, and more freedom to choose data. Such processes do not need to be stopped. Instead, the policy measures could be directed towards redundant data capture activities where these above improvements are less apparent. These measures should enhance efficiency of government cooperation and integration.
The implication of these findings is that a shift in the thinking on data infrastructure policies in developing countries is necessary. Rather than advocating the redundancy decrease as a primary objective, we argue that a redundancy decrease only makes sense if the decrease can be directly related to increases in other development areas. Public sector information management should therefore not be decoupled from other issues in governance and development.
Further studies on redundancy may start with a further categorization of redundancy. If some redundancy is useful for governance and development, and other forms of redundancy are leading to inefficiencies, a categorization of public information redundancies will help information sciences further. The specification of the role of redundancy helps in linking the issue of redundancy to public information management. This notion is relevant for further understanding and teaching on the context of information.
Walter T. de Vries is lecturer and researcher at the Faculty of Geo-information Science and Earth Observation of the University Twente in the Netherlands. His PhD research deals with geoICT coordination in the public sector. His teaching, research and consulting experience relate to information infrastructures, electronic government, capacity building of cadastres and national mapping agencies, and public sector integration. Most of his working experience is in or for developing countries. He can be contacted at w.t.devries@utwente.nl.
Beatrice Winnie Nyemera is senior geo-information analyst at the Uganda Bureau of Statistics, Kampala, Uganda. She completed her Msc research on redundancy of spatial data in Uganda, and has been working on statistical health and poverty mapping in Uganda. She can be contacted at wnyemera@yahoo.co.uk.
| Find other papers on this subject | ||
© the authors, 2010. Last updated: 19 December, 2010 |
|
