Vol. 13 No. 2, June 2008
Vol. 13 No. 2, June 2008 | ||||
This paper reports the results of a study that aimed to explore research assessment within the field of music, especially music academics' citation counts and how they relate to departmental Research Assessment Exercise scores. This is the sixth in what has become a series of papers dealing with citation analysis and the UK Research Assessment Exercise: Oppenheim 1995, 1996 and 1997, Holmes & Oppenheim 2001, Norris & Oppenheim 2003
Music, unit of assessment 67, was deemed to be an interesting subject for this study as the output of the sector is mixed, consisting of a much wider range of formats than just the traditional journal article or monograph, etc. A significant part of the sector is involved in the creation of new material in composition and performance. These creative outputs are not expected to make the same impact as written works in journal-based citation indexes, making the sector as a whole seem, at first glance, to be far less suited to citation-based measures of quality.
This study tested the null hypothesis that there is no correlation between music departmental Research Assessment Exercise scores and citation counts achieved and that, therefore, citation counts could not provide a comparable measure of quality.
Scores given by the Research Assessment Exercise in 2001 (hereafter, 'the 2001 Exercise') were taken as the best assessment of music research available at this time. Usefully, at least one music department gained each of the seven available assessment scores (1-5*) at the 2001 Exercise. These scores were correlated (using similar methods to previous studies to facilitate meaningful comparison – see below) with the citation counts for each department (based on publications produced by their constituent staff members during the census period of 1994-2000 inclusive).
The specific outputs of authors, as shown on the 2001 Exercise Website, were recorded and analysed to show characteristics of various author groups. This provides a better light in which to view the results of the preceding correlation tests.
The first Exercise was held in 1986 to determine the distribution of research funding to UK universities. Indeed, about £5 billion of research funds was distributed in response to the results of the 2001 Exercise.
In order to award scores that show research excellence, 'the Research Assessment Exercise is concerned with making a qualitative judgement of the research output of those university departments who submit themselves to the procedure' (Norris & Oppenheim 2003: 709). These scores reflect research quality with a scale, which, along with the assessment methods, has developed over time. The 2001 scale and the associated descriptions are shown in Table 1.
| Score | Description |
|---|---|
| 5* | Quality that equates to attainable levels of international excellence in more than half of the research activity submitted and attainable levels of national excellence in the remainder |
| 5 | Quality that equates to attainable levels of international excellence in up to half of the research activity submitted and to attainable levels of national excellence in virtually all of the remainder |
| 4 | Quality that equates to attainable levels of national excellence in virtually all of the research activity submitted, showing some evidence of international excellence |
| 3a | Quality that equates to attainable levels of national excellence in over two-thirds of the research activity submitted, possibly showing evidence of international excellence |
| 3b | Quality that equates to attainable levels of national excellence in more than half of the research activity submitted |
| 2 | Quality that equates to attainable levels of national excellence in up to half of the research activity submitted |
| 1 | Quality that equates to attainable levels of national excellence in none, or virtually none, of the research activity submitted |
The assessment process, based on peer review, has been developing since the Exercise's inception, becoming more open with each exercise (A guide to the 2001 Research Assessment Exercise 2002). Along with the setting of criteria by each successive group of panels, the Roberts Review (Roberts 2004) looked at the running of the Exercise and suggested further changes that could be made to the process. In the review report, Roberts stated his belief that, 'it is time to move away from a 'one-size-fits-all' assessment, to a model which concentrates assessment effort where the stakes are highest', aiming at, 'efficiency and fairness' (Roberts 2004).
However, Roberts's proposals for the running of the Exercise appear to have been ignored, with a new metrics-based assessment system being announced in 2006 (HM Treasury 2006: 61). That science was the main area in mind during the formulation of this new direction is evident in the announcement of the change, it having been made within the section 'Science and innovation' of the 2006 UK Budget (HM Treasury 2006: 61).
The future for research assessment for the arts and humanities following the 2008 Exercise is as yet unclear, except that they will 'be assessed through a light-touch process, based on peer review and informed by statistical indicators in common with the science-based disciplines' (Eastwood 2007). There will be further consultation for non-science based subjects in 2009/10.
Citation analysis. A wide-ranging area of bibliometrics that studies the citations to and from documents (Diodato 1994: 33).
The common currency of citation analysis is the citation. Diodato states that the term 'citation count' (also called citation rate or citation frequency) 'refers to the number of citations an author, document, or journal has received during a certain period of time' (Diodato 1994: 39).
The normative theory of citation is that 'bibliographies are lists of influences and that authors cite in order to give credit where credit is due; that is, when an author uses information from another's work, he will cite that work' (MacRoberts & MacRoberts 1989: 342). Following on from this, number of citations is taken to equate to the quality of the work being cited with larger numbers of citations reflecting better quality. In this way, Cole and Cole suggest that 'citations are not a measure of the absolute quality of work, they are an adequate measure of the quality of work socially defined' (Cole & Cole 1973: 24).
As a tool for analysis, Garfield (1979) suggests that 'the simplicity of citation indexing is one of its main strengths' (Garfield 1979: 1). He states that 'a citation index is built around these linkages [i.e. citations]. It lists publications that have been cited and identifies the sources of the citations' (Garfield 1979: 1). Baird and Oppenheim (1994) state that:
citation indexing gives insight into the way science—including social sciences and humanities—is carried out, and provides material for studying the prestige of academics, the importance of universities, and the efficiency of entire countries' scientific research (Baird & Oppenheim 1994: 3).
However, MacRoberts and MacRoberts (1996: 439) question this underlying basis of citation analysis. They suggest a possible social constructivist view of science where cultural factors have a significant role in the shaping of knowledge and the outcomes are 'subjective, contingent, social, and historical'. In this view of science, citations are part of a compromised creative process and, as such, cannot provide reliable data for objective measures.
Indeed, MacRoberts and MacRoberts (1989: 343) put forward a number of potential weaknesses of citation analysis:
They concluded that 'any results obtained by using citations as data will, at best, have to be considered tentative' (MacRoberts & MacRoberts 1989: 347).
Citation analysis can be used to quantify past performance and van Raan (1996) suggests that past performance is a good predictor of future performance. Moed (2005) explores in depth aspects of accuracy, theory and the practical use of citation analysis, whilst critically evaluating its strengths and weaknesses.
Holmes and Oppenheim (2001) suggest that citation analysis could be useful to assessed institutions in their preparations for an assessment exercise, informing decisions about the inclusion of staff based on citation count. In another paper, Oppenheim has further suggested that the Exercise could be replaced by citation analysis as it is quicker and cheaper than the existing system (Oppenheim 1996: 161).
In a study that analysed data from the Proceedings of the International Communication Association, So (1998) concurs with Oppenheim, advocating 'the use of citation data as an alternative and even a substitute for peer review exercise' because 'citation results correlate highly with expert review results' (So 1998: 332). Smith and Eysenck (2002) have come to the same conclusion.
However, van Raan suggests that the 'ranking of research institutions by bibliometric methods is an improper tool for research performance evaluation' (van Raan 2005: 133). He puts forward the view that a system employing advanced bibliometric indicators should be used alongside a peer-based evaluation procedure, concurring with Holmes & Oppenheim (2001) and Warner (2000).
There have been a number of studies that look at possible correlations between citation counts and scores given by various Research Assessment Exercises to subject departments. These studies have used different methods, yet returned statistically significant correlations in each case. No studies showing no correlation have been found. The existence of significant correlations between the results of citation counts and the decisions made by expert peer-review in these studies leads to the conclusion that citation counts could be a reliable indicator of research quality for use in the Research Assessment Exercise. The examples listed below formed the basis for comparison with the present study.
| Author(s) | Date | Subject area |
|---|---|---|
| Oppenheim | 1995 | Library & Information Science |
| Seng & Willett | 1995 | Library & Information Science |
| Oppenheim | 1997 | Genetics, Anatomy, Archaeology |
| Thomas & Watkins | 1998 | Business & Management |
| Sarwar* | 2000 | Civil Engineering |
| Smith & Eysenck | 2002 | Psychology |
| Norris & Oppenheim | 2003 | Archaeology |
| *Sarwar does not give any evidence regarding correlations. Calculations based on Sarwar's data can be found in Summers (2007: 17). | ||
However, potential problems with the use of correlations between citation analysis and Exercise scores are raised by Warner (2000). He suggests that there is 'a weak, and unsatisfactorily treated, correlation between citation aggregates and research quality for individual entities' and suggests that 'the future value of citation analysis could be to inform, but not to determine, judgments of research quality' (Warner 2000: 453).
Oppenheim (2000: 459) counters this view by suggesting that Warner's conclusions come more from focusing on potential weaknesses rather than viewing the evidence of an inherent robustness that is displayed by citation study results, echoing Hemlin (1996) who notes that correlations exist despite valid criticisms of citation analysis.
'Science on the one hand and humanities on the other are two distinct domains of scholarship with essentially different substantive contents' (Moed 2005: 12). It follows that the application of citation indexing to these differing domains may yield outcomes of differing usefulness because of the favoured publication type of each subject area. In science, there is the 'consistently demonstrated primacy of the journal article', whereas the monograph is 'the leading medium of scholarly communication in the humanities' (Cullars 1998: 42). In relation to this, 'the application of citation index data depends on the role of journal articles in the different fields' (van Raan 2005: 138).
The Web of Knowledge citation indexes, including the Arts and Humanities Citation Index, use journals to provide their citation data. Moed describes as moderate the adequacy of coverage of the humanities in the citation indexes (Moed 2005: 138). Coverage is defined as '...the extent to which the sources processed by Thomson for its Citation Indexes (mainly scholarly journals) cover the written scholarly literature in a field'. (Moed 2005: 119). He suggests that 'a principal cause of non-excellent coverage is the importance of sources other than international journals, such as books and conference proceedings' (Moed 2005: 3).
Another critical factor for the improvement of coverage may be the feasibility of compiling any list of core journals. Within music, this factor arose with a heated debate when the Arts and Humanities Research Council proposed that academics nominate their (ten) choices for a list of core journals. The primary concern of academics was that ten journals cannot adequately represent a sub-field of music, let alone music as a whole. Unsurprisingly, this project was abandoned (Laura Lugg, AHRC, personal communication, 15 August, 2006)
Since then, the European Science Foundation Standing Committee for the Humanities has instigated the European Reference Index for the Humanities. This aims to provide 'quantitative criteria and to advance an evaluation of the research productivity in terms of bibliometrics' (Peyraube 2005: 1) and to provide an international reference tool that would succeed where the Arts and Humanities Citation Index does not, in terms of providing a comprehensive coverage of the humanities.
The nature of music and its study is an area that lends itself to a large research footprint with many overlaps with other disciplines and many different directions of proceeding. Beyond the traditional fields in music (historical musicology, theory, composition, etc.), there are overlaps with, for example, analytical studies, psychology, artificial intelligence, medicine, education, sociology and cultural studies. Additionally,
...research on all these topics is distinct from creative work in them and can be separated off for inclusion under the 'humanities research' banner. In practice, the distinction has often been blurred, with an uncertain boundary between research and creative work (Meadows 1998: 41).
As it is not always easy to distinguish between research and practice, research assessment is not straight forward as, in many cases, any assessor must first decide how much research is contained in any given submission.
One factor that could affect the success of citation analysis is music citing practice. Traditional outputs such as articles and monographs are broadly similar to other subject areas. Any music-specific outputs (compositions, performances, etc.) are likely to have differing practices, given that music itself (that is, the sound or notational playing directions) cannot give explicit reference except in the musical sense. However, music-specific outputs can be cited as existing or having happened, especially in reviews, and analyses of compositions feature in analysis-focused journals.
Given that it must assess music research, the Research Assessment Exercise offers an overview of what constitutes music research for each assessment. Reflecting the wide-ranging work of music academics, this description has become increasingly inclusive over successive Exercises. The published criteria of the music sub-panel for the 2008 Exercise give a good overview of music as follows:
The sub-panel will assess research from all areas of music, which include (but are not confined to):
- composition and creative practice
- performance
- musicology (including historical, critical, empirical, ethnographic, theoretical, analytical and organological approaches)
- scientific approaches to the study of music
- new technology and music
- musical acoustics and audio engineering (where the subject matter is music-related)
- appropriate pedagogic research in any of the areas identified above (Research Assessment Exercise 2006: 65)
The phrase 'not confined to' in the above will allow the flexibility necessary in a field where the nature of its research output is seen to be diverse and continually expanding. The record of submissions for the 2001 Exercise shows a cross-section of music research outputs in all of these areas.
As a contribution to the Roberts review, Banfield (2003) wrote on behalf of National Association for Music in Higher Education to the Higher Education Funding Council for England. He detailed some specifics about metrics that could be included in possible assessment:
Greater use of algorithms seems to appeal to creative arts departments and practitioners more than scholarly ones, perhaps in line with audience and community reception as opposed to readership and citation—but these are a minority (Banfield 2003: 2).
Banfield confirms that 'peer review remains the favoured method of assessment', stating that 'citation measurement is deeply distrusted', not least because peer review may do most to retain the individual nature of music departments, where 'there is a general repugnance towards standardisation' (Banfield 2003: 2).
The criteria above reflect a flexible method of assessment developed in conjunction with music academics for their subject area in the form of an inclusive peer assessment. Indeed, many believe that despite the flaws that may exist at present, 'without peer review the chances of any suitable assessment of the work of music staff across the sector seem bleak.'Johnson 2006
At the core of this study is a citation analysis that counted citations received by academics who were submitted for peer review in Unit of Assessment 67 in the 2001 Exercise. The collected citation counts were then checked for correlations with the Assessment Exercise scores awarded to each department.
Until now, studies of the correlation of citation counts and Assessment Exercise scores have concentrated on subjects from either science or from the more scientific end of the humanities (e.g., archaeology). Music provides a different set of circumstances to consider, especially its non-standard outputs, which seem far less suited to citation-based measures of quality.
Various databases with citation information exist, but often they do not cover music (e.g., Scopus) or cover it in an unreliable way (e.g., Google Scholar, the unreliability of which is demonstrated by Jacso (2006)) and the European Reference Index previously mentioned is not yet beyond the consultation stage. As the longest established and most comprehensive citation index in terms of coverage, the Arts and Humanities Citation Index was used for the collection of citation statistics relating to music.
Details of the 2001 Exercise submissions were taken from the Website (HERO 2002). Relevant data were:
Fifty-nine departments with 724 named academics were returned for music in 2001. Academics with no listed submissions were excluded, providing a second list with a total of 670 names. Details of the 670 sets of submissions were entered into a spreadsheet, listing department name, the academics' names and the type of each of their four submissions (journal article, authored book, composition, etc.).
The standard submission was of four pieces of research for each member of staff, in which could be shown a representative sample of research and its quality. Some academics submitted two (as permitted in some instances). A small number of academics had three submissions and one had just one. Whether these odd numbers were intentional or simply clerical errors is not clear.
The final results of the 2001 Exercise were also taken from HERO (2002), recording a score for each department ranging from 1 to 5*.
The permissible dates for publications assessable in music for the 2001 Exercise were 1994-2000 inclusive. Citations to any material produced by the 670 academics within these dates were counted, not just citations to Research Assessment Exercise submissions. The citations counted were produced between 1994 and the date of searching. The searches were carried out in June and July 2006 using the Arts and Humanities Citation Index.
Each citation was checked to ascertain whether it was attributable to the chosen music author, using their submissions as a general guide to the author's research interests. Where a citation was unclear, a check of the record of the article from which it came gave confirmation in most cases. Further help was obtained from authors' homepages and from publishers' catalogues in the case of composers.
Citations to theses were included but citations to items listed as 'unpublished' or 'in press' were ignored. Citations without dates were included only if they were verifiable and related to material published within the study period. This applied mostly to compositions, the dates of which were easily checked. Citations which seemed to have been indexed under the wrong dates were included only if there was very little doubt that an input error had occurred.
The names of the music authors were entered in the format found on the Research Assessment Exercise Website except for hyphenated and compound names, where standard Web of Knowledge contractions were used. Checks often had to be made for authors with multiple initials and those who went by a middle name.
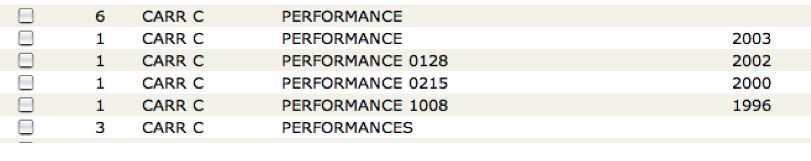
For cited works listed as 'performance' or 'performances' that were undated (as seen in Figure 1), the count was included if the citing article was published between April 1994 and the end of 2000.
Separating authors in the Arts and Humanities Citation Index with the same surname and initial who write in different areas of the arts and humanities was a relatively simple process. However, separating those within similar or even the same disciplines was more difficult, demanding subject knowledge, which, fortunately, was possessed by one of the authors, Summers, a former professional musician with a Master's degree in music.
Some authors were listed under more than one department, with twenty-nine duplicates, two triplicates and one quadruplicate. It was decided that it was not necessary to make special allowances for this case as Research Assessment Exercise rules allow staff to be counted in more than one department.
Now that the Arts and Humanities Citation Index generally includes co-authors, a significant earlier objection to the citation counting process has been removed (Norris & Oppenheim 2003: 717). However, this only applies to the authors of articles from journals indexed by the Arts and Humanities Citation Index and not to the citations contained within those articles. During the searching procedure, some instances of second authors being disadvantaged were found. For example, Rethinking music ( Cook & Everist 1999) was jointly edited, but Cook received fourteen citations for it and Everist only one.
This could be a significant problem in obtaining accurate counts. However, as Oppenheim ( 1997) points out, the aim is to achieve a comparative ranking rather than an absolute count, as the specific count data is lost when rankings are compiled for correlation.
Self-citation, whilst present, did not have undue influence on the citation counts. Snyder and Bonzi show that the humanities have a very low self-citation rate (3%) compared to other fields and suggest that this is because humanities scholarship is more non-incremental in nature when compared with the sciences (Snyder & Bonzi 1998: 436).
The length of time between the end of the survey period (i.e., 1994-2000) and the counting process (2006) was deemed sufficient to allow even the material published at the very end of the period to accrue citations, removing any disadvantages to those submitting newer material. Furthermore, it was found that the date range of submissions was relatively even across all departments, suggesting that if counting were to take place closer to the end of the survey period all departments would be comparably affected.
A study of the citing patterns of sociologists found that authors form two distinct groups, one favouring journals and the other monographs (Cronin et al. 1997) and this has been noted as a possible influencing feature of such studies (Norris & Oppenheim 2003: 718). There is a larger number of permissible submission types in music compared to other and the authors studied here have submitted a full range of these. Given differing citation practices within music, it is possible that some departments may be disadvantaged unduly by the nature of their constituent authors' output. This is discussed below.
As noted above, Moed (2005) notes that the Arts and Humanities Citation Index has only a moderate (below 40%) coverage of core sources. He suggests that in such moderate cases, 'citation analysis based on the WoK sources plays a limited role or no role at all in a research assessment study' (Moed 2005: 142). However, with the difficulties in conducting source-expanded analyses (Moed 2005: 142), the case for using Web of Knowledge sources is compelling as it provides a relatively quick and straight-forward method of testing a citation-based hypothesis, an important consideration in any time-limited study.
This study takes all the above factors into account, leading to the most representative ranking of departments possible from the data available.
If N is the number of authors in a department and C is the number of citations an author receives, then the total number of citations received by all authors in a department is TD, the departmental total:
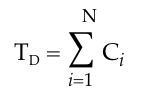
where a particular author in question within a department is represented by the index i such that all authors can be considered by letting i=1,2,3,',N-1,N.
For each department, AD denotes the number of authors in that department, expressed as a full time equivalent. This information was supplied by the Research Assessment Exercise in the publication of its results (HERO 2002).
Four values were calculated for each of the fifty-nine departments:
The list of departments was then ordered seven times: by the 2001 Exercise score; by each of the results of the four calculations above; by the total number of submitted articles that each department published in Arts and Humanities Citation Index-indexed journals; and by AD. Ranks were assigned according to those orders. Additionally, authors were ranked according to their individual citation counts.
This study performed the same statistical test used by other studies (for example, Seng & Willet 1995, Smith & Eysenck 2002, Norris & Oppenheim 2003), namely the Spearman rank order correlation coefficient. This test indicates whether a correlation exists between two sets of rankings, giving a value of rs where rs=±1 indicates a perfect correlation and rs=0 indicates no correlation.
The Research Assessment Exercise rankings were paired with each of the departmental rankings. For the ranking of individual authors, their ranks were paired with the Research Assessment Exercise rank of their department. The correlation calculations for each set of pairs were run using SPSS software (version 14) and a figure for rs was returned in each case, along with a figure for the level of statistical significance.
| Rankings | |||||||
|---|---|---|---|---|---|---|---|
| Department | RAE score | TD | TD/N | TD/AD | (TD/N)AD | AHCI journal | AD |
| University of Birmingham | 5* | 26 | 25 | 26 | 29 | 17= | 23= |
| University of Cambridge | 5* | 4 | 8 | 9 | 4 | 1 | 3 |
| City University | 5* | 13 | 5 | 7 | 10 | 28= | 33 |
| University of Manchester | 5* | 9 | 13 | 8 | 9 | 46= | 15= |
| University of Newcastle | 5* | 29 | 31 | 31 | 30 | 10 | 23= |
| University of Nottingham | 5* | 12 | 14 | 10 | 14 | 17= | 23= |
| University of Oxford | 5* | 3 | 9 | 5 | 5 | 4= | 1= |
| Royal Holloway, University of London | 5* | 5 | 7 | 3 | 6 | 7= | 8= |
| University of Southampton | 5* | 2 | 2 | 2 | 2 | 2 | 8= |
| University of Bristol | 5 | 18 | 17 | 17 | 17 | 11= | 23= |
| Goldsmiths College | 5 | 15= | 21 | 22 | 15 | 3 | 12 |
| University of Huddersfield | 5 | 37= | 35 | 35 | 33 | 34= | 23= |
| University of Hull | 5 | 22 | 15 | 14 | 22 | 34= | 39= |
| King's College London | 5 | 6 | 3 | 6 | 3 | 17= | 13 |
| School of Oriental and African Studies | 5 | 20 | 18 | 15 | 23 | 17= | 36 |
| University of Sheffield | 5 | 1 | 1 | 1 | 1 | 7= | 15= |
| University of Sussex | 5 | 35= | 10 | 27 | 24 | 34= | 52= |
| University of York | 5 | 14 | 30 | 24 | 20 | 15= | 7 |
| University of Wales, Bangor | 5 | 21 | 23 | 21 | 27 | 34= | 22 |
| Cardiff University | 5 | 11 | 11 | 11 | 11 | 17= | 20= |
| The Queen's University of Belfast | 5 | 25 | 24 | 25 | 28 | 4= | 23= |
| Dartington College of Arts | 4 | 40 | 41= | 40= | 42 | 46= | 34= |
| De Montfort University | 4 | 39 | 29 | 30 | 36 | 34= | 50 |
| University of Durham | 4 | 17 | 16 | 18= | 12 | 4= | 15= |
| University of East Anglia | 4 | 42= | 36 | 36= | 43 | 17= | 52= |
| University of Exeter | 4 | 34 | 34 | 33 | 32 | 11= | 30= |
| Keele University | 4 | 23= | 22 | 23 | 21 | 11= | 23= |
| Lancaster University | 4 | 23= | 4 | 13 | 13 | 11= | 46= |
| University of Leeds | 4 | 8 | 12 | 12 | 7 | 7= | 10 |
| University of Liverpool | 4 | 19 | 20 | 18= | 18 | 46= | 20= |
| Open University | 4 | 10 | 6 | 4 | 8 | 15= | 30= |
| Royal Academy of Music | 4 | 7 | 28 | 16 | 16 | 28= | 1= |
| Royal College of Music | 4 | 27 | 41= | 36= | 31 | 28= | 4 |
| Royal Northern College of Music | 4 | 31= | 48 | 42 | 40 | 46= | 6 |
| University of Salford | 4 | 35= | 39= | 38 | 35 | 28= | 19 |
| University of Edinburgh | 4 | 15= | 26 | 20 | 19 | 28= | 14 |
| University of Glasgow | 4 | 37= | 19 | 32 | 26 | 34= | 37= |
| Bath Spa University College | 3a | 54= | 55 | 55 | 55 | 34= | 32 |
| Bretton Hall | 3a | 56= | 56= | 56= | 56= | 46= | 46= |
| University of Central England in Birmingham | 3a | 28 | 46 | 40= | 37 | 17= | 5 |
| Oxford Brookes University | 3a | 45= | 37= | 45= | 39 | 17= | 39= |
| University of Reading | 3a | 42= | 33 | 43 | 34 | 34= | 37= |
| University of Surrey | 3a | 30 | 27 | 34 | 25 | 17= | 15= |
| University of Surrey Roehampton | 3a | 45= | 45 | 45= | 44 | 17= | 39= |
| University of Aberdeen | 3a | 33 | 32 | 28 | 38 | 28= | 49 |
| University of Ulster | 3a | 52= | 43= | 45= | 47= | 17= | 57= |
| Anglia Polytechnic University | 3b | 42= | 49= | 44 | 50 | 34= | 34= |
| Canterbury Christ Church University College | 3b | 49= | 49= | 50 | 53 | 46= | 45 |
| University of Hertfordshire | 3b | 31= | 37= | 29 | 41 | 46= | 44 |
| Kingston University | 3b | 47= | 47 | 51= | 46 | 34= | 39= |
| Liverpool Hope | 3b | 56= | 56= | 56= | 56= | 46= | 57= |
| London Guildhall University | 3b | 56= | 56= | 56= | 56= | 46= | 51 |
| University College Northampton | 3b | 49= | 43= | 45= | 45 | 34= | 52= |
| Royal Scottish Academy of Music and Drama | 3b | 41 | 54 | 53 | 49 | 46= | 11 |
| Liverpool John Moores University | 2 | 54= | 53 | 54 | 54 | 46= | 52= |
| St Martin's College | 2 | 52= | 39= | 39 | 47= | 34= | 59 |
| Thames Valley University | 2 | 49= | 49= | 51= | 51 | 46= | 39= |
| Napier University | 2 | 47= | 49= | 49 | 52 | 46= | 48 |
| University College Chichester | 1 | 56= | 56= | 56= | 56= | 46= | 52= |
| Test for correlation between Research Assessment Exercise scores and: | rS |
|---|---|
| TD | 0.80 |
| TD/AD | 0.81 |
| (TD x AD)/N | 0.81 |
| Number of articles in Arts and Humanities Citation Index-indexed journals | 0.60 |
| AD | 0.56 |
| Individual citation counts | 0.46 |
Results for rs are shown rounded to two decimal places. All correlation scores are highly statistically significant at the 0.01% level.
The null hypothesis tested in this study (that there is no correlation between citation counts of authors working in UK university music departments and the scores awarded to those departments by the 2001 Exercise) was disproved. The results show that there is a strong correlation at departmental level and a weaker correlation at individual level.
The 670 authors had a total count of 3487 citations. The range of individual counts was 0-140 citations, with a mean of 5.2 citations. The mean for the 372 cited authors (56%) was 9.4 citations. 298 authors (44%) had a count of 0 and 221 authors (33%) had a count of 1-6.
Twenty authors appear twice and one author appears three times, accounting for 258 or 7.4% of the total number of citations (an author's total is counted each time their name appears in the list, the non-duplicated count for these authors being 129). Removing duplications, the authors received a collective total of 3348 citations, with a range of 0-140 and a mean of 5.2 citations (9.3 for cited authors).
The top count of 140 citations was achieved by Davidson JW of the University of Sheffield. The ten highest scoring authors account for 730 citations, representing around 20% of all citations (see Table 5 below). An additional 52 citations are accounted for if the duplication of Birtwistle H (King's College, London and Royal Academy of Music) is included.
| Author name | Department | Field | Count |
|---|---|---|---|
| Davidson JW | University of Sheffield | Music psychology | 140 |
| Cook NJ | University of Southampton | Musicology (various*) | 127 |
| Clarke EF | University of Sheffield | Music psychology | 90 |
| Bent M | University of Oxford | Historical musicology | 77 |
| Fallows DN | University of Manchester | Historical musicology | 70 |
| Birtwistle H | King's College London/Royal Academy of Music | Composition | 52 |
| Burden M | University of Oxford | Historical musicology | 43 |
| Strohm R | University of Oxford | Historical musicology | 41 |
| Emmerson ST | City University | Electroacoustics** | 39 |
| Burrows DJ | Open University | Historical musicology | 38 |
| (Total 730) |
Music psychology can be seen to be an area of music in which it is possible to receive a noticeably larger number of citations, work in this field accounting for the first- and third-placed counts and a proportion of the second-placed count.
The citation counts show a distribution that approximately follows the '80/20 rule' (Pareto's Law). The top 20% or 134 authors account for 2821 citations or 80.9% of the total number of citations.
For comparison with a similar study (Norris & Oppenheim 2003), Unit of Assessment 58 (archaeology) had 682 authors with a collective total of 6213 citations. The range of individual counts was 0-565, with a mean of 9.1 citations. The mean for the 420 cited authors (62%) was 14.8, with just over 50% of these having a count ranging from one to six citations.
The values for rs shown in Table 4 above indicate a strong correlation between citation counts and the 2001 Exercise scores for UK university music departments in four tests. For the remaining three tests, between Research Assessment Exercise scores and individual counts, numbers for authors and Arts and Humanities Citation Index articles, there is a weaker correlation.
Four of the correlations between departmental citation counts and respective Research Assessment Exercise scores are all reasonably similar, each with a value of rs=0.80 or rs=0.81. Below is an example of a bivariate scatterplot of the underlying data for one of these results (see Figure 2 below), in this case the correlation between Research Assessment Exercise scores and TD where rs=0.80. These correlations are again seen to be similar to the findings of Norris and Oppenheim (2003: 722). These compare with two results of rs=0.80 for music.
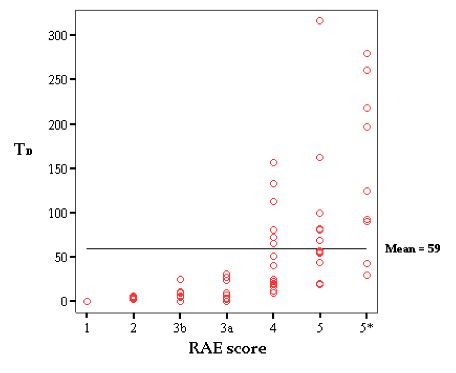
In this scatterplot, one can see the general trend for higher Research Assessment Exercise score correlating with higher citation count total. Apart from the highest total in Research Assessment Exercise score 5, there is a continuous upward trend for both upper and lower edges of each score grouping. It is interesting to note that departments only achieve more than the departmental mean total (59 citations) at Research Assessment Exercise score 4 and above, the point at which funding is awarded by HEFCE (2006).
However, Figure 2 shows the amount of detail that can be lost in a value for rs. Especially notable are a number of anomalous outliers, the most striking of which is Sheffield University at the top of the 5 group. This department employs the top- and third-placed authors, who together account for over two-thirds (230) of the departmental total (316). This raises the possibility that, if research monies were handed out according to citation counts, a citation count-led 'transfer market' could result, where authors could take their high counts and offer them to the highest bidders, who in turn could make financial gains.
Conversely, examples can be seen of departments achieving low scores despite the collective excellence of the constituent authors (as measured by the 2001 Exercise). The Universities of Birmingham and Newcastle in the 5* group and University of Huddersfield in the 5s stand out at the bottom, the simple fact that they are there casting doubt on citation counting as a sound basis for a system for assessing research, with each department doing comparatively badly in the first four rankings.
Two possible factors in these results are discussed below, namely Arts and Humanities Citation Index coverage and authors' output types.
The continuous upward trend is again striking when looking at the mean departmental citation count within Research Assessment Exercise score groups, as seen in Table 6 below. Here, there is an exact correlation (rs=1).
| RAE score | Mean no of citations per dept. |
|---|---|
| 5* | 148.00 |
| 5 | 88.08 |
| 4 | 55.25 |
| 3a | 12.22 |
| 3b | 7.50 |
| 2 | 4.25 |
| 1 | 0.00 |
An approximation of personal scores could be made by assigning the score of an author's department to that author. This approximation is based on the explanations of the range of scores, which show an incremental nature, stating the proportion of national and international standard research activity within each department (see Table 1 above). Increases in a department's score indicate increases in the quality of the research activity within that department as a whole (in the judgement of the panel). The assessment of the quality of the research output of a department's authors plays a prominent role in the calculation of the Assessment score. (There is no public information to suggest that individual authors are graded but, having been on the music sub-panel for the 2001 Exercise, one of the academics interviewed during this study confirmed that such gradings are used.) Therefore, it can be assumed that there would be a strong correlation between the score of a department and any score given to each author by the sub-panel assessing it.
Using this approximation to run a further correlation test, there was a weaker correlation between the constituent authors' citation counts and the Exercise score of their department, with rs=0.46, but this is still significant at the 0.01% level.
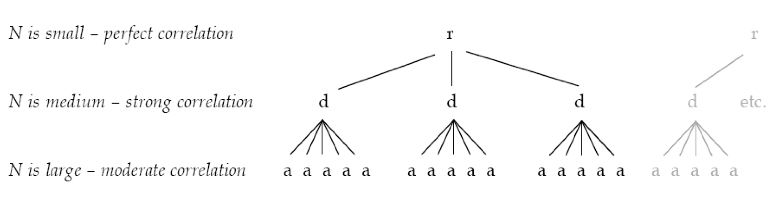
Looking at the correlation of approximate personal scores in conjunction with the two groupings seen above (authors summed into their departments and departments summed with others of the same Research Assessment Exercise score), a pattern can be seen to emerge. Where the resolution of the analysis is most detailed (i.e., at the individual author count level where N is a large number) the correlation is weakest. Conversely, where the resolution is at its least detailed (i.e., at the Research Assessment Exercise score level where N is small) the correlation is strongest. This is likely to be due to the averaging effect of the summation of counts into larger units where the small scale detail in the variation of counts is ironed-out (see Figure 3 below).
Given that the music sub-panel allows a greater number of submission types than other panels, it is possible to categorise authors in into distinct groups. At the most general level, one can see a split between research that involves publishing written material on the one hand and, on the other hand, practice-based research which produces performances and compositions. A summary of authors' submission types is shown in Table 8 below.
| Submission type | Instances |
|---|---|
| Written research Authored book Chapter in book Edited book Journal article |
178 367 35 445 |
| Practice-based research Composition Performance Artefact Other (CD) Design Conference contribution |
650 429 8 221 1 77 |
| Other Chapter/software Exhibition Internet publication Other (not CD) Report Scholarly edition Software – (no submission) |
1 3 28 50 1 76 9 101 |
| Total | 2680 |
The collected data were analysed to identify trends regarding submission type. In the case of each author, a 'submission predominance' was assigned to show their favoured output type. A summary of these predominances is shown in Table 8 below, grouping them into four wider categories: 'composition', 'performance', 'writing' and 'other'. (The last of these is a short form of the Research Assessment Exercise formulation, 'other form of assessable output'.)
| Predominance categories | Instances |
|---|---|
| Composition | 153 |
| Performance | 156 |
| Writing Books Journal articles Mixed writing |
253 (99) (60) (94) |
| Other Artefact Conference contribution Internet publication Mixed Mixed practice Scholarly edition Other |
108 (2) (7) (1) (83) (9) (4) (2) |
| Total | 670 |
This method gives an approximate view of the music community which is useful for purposes of analysis. It should not be taken as an accurate categorisation but one that allows a good general view from which some conclusions can be drawn.
Arranging the authors into groups by their submission types and examining the citation counts achieved by each group reveals a marked difference in citation count ranges and averages (see Table 9 below).
| Predominant submission type | Total no. citations | Mean count | Range | No. authors | No. cited authors* | % of total citations |
|---|---|---|---|---|---|---|
| Composition | 274 | 1.8 | 0-52 | 153 | 46 (30%) | 7.9 |
| Performance | 136 | 0.9 | 0-12 | 156 | 54 (35%) | 3.9 |
| Writing Books Journal articles Mixed writing |
2717 (1168) (653) (896) |
10.7 (11.8) (10.9) (9.5) |
0-140 0-127 0-140 0-70 |
253 99 60 94 |
211 (84%) 85 (86%) 52 (87%) 74 (79%) |
77.9 |
| Other Artefact Conference contrib. Internet publication Mixed Mixed practice Other Scholarly edition |
360 (0) (23) (1) (291) (18) (0) (27) |
3.33 (0) (3.3) (1) (3.5) (2) (0) (6.6) |
0-26 0 0-14 1 0-26 0-16 0 0-15 |
108 2 7 1 83 9 2 4 |
61 (56%) 0 (0%) 3 (43%) 1 (100%) 50 (60%) 3 (33%) 0 (0%) 4 (100%) |
10.3 |
| Total | 3487 | – | – | 670 | 372 (56%) | 100 |
Based on these predominance categorisations, it can be seen that those producing practice-based research (notably composers and performers) are much less likely to receive citations than those producing published writing. Those submitting predominantly written materials (i.e., books, journals and mixed writing) receive a much greater proportion of the total citations (77.9% of the total) and have the highest average of the main submission type groups (10.7 citations overall). Furthermore, the proportion of authors receiving at least one citation is significantly higher in these groups.
Incidentally, the significance of books in the study of music can be seen in the fact that within the data collected those writings predominantly in books are cited almost twice as often as journals. This implies that a solely journal-based data source cannot truly reflect music as a subject.
That composers and performers received fewer citations than writers is mirrored by their lower production of citations. A performer performs a piece of music, either in public or on a recording. This performance cannot cite research in any meaningfully explicit way, except perhaps in writings associated with a performance (such as programme and CD booklet notes) and most citations would come from concert reviews. A composition is a piece of music that can exist either on the page in notation or in a listener's perception. It can be played in public, recorded and sold or broadcast and it can be cited in written work by others. However, as with performance, it cannot cite other work in the way seen in traditional text-based scholarly research and thus cannot contribute to citation indexes. This leaves practice-based authors at a disadvantage in citation analysis.
Similar indications of predominance were produced at a departmental level, using the categories of writing, composition, performance or mixed. Again, this produces a crude approximation of the typical output of each department, which is instructive in analysis (see Table 10 below).
| Predominant submission types | Number |
|---|---|
| Writing | 26 |
| Mixed | 21 |
| Performance | 7 |
| Composition | 5 |
| Total | 59 |
It can be seen in Table 11 below that those departments with high values for TD are most likely to be classed as writing departments. Conversely, those with low values for TD are most likely not to be writing departments. Also, writing departments are more likely to have a higher Research Assessment Exercise score: seven writing departments with 5*, nine with 5, seven with 4 and three with 3a (there are no departments with 1–3b).
| Department | RAE score | TD | DPr | Department | RAE score | TD | DPr |
|---|---|---|---|---|---|---|---|
| University of Sheffield | 5 | 316 | W | University of Hertfordshire | 3b | 25 | C |
| University of Southampton | 5* | 279 | W | Royal Northern College of Music | 4 | 25 | P |
| University of Oxford | 5* | 260 | W | University of Aberdeen | 3a | 23 | W |
| University of Cambridge | 5* | 218 | W | University of Exeter | 4 | 22 | M |
| Royal Holloway | 5* | 197 | W | University of Salford | 4 | 20 | M |
| King's College London | 5 | 162 | M | University of Sussex | 5 | 20 | W |
| Royal Academy of Music | 4 | 156 | P | University of Huddersfield | 5 | 19 | M |
| University of Leeds | 4 | 132 | W | University of Glasgow | 4 | 19 | M |
| University of Manchester | 5* | 124 | M | De Montfort University | 4 | 17 | M |
| Open University | 4 | 113 | W | Dartington College of Arts | 4 | 12 | M |
| Cardiff University | 5 | 99 | W | Royal Scottish Academy of Music and Drama | 3b | 10 | P |
| University of Nottingham | 5* | 92 | W | Anglia Polytechnic University | 3b | 9 | M |
| City University | 5* | 90 | W | University of East Anglia | 4 | 9 | W |
| University of York | 5 | 82 | M | University of Reading | 3a | 9 | W |
| Goldsmiths College | 5 | 80 | W | Oxford Brookes University | 3a | 7 | M |
| University of Edinburgh | 4 | 80 | W | University of Surrey Roehampton | 3a | 7 | W |
| University of Durham | 4 | 72 | W | Kingston University | 3b | 6 | M |
| University of Bristol | 5 | 68 | W | Napier University | 2 | 6 | P |
| University of Liverpool | 4 | 65 | W | Canterbury Christ Church Univ. College | 3b | 5 | P |
| School of Oriental and African Studies | 5 | 57 | W | University College Northampton | 3b | 5 | C |
| University of Wales, Bangor | 5 | 56 | W | Thames Valley University | 2 | 5 | M |
| University of Hull | 5 | 54 | W | St Martin's College | 2 | 4 | M |
| Keele University | 4 | 51 | M | University of Ulster | 3a | 4 | M |
| Lancaster University | 4 | 51 | W | Bath Spa University College | 3a | 2 | M |
| Queen's University, Belfast | 5 | 44 | W | Liverpool John Moores Univ. | 2 | 2 | C |
| University of Birmingham | 5* | 43 | M | Bretton Hall | 3a | 0 | M |
| Royal College of Music | 4 | 40 | P | Liverpool Hope | 3b | 0 | C |
| Univ. of Central England in Birmingham | 3a | 31 | P | London Guildhall University | 3b | 0 | M |
| University of Newcastle | 5* | 29 | W | University College Chichester | 1 | 0 | C |
| University of Surrey | 3a | 27 | M | Note: DPr = departmental predominance W = writing, M = mixed, P = performance, C = composition |
|||
Again, this is perhaps as much a reflection of the data source as the ability of citations to provide a measure of quality, but equally it may be that departments with a higher quality of research (as assessed by the Exercise) are more likely to produce written material than any other submission type.
However, being a writing department does not guarantee a high score (e.g., University of Newcastle), nor does being a performance department guarantee a low score (e.g., Royal Academy of Music) and, to repeat, such predominance designations are approximate.
When this study was carried out, sixty-three journals (listed as being in the subject of music) were indexed by Arts and Humanities Citation Index (Thomson [n.d.]) (As of 1st June 2008, there were seventy.) The 445 submissions for the 2001 Exercise, which were classed as journal articles appeared in a total of 181 different journals. Of these, 194 were submitted to a total of 34 of the 63 music journals indexed by the Arts and Humanities Citation Index. The top ten journals by numbers of articles submitted for the 2001 Exercise are shown in Table 12 below.
| Journal title | No. of submissions |
|---|---|
| Music Analysis* | 28 |
| Music and Letters* | 25 |
| Journal of the Royal Musicological Association* | 24 |
| Early Music* | 22 |
| Cambridge Opera Journal | 14 |
| Musical Times* | 13 |
| Organised Sound | 10 |
| British Journal of Ethnomusicology | 9 |
| British Journal of Music education | 9 |
| Contemporary Music Review | 9 |
| Total | 163 |
| * Journals indexed by Arts and Humanities Citation Index | |
A list of total numbers of articles submitted to music journals indexed by the Arts and Humanities Citation Index by each department was made to calculate a mean across each Research Assessment Exercise score group. A perfect correlation between Research Assessment Exercise scores and the number of articles submitted to Arts and Humanities Citation Index-indexed journals can be seen at Research Assessment Exercise score level (see Table 13 below). This is another example of summation hiding low-level variation of counts and thus showing a stronger correlation.
| RAE score | Mean no. of articles |
|---|---|
| 5* | 7.11 |
| 5 | 3.92 |
| 4 | 2.94 |
| 3a | 2.11 |
| 3b | 0.38 |
| 2 | 0.25 |
| 1 | 0.00 |
It is tempting to see numbers of articles submitted to music journals indexed by the Arts and Humanities Citation as a useful, synchronically-available measure that would be as robust as citation counting. However, at rs=0.60 the correlation is weaker and, again, the hidden detail shows enough irregularities as to be unhelpful.
A number of submissions by authors identified as music psychologists were published in journals indexed in the Social Science Citation Index as opposed to Arts and Humanities Citation Index. These include British Journal of Psychology, British Journal of Developmental Psychology and Behavioral and Brain Sciences. This suggests that music psychologists belong to a different area of publication and have a corresponding difference in citing behaviour (these non-music journals have not been counted in the correlation test for journals indexed by the Arts and Humanities Citation Index, which used figures for music journals only).
A number of other authors had submissions that were published in journals indexed by the Arts and Humanities Citation Index that are listed in categories other than music. These journals include Critical Quarterly, Cultural Studies, Historical Journal, New German Critique and Comparative Literature. This shows that authors within music do not constrain themselves to purely music-related journals, with over 30% of all articles being submitted to journals that are not music-specific. This behaviour may possibly be seen among authors in other Units of Assessment, but the wide range of subject areas covered by music departments could suggest that it is perhaps more common within music.
There is currently no available research that explores the specific citing behaviour of music academics. If, as seems likely, certain areas of research have a greater expectation of citing and being cited (e.g. music psychology), this factor should be taken into account in a bibliometric assessment process. If such an assessment process were to involve citation counting as a constituent element, the analysis or calculating algorithm should be weighted in some way according to the citing practice of the subject area being assessed.
Crucial to the validity of citation analysis is the selection of journals to be included in the citation index from which data are taken. Three academics interviewed to inform this discussion all raised the following points:
An example of how a particular publication's inclusion in or exclusion from the list can influence the counting process can be seen in the citation pattern of those showing a 'performance' predominance. Here, fifty-four authors are cited between one and twelve times. Of these, there are twenty performers who play bowed string instruments, altogether receiving 77 citations, 57% of total citations for performers (136). Also, there are seventeen pianists, nine of whom perform with string players (as indicated by their submissions). These nine account for a further 22 citations (16%).
The majority of citations for string players and collaborating pianists came from The Strad, a magazine for professional bowed-string players, teachers and the general public, but which cannot be classed as a research publication in the same way as, for example, Music Analysis, the journal with the most submissions. In this instance, the inclusion of The Strad noticeably increases the representation of one of the constituent groups of authors and it is an example of how non-academic or non-research journals are necessary to ensure the whole subject is covered. Whilst scholarly journals in music carry book reviews and reviews of recordings and music editions (a prime example being Early Music), The Strad's exclusion from the Arts and Humanities Citation Index would lower the citation count of performers considerably.
A potentially rich data-source can be found in the Répertoire International de Littérature Musicale (RILM) Abstracts of Music Literature database. It contains a large amount of bibliographical information that could serve as a source list for a music citation index. At present, it does not list or index references so a citation count cannot be implemented. However, it provides a far more detailed picture of current music research than the Arts and Humanities Citation Index as it is not restricted to journal articles. It includes a large number of books (shown here to be cited twice as often as journals) in its current 400,000 entries (written in 140 languages), with around 30,000 further entries being added every year.
The practical use of citation analysis for research assessment in music would be problematic. Any system would have to be thought out very carefully in order to gain enough widespread support among the assessed to give it credibility.
Correlating Research Assessment Exercise scores with TD, TD/N, TD/AD and (TD x AD)/N, the first four correlation results all show a similar value for rs but in each the underlying data is ‘spelt’ slightly differently. The fourth calculation, (TD x AD)/N, provided a crudely weighted total that may or may not be akin to the FTE weighting used by the Research Assessment Exercise system. The question would be whether a ‘spelling’ could be found that was agreeable to most or all stakeholders.
Looking at the scatterplot in Figure 2 above, one can see large amount of overlapping in the distribution of departments in the y-direction. This indicates the potential for problems if these counts were used for the assignment of Research Assessment Exercise scores. As an example, below are two different possible methods of score assignment, showing clearly that there is a large margin of error when results predicted by these models are compared to the actual the 2001 Exercise scores.
In method one, the spread of scores from the results of Research Assessment Exercise1996 was mapped onto a sample ranking by citation count (in this case by TD) to give a prediction for the 2001 Exercise scores. Only 37% of departments received the correct score with 22% predicted higher scores and 41% predicted lower scores than were actually received.
However, as Holmes and Oppenheim (2001) point out, “it must be stressed that there is no particular reason why the 2001 distribution of scores should be similar to that for the 1996 Research Assessment Exercise (Holmes & Oppenheim 2001). This being the case, the second prediction method uses system of attainment targets rather than fixed score quotas.
In method two, using the mean number of citations per department per Research Assessment Exercise score group (as seen in Table 6), the midpoint between each mean was found (the mean of two adjacent means), providing citation-range limits by which to separate the departments into specific Research Assessment Exercise score groups: x=a+b/2, e.g., (mean of 5* plus mean of 5) /2 = (148 + 88.08) / 2 = 118.04.
These calculations give the ranges shown in Table 15 below:
| Research Assessment Exercise score | Citation range |
|---|---|
| 5* | 118+ |
| 5 | 72-117 |
| 4 | 34-71 |
| 3a | 10-33 |
| 3b | 6-9 |
| 2 | 2-5 |
| 1 | 0-1 |
The predicted scores were accurate in 36% of cases, with 17% of departments having higher predicted scores and 47% having lower lower scores than those actually received in the 2001 Exercise.
Both systems require fixed markers, either in the form of group sizes or the number of citation counts needed to attain a certain score. Of these, the second is nearer to the the 2001 Exercise system as it allows all departments to gain the highest score simultaneously, should they each have the number of citations needed. However, the setting of the count-ranges could be seen to be an arbitrary process, as in this example. Potentially, this could lead to a change in research behaviour as departments chase citations, given that 'a performance indicator immediately becomes a performance objective especially if money is involved' (Lewis 2000: 372).
Another option would be the use of citation analysis as a part of peer assessment, giving a guide for each panel as to the relative standing of each department in terms of citation counts. Norris and Oppenheim recommend that citation counts 'should be adopted as the primary procedure for the initial ranking of university departments' (Norris & Oppenheim 2003: 728). However, with such divergent results as seen clearly in the scatterplot (Figure 2 above), it is likely that if this was used in practice with the current data set (in the subject of music at least), it would serve only to add a further layer to the Assessment process, adding complications and expense.
However, despite shortcomings such as those detailed above, the correlations shown are strong enough to suggest that, with a more comprehensive data set, citation counts could yet prove to show an even stronger correlation with Research Assessment Exercise scores and, therefore, be more useful in research assessment.
Contrary to the null hypothesis posited at the outset, a strong correlation was in fact found between citation count totals at departmental level and the Assessment scores awarded to the departments. This result demonstrates once again that citation counts could be a surrogate for peer review, even in the most unlikely of subject areas. The correlation test results themselves compare favourably with previous citation-based research carried out in different subject areas by Thomas and Watkins (1998), Smith and Eysenck (2002) and Norris and Oppenheim (2003), amongst others.
However, the correlation test results hide specific details in the data, especially where the range of departmental citation count totals in any given Research Assessment Exercise score group shows a large overlap with other score groups. Therefore, these counts must be used with caution in the assessment of research quality and could not be used alone to assign quality-related scores in subjects such as music. Indeed, this method does not show itself to give a rational assessment of research quality as compared to the peer review process of the Research Assessment Exercise.
Despite the strong correlations we obtained, it is also clear that the coverage of the Arts and Humanities Citation Index is unrepresentative of music research. A significant proportion of music research output has little or no representation in the Index, which, therefore, gives a partial view of music research. This is partly because of the choice of journals indexed and the fact that all other materials, most notably books, are excluded as sources. Therefore, even if citation counts were adopted as part of a system for evaluating the quality of music research, the Index should not be used as the sole data source.
The method and data source used in this study under-represent a very large proportion of the studied population in terms of citations. Moreover, many authors cannot participate in the citing process because of the nature of their (often practical) work. Thus, it is highly likely that, if used as presented in this study, citation analysis would not gain widespread acceptance amongst the assessed as a tool for research assessment. High correlations alone are not enough. Academics need to have confidence in the evaluation process.
However, if an alternative data source could be found that is more representative of the subject area, there is potential for the use of citation analysis in research assessment in music.
It is suggested to those involved in the administration of the Research Assessment Exercise that a similar study should be carried out to assess the correlation between citation counts and the scores for the 2008 Exercise. This would provide further evidence as to whether citation analysis could become a useful part of the metrics proposed for the humanities in general (and music specifically).
It is recommended that future research should include investigation of:
We wish to thank Lizzie Gadd for her help in drafting this paper, the three music academics who informed the discussion and the two anonymous referees for their insightful comments. One of us (MS) also wishes to thank the Arts and Humanities Research Council for a scholarship.
1. Part V is (Norris & Oppenheim 2003).
| Find other papers on this subject | ||
© the authors 2008. Last updated: 7 June, 2008 |
|