Prediction of the high-cost normalised discounted cumulative gain (nDCG) measure in information retrieval evaluation
Sinyinda Muwanei, Sri Devi Ravana, Wai Lam Hoo, and Douglas Kunda
Introduction. Information retrieval systems are vital to meeting daily information needs of users. The effectiveness of these systems has often been evaluated using the test collections approach, despite the high evaluation costs of this approach. Recent methods have been proposed that reduce evaluation costs through the prediction of information retrieval performance measures at the higher cut-off depths using other measures computed at the lower cut-off depths. The purpose of this paper is to propose two methods that addresses the challenge of accurately predicting the normalised discounted cumulative gain (nDCG) measure.
Method. Data from selected test collections of the Text REtrieval Conference was used. The proposed methods employ the gradient boosting and linear regression models trained with topic scores of measures partitioned by TREC Tracks.
Analysis. To evaluate the proposed methods, the coefficient of determination, Kendall's tau and Spearman correlations were used.
Results. The proposed methods provide better predictions of the nDCG measure at the higher cut-off depths while using other measures computed at the lower cut-off depths.
Conclusions. These proposed methods have shown improvement in the predictions of the nDCG measure while reducing the evaluation costs.
DOI: https://doi.org/10.47989/irpaper928
Introduction
People from all walks of life have different information needs. Meeting these information needs is the primary concern of information retrieval systems. A user with an information need formulates a query and submits it to an information retrieval system. Upon receipt of the query, the system produces a ranked list of documents that meets the information need of the user as expressed in the query. An effective retrieval system should return relevant documents ranked highly in the result list and through evaluation of these results, the effectiveness of retrieval systems is determined. Research on the evaluation of information retrieval systems has been carried out since the 1960s and the oldest method, which is still the de facto standard, is the test collection-based evaluation.
A test collection is comprised of a collection of documents, the user needs which are formulated as queries (topics), and the relevance judgments. The relevance judgments are contained in a query relevance file containing the names of topics and the names of documents associated with each topic. Any new retrieval system uses the queries in the test collections and returns the list of documents. The returned list is compared with the entries in the query relevance file and the effectiveness score of the new system is determined using performance measures including precision, recall, binary preference, and the normalised discounted cumulative gain (nDCG). Despite being the de-facto standard for evaluating retrieval systems, the test collection model has many challenges. Some of the challenges arise from the method of pooling used to create test collections. In the pooling method, only a subset of documents in the entire corpus is considered during the identification of relevance judgments by assessors. The usage of these subsets of documents leads to incomplete and biased relevance judgments. Normally in large collections, there can be millions of documents and it is not possible for human assessors to scrutinize all documents for relevance to the topics in the collection. In addition, the generation of relevance judgments is costly and time-consuming.
There are several notable lines of research that address some of the challenges of the test collection model, including the generation of relevance judgments without human assessors (Aslam and Yilmaz, 2007; Rajagopal et al., 2014), evaluation using the subset of topics (Hosseini et al., 2012; Roitero et al., 2020) and methods that ensure reliable evaluation (Hosseini et al., 2011; Sanderson and Zobel, 2005). A more recent line of research has been the investigation of methods that predict performance measures. A study by Gupta et al. (2019) introduced a method that uses linear regression to predict performance measures at higher cut-off depths using system scores of other measures computed at lower cut-off depth (d). The authors referred to performance measures computed at depths of at least 100 (i.e., d >= 100) as high-cost performance measures. Conversely, the performance measures computed at evaluation depths d < 100 were referred to as low-cost performance measures and our study adopts this form of naming. The authors also showed that their method achieved accurate predictions of the high-cost rank biased precision (RBP) measure using low-cost performance measures computed at the cut-off depth d = 30 documents. However, at the same cut-off depth d = 30 documents for the low-cost performance measures, the existing method demonstrated low accuracy for the prediction of the high-cost nDCG performance measure (Gupta et al., 2019). Therefore, this study bridges the gap by proposing two methods that employ the ensemble machine learning models trained with topic scores of performance measures. Like previous research, the focus is the ranked correlations of the predictions of the high-cost nDCG performance measure. These proposed methods provide better predictions of the high-cost nDCG measure compared to the existing method.
Consequently. this study has two contributions:
- A method that predicts the high-cost nDCG measure by employing the gradient boosting model to form a voting ensemble trained with topic scores of performance measures partitioned by Text REtrieval Conference (TREC)Web and Robust tracks.
- A method that predicts the high-cost nDCG measure by employing linear regression for both feature selection and creation of a voting ensemble trained with topic scores of performance measures partitioned by Text REtrieval Conference (TREC) Web and Robust tracks.
The rest of the paper proceeds as follows: the following section presents the related work, and the remaining sections present the method, the results and discussion, and the conclusion.
Related work
A number of previous studies have proposed various methods to lower costs of test collection-based information retrieval evaluation. These encompass methods that lower information retrieval evaluation costs through inference of relevance judgments (Aslam and Yilmaz, 2007; Büttcher et al., 2007; Makary et al., 2016a, 2016b, 2017; Rajagopal et al., 2014), methods for identifying the number of topics (Carterette et al., 2008; Sakai, 2016, 2014, 2018; Webber et al., 2008), methods for finding documents that should be judged (Carterette and Allan, 2005; Carterette et al., 2006; Cormack et al., 1998; Losada et al., 2017; Zobel, 1998), and methods for topic selection (Berto et al., 2013; Carterette et al., 2008; Guiver et al., 2009; Hosseini et al., 2012; Kutlu et al., 2018; Roitero et al., 2020). The study by Moghadasi et al. (2013) provides a more detailed review of some of these proposed methods.
The studies of relevance to our research are those that investigated the prediction or inference of performance measures in information retrieval evaluation. The inference of evaluation measures which required a corresponding retrieved ranked was proposed by Aslam et al. (2005). The authors concluded that user-oriented measures such as precision can be inferred from system-oriented measures such as average precision and R-precision. In another study, Yilmaz and Aslam (2008) introduced a method that inferred average precision measure that accurately estimates average precision when judgements are not complete. An exponential smoothing estimation method was proposed by Ravana et al. (2009) where the result of a previous information retrieval evaluation experiment is combined with a new observation in order to estimate a system score which is reliable. In similar study, Shuxiang and Ravana (2016) proposed a technique that predicts the reliability of the retrieval system effectiveness rank in a list of ranked systems based on its performance in previous experiments. By using this technique, the authors were able to predict the performance of each retrieval system in future experiments.
Unlike previous studies on the predictions of evaluation metrics that either required a ranked list (Aslam et al., 2005) or previous results (Ravana et al., 2009; Shuxiang and Ravana, 2016) to predict more reliable rankings, Gupta et al. (2019) proposed a method that predicts the high-cost performance measures while employing the low-cost performance measures computed at the cut-off depths d ≤ 50 documents.
This demonstrates a completely different way of performing predictions compared to previous work and is less reliant on the use of relevance judgments. It therefore leads to a further minimization of the costs of performing retrieval evaluations. However, the authors demonstrated that only the high-cost ranked bias precision (RBP) measure was accurately predicted at cut-off depth d = 30 of low-cost measures. The analysis of their results revealed that they had low predictions of the high-cost nDCG measure especially when the cut-off depth for the high-cost measured greater than 100 documents. Therefore, our research bridges this gap by proposing methods of predicting the high-cost nDCG measure by employing machine learning voting ensembles trained on partitioned data from TREC Web and Robust tracks.
Research method
The method is outlined in the following steps: data collection of runs and relevance judgements from selected TREC Web and Robust tracks of test collections, dataset creation, and the proposal of the high-cost nDCG measure prediction methods.
Data collection
This study used data comprised of relevance judgments and runs from selected TREC Web and Robust tracks of test collections. The National Institute of Standards and Technology organises these TREC workshops that focus on particular research area or track. The specific test collections used for this study are TREC 2000 Web Track (Hawking and Craswell, 2001), TREC 2001 Web Track (Hawking and Craswell, 2002), TREC 2004 Robust Track (Voorhees, 2004), TREC 2013 Web Track (Collins-Thompson et al., 2013) and TREC 2014 Web Track (Collins-Thompson et al., 2015). For each of these TREC Web and Robust Tracks, all the topics were used when computing performance measures.
Dataset creation
The datasets used in this research were created by first computing the performance measures by topics at various cut-off depths in the TREC Web and Robust Tracks. In this study, features are performance measures computed at the cut-off depths ranging from d = 10 to d = 30 while the high-cost nDCG measure was computed up to the cut-off depths d = 100 and d = 1000. The performance measures used in this study are: precision (Manning et al., 2008), inferred average precision (Yilmaz and Aslam, 2008), expected reciprocal rank (Chapelle et al., 2009), binary preference (Buckley and Voorhees, 2004), nDCG (Järvelin and Kekäläinen, 2002) and rank biased precision (Moffat and Zobel, 2008). The choice of these listed measures was motivated by their usage in previous related research by Gupta et al. (2019). Following the computations of performance measures, three datasets were generated, namely, the topic-wise training set, TREC 2013 and TREC 2014 test sets. The training set comprises computed topic scores of high-cost and low-cost performance measures from TREC 2000, 2001 Web Tracks and TREC 2004 Robust Track. In addition, 80 per cent of topic scores of performance measures from TREC 2013 and 2014 Web Tracks were included in the training set. Test sets comprised 20 per cent of topic scores of performance measures from TREC 2013 and 2014 Web Tracks.
The normalised discounted cumulative gain (nDCG) performance measure
We have noted that recent research investigated the prediction of several high-cost performance retrieval measures while using the low-cost ones. Among these high-cost performance measures was the normalised discounted cumulative gain. This high-cost performance measure is the focus in our investigation largely because recent research reported weak to moderate correlations of its predictions. The nDCG performance measure is defined using expression (1) below.
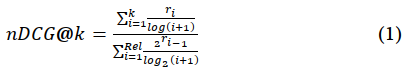
where k is the evaluation depth, i is the rank and r is the relevant document at rank i. This performance measure was introduced in order to have sensitivity to rank (Järvelin and Kekäläinen, 2002) which is critical in the results of retrieval evaluations. Prior to its introduction, performance metrics such as precision and recall that were employed in retrieval evaluations were not sensitive to the rank at which the relevant documents were found. Since users scan the results of retrieval systems from the top of the ranked list, this performance measure weighs the utility of a relevant document with respect to its rank in the ranked list. The lower a document is ranked in the list, the less useful it becomes. Therefore, it is a vital performance measure in retrieval evaluation and our ability to obtain the ranked correlations of its predictions will potentially be very useful in retrieval evaluation.
Proposed methods
This study proposes two methods of predicting the high-cost nDCG measure. Both methods employ machine learning ensemble algorithms to perform predictions. Machine learning ensemble algorithms are especially used in cases where the high accuracy of prediction is a requirement.
Boosting high-cost nDCG measure prediction method
This study proposes the boosting high-cost nDCG measure prediction method. This method has two assumptions: 1) Values of performance measures are assumed to have distributions based on the TREC Web and Robust Tracks from which they were drawn. This assumption is justified since the TREC Web and Robust Tracks selected for this study were from different years and generated by different source systems. 2) TREC generated data require nDCG prediction algorithms that do not employ strong learners. This assumption is because the study by Gupta et al. (2019) employed strong learners and best subsets of features, yet the predictive accuracy of the high-cost nDCG measure was low when the low-cost measures were computed till the cut-off depth d = 30. The steps taken to predict the high-cost nDCG measure through the boosting high-cost nDCG measure prediction method are:
- Choose the depth of the high-cost nDCG measure to predict.
- Partition the training set horizontally by TREC Web and Robust Tracks.
- Choose the cut-off depth of low-cost measures.
- Train one gradient boosting model per partition generated from step (2).
- Use gradient boosting models from (4) to create voting ensemble.
- Use voting ensemble from (5) to perform predictions on test sets.
- If the depth (i.e., for low-cost measures) d >= 30 exit method, else go to (3) to choose the next depth.
In this method, the high-cost nDCG measure can be predicted at the cut-off depths d = 100 or d = 1000. This proposed method divides the training set into partitions based on TREC Web and Robust Tracks. Since the training set of this study has five TREC Web and Robust Tracks as explained above, this proposed method generates five partitions. Additionally, in an iterative fashion, the method selects a cut-off depth for the low-cost performance measures, followed by training a gradient boosting model per partition of the training set. Using each gradient boosting model for each partition, a voting ensemble is created and used to make predictions on the test sets. These steps are repeated for cut-off depths ranging from d = 10 to d = 30 of low-cost performance measures.
Regression high-cost nDCG measure prediction method
This study also proposes the regression high-cost measure prediction method which has one assumption: 1) Values of performance measures are assumed to have distributions based on the TREC Web and Robust Tracks from which they were drawn. This assumption is justified since the TREC Web and Robust Tracks selected for this study were from different years and generated by different source systems.
The steps taken to predict the high-cost nDCG measure through the regression high-cost nDCG measure prediction method are:
- Choose the depth of high-cost nDCG measure to predict.
- Choose the cut-off depth of low-cost measures.
- Use linear regression and the power set of the training set to select the best features.
- Partition the training set horizontally by TREC Web and Robust Tracks.
- Train one linear regression model per partition generated from step (4).
- Use linear regression models from (5) to create a voting ensemble.
- Use voting ensemble from (6) to perform predictions on test sets.
If the cut-off depth (i.e., for low-cost measures) d >= 30 exit method, go to (2) to choose the next depth. For this method, the high-cost nDCG measure can be predicted at the cut-off depths d = 100 or d = 1000. The cut-off depth for the low-cost performance measures is then chosen followed by the selection of best features. These features are selected using linear regression and the power set of the training set. Then follows the division of the training set into partitions based on TREC Web and Robust Tracks. Since the training set of this study has five TREC Web and Robust Tracks, this proposed method generates five partitions. Next follows the training of a linear regression model per partition of the training set and using each linear regression model for the partitions, create a voting ensemble that is used to make predictions on the test sets. These steps are repeated for cut-off depths ranging from d = 10 to d = 30 of low-cost performance measures. The implementations of both methods were conducted using Python 3.6 and the scikit-learn package.
Performance analysis
In this section, the coefficients of correlation for evaluating the results of the proposed methods are presented. Since the focus of the proposed methods are the ranked correlations of the predictions of the high-cost performance measures, the ranked correlation coefficients are best suited to evaluate the results. In order to compare with the Kendall’s tau correlation results reported in Gupta et al. (2019), this study also employed the Kendall’s tau correlation coefficient. In addition, the Spearman correlation coefficient was also employed, and the use of both correlation coefficients was to check for consistency in the reported results. These correlation coefficients measure the ranking similarity between the predicted high-cost nDCG performance measures with the actual computed high-cost nDCG performance measures in the test sets. The Kendall’s tau correlation coefficient is defined in equation (2):
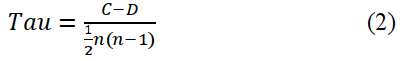
Where C is the number of concordant pairs which means they are ranked in the same order while D is the number of discordant pairs, and n represents the number of instances in the test sets. The Spearman’s rank correlation coefficient is defined in equation (3):
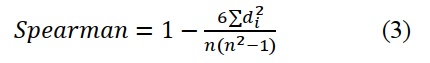
Where di is the distance between two corresponding items in two ranked lists and n is the number of corresponding items in the ranked list. In our case, the first ranked list comprises the actual topic scores of the high-cost nDCG performance measures computed using the function representing the nDCG performance measure while the second ranked list comprises the predicted values of the high-cost nDCG performance measure.
Results and discussion
This section presents results and discussion of the two proposed methods that predict the high-cost nDCG measure at the cut-off depths d = 100 and d = 1000. The features are low-cost performance measures computed at cut-off depths ranging from d = 10 to d = 30. In addition, the discussion includes a comparison of the proposed methods with previous research. In this study, the Kendall’s tau and Spearman correlation metrics measure how the predicted rankings of the proposed methods compare with the actual rankings of the high-cost nDCG measure in the test sets. Furthermore, the coefficient of determination shows the accuracy of the predictions of the values of the high-cost nDCG measure for the proposed methods.
Figure 1 presents Kendall's tau and Spearman correlations of the proposed methods for the prediction of nDCG@1000. The features are performance measures computed at the cut-off depths ranging from d = 10 to d = 30.
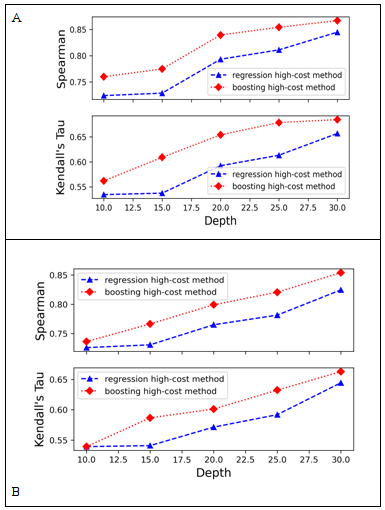
Figure 1: Kendall’s tau and Spearman correlation values of methods for prediction of nDCG@1000
(Note: Test data set A was generated using TREC 2013 Web Tack. Test data set B was generated using TREC 2014 Web Track.)
Figure 1 displays the results of Kendall's tau and Spearman correlations for the proposed methods that predict nDCG@1000 using the test datasets generated from TREC 2013 and TREC 2014 data. Figure 1(A) illustrates results for TREC 2013 test data, while Figure 1(B) illustrates results for TREC 2014 test data. In both cases, features were a collection of performance measures computed at the cut-off depths ranging from d = 10 to d = 30. In Figure 1(A), the result shows that the proposed boosting high-cost measure prediction method performed better than the proposed regression high-cost measure prediction method. The observed better performance was on all the cut-off depths at which the features were computed. For example, at the cut-off depth d = 20, the boosting high-cost measure prediction method’s Kendall's tau and Spearman correlation values were higher by 10.43 per cent and 5.83 per cent respectively. At the cut-off depth d = 30, the boosting high-cost measure prediction method’s Kendall's tau and Spearman correlations were higher by 4.21 per cent and 2.61 per cent respectively. Likewise, Figure 1(B) shows that at the cut-off depth d = 15, Kendall's tau and Spearman correlations of the boosting high-cost measure prediction method were higher by 8.44 per cent and 4.89 per cent respectively, while at the cut-off depth d = 30 its Kendall's tau and Spearman correlations were higher by 2.85 per cent and 3.59 per cent respectively.
A detailed examination of results obtained by Gupta et al. (2019), reveals that with respect to the prediction of the nDCG measure at the high-cost depth d = 1000, our proposed methods are both superior to the prediction method introduced by Gupta et al. on all cut-off depths at which features were computed. For example, at the cut-off depth d = 10, Kendall’s tau for the proposed regression high-cost prediction method was superior by approximately 27. 23 per cent on the TREC 2013 test data and 19.86 per cent on the TREC 2014 test data. Table 1 displays the values of the coefficient of determination after the prediction of nDCG@1000 by the proposed methods using test data sets generated from TREC 2013 and TREC 2014 Web Track data.
| Method | Depth | R-Squared-TREC 2013 | R-Squared-TREC 2014 |
|---|---|---|---|
| Boosting high-cost | 10 | 0.56 | 0.41 |
| 15 | 0.61 | 0.47 | |
| 20 | 0.67 | 0.62 | |
| 25 | 0.71 | 0.71 | |
| 30 | 0.77 | 0.75 | |
| Regression high-cost | 10 | 0.33 | 0.16 |
| 15 | 0.41 | 0.3 | |
| 20 | 0.59 | 0.53 | |
| 25 | 0.62 | 0.57 | |
| 30 | 0.7 | 0.69 |
The results shown in Table 1 highlight the superiority of the accuracy of prediction of the boosting high-cost prediction method over the proposed regression high-cost prediction method on all the cut-off depths at which features were computed. For example, at the cut-off depth d = 30, the coefficient of determination for the proposed boosting high-cost method was higher by above 10 per cent on TREC 2013 test data. Additionally, the coefficient of determination increases with the increase in the cut-off depths at which the features were computed for both methods.
Figure 2 shows Kendall's tau and Spearman correlations of the proposed methods for the prediction of nDCG@100. The features are performance measures computed at the cut-off depths ranging from d = 10 to d = 30.
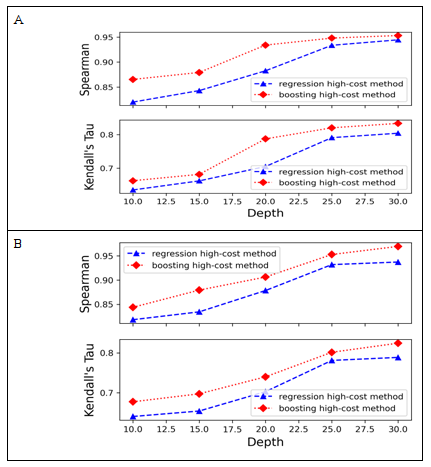
Figure 2: Kendall’s Tau and Spearman Correlation Values of Methods for Prediction of nDCG@100.
Note: Test data set A was generated using TREC 2013 Web Tack. Test data set B was generated using TREC 2014 Web Track.
Figure 2 displays the results of Kendall's tau and Spearman correlations for the proposed methods that predict nDCG@100 using the test datasets generated from TREC 2013 and TREC 2014 data. Figure 2(A) highlights results for TREC 2013 data, while Figure 2(B) highlights results for TREC 2014 data. In both cases, features were measures computed at the cut-off depths d ≤ 30. In Figure 2(A), the result shows that the proposed boosting high-cost measure prediction method performed better than the proposed regression high-cost measure prediction method. The observed superior performance was on all the cut-off depths at which the features were computed. For example, at the cut-off depth d = 20, the boosting high-cost measure prediction method’s Kendall's tau and Spearman correlation values were higher by 11.69 per cent and 5.82 per cent respectively. Figure 2(B) shows that at the cut-off depth d = 15, Kendall's tau and Spearman correlations of the boosting high-cost measure prediction method were higher by 6.61 per cent and 5.38 per cent respectively, while at the cut-off depth of 30 its Kendall's tau and Spearman correlations were higher by 3.64 per cent and 0.91 per cent respectively.
A close inspection of results obtained by Gupta et al. (2019), reveals that with respect to the prediction of the nDCG measure at the high-cost depth d = 100, the proposed regression high-cost prediction method is superior to the prediction method proposed by Gupta et al.in lowest depths only at which features were computed. As the cut-off depths for the features approach d = 30, the performance of the two methods is similar. However, the proposed boosting high-cost prediction method performs best on both test sets. For example, at the cut-off depth d = 30, Kendall’s tau for the proposed boosting high-cost prediction method was superior by approximately 4.53 per cent on the TREC 2013 test data and 3.45 per cent on the TREC 2014 test data.
| Method | Depth | R-Squared-TREC 2013 | R-Squared-TREC 2014 |
|---|---|---|---|
| Boosting high-cost | 10 | 0.60 | 0.48 |
| 15 | 0.68 | 0.51 | |
| 20 | 0.81 | 0.73 | |
| 25 | 0.91 | 0.88 | |
| 30 | 0.91 | 0.93 | |
| Regression high-cost | 10 | 0.53 | 0.32 |
| 15 | 0.63 | 0.47 | |
| 20 | 0.78 | 0.71 | |
| 25 | 0.88 | 0.87 | |
| 30 | 0.89 | 0.88 |
A close inspection of the results shown in Table 2 demonstrates the supremacy of the accuracy of prediction of the boosting high-cost prediction method over the proposed regression high-cost prediction method on all the cut-off depths at which features were computed. For example, at the cut-off depth d = 30, the coefficient of determination for the proposed boosting high-cost method was higher by above 6.46 per cent on TREC 2014 test data. Also, the coefficient of determination increases with the increase in the cut-off depths at which the features were computed for both methods.
Since the results have been presented above, the remainder of this section is devoted to discussing the findings. Recall that the problem being addressed is the reduction of costs of evaluating retrieval systems by proposing methods of predicting the high-cost nDCG performance measures while ensuring better ranked correlations of predictions when compared with the existing methods. In the proposed methods, topic scores were employed, in contrast to the existing method which used the system scores of performance measures. The use of topic scores gives advantage to the proposed methods because (to start with), system scores are obtained by averaging topic scores and this operation of averaging means that there is some error incurred during the process of obtaining system scores. Additionally, more error is incurred for the existing method during the predictions of the high-cost performance measures. However, for the proposed methods, since topic scores are employed, the methods largely suffer from error only during predictions. Therefore, we suggest that this has partly led to the proposed methods to produce better ranked correlations in some cut-off depths of the low-cost performance measures.
The proposed methods both implemented the voting ensembles, and it is clear from the presented steps of both methods that some topic scores of performance measures computed from each of the test collections was utilized in at least one of the ensemble models. This is in contrast to the existing method where topic scores of performance measures from particular test collections were used sorely for the training or predictions during testing. The utilization of the topic scores in a manner observed from the existing methods may lead to inaccuracies of results especially where the data set shifts occur in topic scores of performance measures computed from various test collections. However, the usage of voting ensembles as demonstrated by the proposed methods reduces the occurrence of data set shifts in topic scores of performance measures and leads to better predictive methods of the high-cost performance measures.
The results presented above lead to several important conclusions. Other than combining scores of performance measures from the different TREC Web and Robust Tracks to form one training set and training machine learning models on it, models can be trained on different TREC Web and Robust Tracks separately (as in our case where the training was conducted on partitions) and a voting ensemble could then be created that provides the result of the prediction. This has proved more effective than the proposal by Gupta et al. (2019). Secondly, it is clear that with respect to predictions of the high-cost nDCG measure that the non-linear machine learning models with weak learners achieve higher prediction accuracy of values of the high-cost nDCG measure than machine learning models with strong learners. Gupta et al. reported that not only did they employ linear regression in their study, but support vector machines on the feature subsets provided the highest predictions. They also stated that they did not report results for the support vector machines because the performance was similar to the results of the linear regression-based method. Support vector machines are in themselves very strong learners. The gradient boosting model (which by design has weak learners) was employed in one of the proposed methods for this research and it demonstrated very superior prediction accuracy than the linear regression-based methods. This also suggests that the use of machine learning models that reduce bias (e.g., gradient boosting) during the model training phase tends to perform better.
Conclusion
This study aimed to address the challenge of the cost of generating relevance judgments that has been a long-standing problem in information retrieval research with a focus on the prediction of the high-cost nDCG performance measure. It also reported the findings of existing research which has shown that the high-cost nDCG performance measure had been inaccurately predicted in the case when the performance measures that play the role of features were computed using cut-off depths of at most thirty documents. Hence, with the sole purpose of addressing this limitation in existing research, this study proposed two methods for the prediction of the high-cost nDCG performance measure. Unlike previous research (Gupta et al., 2019), these methods employ topic scores of performance measures and voting ensembles of linear and nonlinear regression models. By employing topic scores and the voting ensembles, this study has shown that there are moderate to strong ranked correlations of the predictions of the high-cost nDCG measure even in the case when the performance measures that play the role of features were computed at the cut-off depths of at most thirty documents. For these methods of predictions, the relevance judgments are largely used at the low cut-off depths of documents. However, at the high cut off depths, the values of the high-cost nDCG measures are obtained through predictions only. Therefore, the use of relevance judgments is minimized hence the reduction of the cost of generating relevance judgments. Despite the supremacy of the proposed methods to existing research, there are several interesting directions for future work. First, since only the voting ensemble was applied to both methods, other machine learning ensembles or deep neural networks could be attempted. In addition, instead of the usage of all the topics in the datasets, topics could be selected either based on topic difficulty or any existing topic selection methods. Also, more performance measures could be added to the set of features and other test collections may also be used.
Acknowledgements
This research work has been supported by Ministry of Higher Education under the Fundamental Research Grant Scheme (FRGS/1/2020/ICT06/UM/02/1) and the University of Malaya RU Grant GPF098C-2020.
About the authors
Sinyinda Muwanei received his BSc and MSc degrees in Engineering and Technology specializing in Systems Analysis and Control from Saint Petersburg State Polytechnical University, Russia, and Master of Business Administration from Amity University, India. He is a PhD candidate at the University of Malaya in Malaysia. His research interests include information retrieval, distributed systems and artificial intelligence. He can be contacted at: smuwanei@gmail.com
Sri Devi Ravana received her Ph.D from The University of Melbourne, Australia, in 2012. She is currently an Associate Professor at the Department of Information Systems, University of Malaya. Her research interests include information retrieval heuristics, text indexing and data analytics.She can be contacted at: sdevi@um.edu.my
Wai Lam Hoo is currently a senior lecturer in Department of Information Systems, Faculty of Computer Science and Information Technology, University of Malaya, Malaysia. He obtained his Ph.D in the same university, and his research interest includes computer vision, machine learning and data analytics. He can be contacted at: wlhoo@um.edu.my
Douglas Kunda is an Associate Professor in Software Engineering and founding Dean of the School of Science, Engineering and Technology, Mulungushi University, Zambia. He obtained his Ph.D in Computer Science from the University of York, UK. His research interest includes software engineering, artificial intelligence, component-based software engineering, internet of things, machine learning and data mining. He can be contacted at: dkunda@mu.ac.zm
References
Note: A link from the title, or from (Internet Archive) is to an open access document. A link from the DOI is to the publisher's page for the document.
- Aslam, J. A., & Yilmaz, E. (2007). Inferring document relevance from incomplete information. In CIKM ’07: Proceedings of the Sixteenth ACM Conference on Conference on Information and Knowledge Management, Lisbon, Portugal, November 6-10, 2007 (pp. 633–642). Association for Computing Machinery. https://doi.org/10.1145/1321440.1321529
- Aslam, J. A., Yilmaz, E., & Pavlu, V. (2005). A geometric interpretation of r-precision and its correlation with average precision. In SIGIR ’05:Proceedings of the 28th Annual International ACM SIGIR Conference on Research and Development in Information Retrieval, Salvador, Brazil, August 15-19, 2005 (pp. 573-574). Association for Computing Machinery.https://doi.org/10.1145/1076034.1076134
- Berto, A., Mizzaro, S., & Robertson, S. (2013). On using fewer topics in information retrieval evaluations. In ICTIR '13: Proceedings of the 2013 Conference on the Theory of Information Retrieval, Copenhagen Denmark 29 September 2013- 2 October 2013 (pp. 30–37). Association for Computing Machinery. https://doi.org/10.1145/2499178.2499184
- Buckley, C., & EVoorhees, E. M. (2004). Retrieval evaluation with incomplete information. In SIGIR ’04: Proceedings of the 27th Annual International ACM Conference on Research and Development in Information Retrieval, Sheffield, United Kingdom, July 25-29, 2004 (pp. 25–32). Association for Computing Machinery. https://doi.org/10.1145/1008992.1009000
- Büttcher, S., Clarke, C. L. A., Yeung, P. C. K., & Soboroff, I. (2007). Reliable information retrieval evaluation with incomplete and biased judgements. In SIGIR ’07: Proceedings of the 30th Annual International ACM SIGIR Conference on Research and Development in Information Retrieval, Amsterdam, The Netherlands, July 23-27, 2007 (pp. 63–70). Association for Computing Machinery. https://doi.org/10.1145/1277741.1277755
- Carterette, B., & Allan, J. (2005). Incremental test collections. In CIKM’05: Proceedings of the 14th International Conference on Information and Knowledge Management, Bremen, Germany, 31 October-5 November, 2005 (pp. 680–687). Association for Computing Machinery. https://doi.org/10.1145/1099554.1099723
- Carterette, B., Allan, J., & Sitaraman, R. (2006). Minimal test collections for retrieval evaluation. In SIGIR’06: Proceedings of the 29th Annual International ACM SIGIR Conference on Research and Development in Information Retrieval, Seattle, Washington, USA, August 6-11, 2006 (pp. 268–275). Association for Computing Machinery. https://doi.org/10.1145/1148170.1148219
- Carterette, B., Pavlu, V., Kanoulas, E., Aslam, J. A., & Allan, J. (2008). Evaluation over thousands of queries. In SIGIR ‘08” Proceedings of the 31st Annual International ACM SIGIR Conference on Research and Development in Information Retrieval, Singapore July 20 - 24, 2008 (pp. 651–658). Association for Computing Machinery. https://doi.org/10.1145/1390334.1390445
- Chapelle, O., Metlzer, D., Zhang, Y., & Grinspan, P. (2009). Expected reciprocal rank for graded relevance. In CIKM ’09: Proceedings of the 18th ACM Conference on Information and Knowledge Management, Hong Kong, China, November 2-6, 2009 (pp. 621–630). Association for Computing Machinery. https://doi.org/10.1145/1645953.1646033
- Collins-Thompson, K., Bennett, P., Diaz, F., Clarke, C. L. A., & Voorhees, E. M. (2013). Overview of the TREC 2013 web track. In 22nd Text REtrieval Conference (TREC 2013) Proceedings, Gaithersburg, Maryland, USA, November 19-22, 2013. (15p.) National Institute of Standards and Technology. https://trec.nist.gov/pubs/trec22/trec2013.html (Internet Archive)
- Collins-Thompson, K., Macdonald, C., Bennett, P., Diaz, F., & Voorhees, E. M. (2015). TREC 2014 Web Track Overview. In Twenty-Third Text REtrieval Conference (TREC 2014) Proceedings,Gaithersburg, Maryland, USA, November 19-21, 2014 (21p.) National Institute of Standards and Technology https://trec.nist.gov/pubs/trec23/trec2014.html (Internet Archive)
- Cormack, G. V., Palmer, C. R., & Clarke, C. L. A. (1998). Efficient construction of large test collections. In SIGIR ’98:Proceedings of the 21st Annual International ACM SIGIR Conference on Research and Development in Information Retrieval, Melbourne, Australia, August 24-28, 1998 (pp. 282–289). Association for Computing Machinery. https://dl.acm.org/doi/10.1145/290941.291009
- Guiver, J., Mizzaro, S., & Robertson, S. (2009). A few good topics: experiments in topic set reduction for retrieval evaluation. ACM Transactions on Information Systems, 27(4), 1–26. https://doi.org/10.1145/1629096.1629099
- Gupta, S., Kutlu, M., Khetan, V., & Lease, M. (2019). Correlation, prediction and ranking of evaluation metrics in information retrieval. In L. Azzopardi, B. Stein, N. Fuhr, P. Mayr, C. Hauff, and D. Hiemstra (Eds.), 41st European Conference on IR Research, ECIR 2019, Cologne, Germany, April 14–18, 2019, Proceedings, Part I. Springer. https://doi.org/10.1007/978-3-030-15712-8_41
- Hawking, D. (2001). Overview of the TREC-9 web track. In Proceedings of the Ninth Text REtrieval Conference (TREC 9), Gaithersburg, Maryland, USA, November 13-16, 2000 (pp. 87–102). https://trec.nist.gov/pubs/trec9/t9_proceedings.html (Internet Archive)
- Hawking, D., & Craswell, N. (2002). Overview of the TREC-2001 web track. In The Tenth Text REtrieval Conference (TREC 2001), Gaithersburg, Maryland, USA, November 13-16, 2001 (pp. 61–67). https://trec.nist.gov/pubs/trec10/t10_proceedings.html (Internet Archive)
- Hosseini, M., Cox, I. J., Milić-Frayling, N., Shokouhi, M., & Yilmaz, E. (2012). An uncertainty-aware query selection model for evaluation of IR systems. In SIGIR ’12: Proceedings of the 35th International ACM SIGIR Conference on Research and Development in Information Retrieval, Portland, Oregon, USA, August 12-16, 2012. (pp. 901–910). Association for Computing Machinery. https://doi.org/10.1145/2348283.2348403
- Hosseini, M., Cox, I. J., Milic-Frayling, N., Sweeting, T., & Vinay, V. (2011). Prioritizing relevance judgments to improve the construction of IR test collections. In B. Berendt, A. de Vries, & W. Fan, (Eds.). CIKM ’11: Proceedings of the 20th ACM International Conference on Information and Knowledge Management, Glasgow, Scotland, UK, October 24-28, 2011 (pp. 641–646). Association for Computing Machinery. https://doi.org/10.1145/2063576.2063671
- Järvelin, K., & Kekäläinen, J. (2002). Cumulated gain-based evaluation of IR techniques. ACM Transactions on Information Systems, 20(4), 422–446. https://doi.org/10.1145/582415.582418
- Kutlu, M., Elsayed, T., & Lease, M. (2018). Intelligent topic selection for low-cost information retrieval evaluation: a new perspective on deep vs. shallow judging. Information Processing and Management, 54(1), 37–59. https://doi.org/10.1016/j.ipm.2017.09.002
- Losada, D. E., Parapar, J., & Barreiro, A. (2017). Multi-armed bandits for adjudicating documents in pooling-based evaluation of information retrieval systems. Information Processing and Management, 53(5), 1005–1025. https://doi.org/10.1016/j.ipm.2017.04.005
- Makary, M., Oakes, M., & Yamout, F. (2016a). Using key phrases as new queries in building relevance judgments automatically. In R. Krestel, D. Mottin, & E. Müller, (Eds.). Proceedings of the Conference"Lernen, Wissen, Daten, Analysen", Potsdam, Germany, September 12-14, 2016. (pp. 175–176). CEUR. http://ceur-ws.org/Vol-1670/paper-43.pdf (Internet Archive)
- Makary, M., Oakes, M., & Yamout, F. (2016b). Towards automatic generation of relevance judgments for a test collection. In Proceedings of the 11th International Conference on Digital Information Management (ICDIM), Porto, Portugal, September 19-21, 2016 (pp. 121–126). IEEE. https://doi.org/10.1109/ICDIM.2016.7829763
- Makary, M., Oakes, M., Mitkov, R, & Yammout, F. (2017). Using supervised machine learning to automatically build relevance judgments for a test collection. In A.M. Tjoa, & R.R. Wagner, (Eds.). Proceedings of the International Workshop on Database and Expert Systems Applications (DEXA), Lyon, France, 28-31 August, 2017 (pp. 108–112). IEEE. https://doi.org/10.1109/DEXA.2017.38
- Manning, C. D., Schütze, H., & Raghavan, P. (2008). Introduction to information retrieval. Cambridge University Press.
- Moffat, A. & Zobel, J. (2008). Rank-biased precision for measurement of retrieval effectiveness. ACM Transactions on Information Systems (TOIS), 27(1), 1–27. http://dl.acm.org/doi/10.1145/1416950.1416952
- Moghadasi, S. I., Ravana, S. D., & Raman, S. N. (2013). Low-cost evaluation techniques for information retrieval systems: a review. Journal of Informetrics, 7(2), 301–312. https://doi.org/10.1016/j.joi.2012.12.001
- Rajagopal, P., Ravana, S. D., & Ismail, M. A. (2014). Relevance judgments exclusive of human assessors in large scale information retrieval evaluation experimentation. Malaysian Journal of Computer Science, 27(2), 80–94.
- Ravana, S. D., Park, L. A., & Moffat, A. (2009). System scoring using partial prior information. In SIGIR ’08: Proceedings of the 32nd International ACM SIGIR Conference on Research and Development in Information Retrieval, Boston, MA, USA, July 19-23, 2009 (pp. 788-789). Association for Computing Machinery. https://doi.org/10.1145/1571941.1572129
- Roitero, K., Culpepper, J. S., Sanderson, M., Scholer, F., & Mizzaro, S. (2020). Fewer topics? A million topics? Both?! On topics subsets in test collections. Information Retrieval Journal, 23(1), 49–85. https://doi.org/10.1007/s10791-019-09357-w
- Sakai, T. (2016). Topic set size design. Information Retrieval Journal, 19(3), 256–283. https://doi.org/10.1007/s10791-015-9273-z
- Sakai, T. (2018). Topic set size design for paired and unpaired data. In ICTIR ’18: Proceedings of the 2018 ACM SIGIR International Conference on the Theory of Information Retrieval, Tianjin, China, September 14-17, 2018 (pp. 199–202). Association for Computing Machinery. https://doi.org/10.1145/3234944.3234971
- Sakai, T. (2014). Topic set size design with variance estimates from two-way ANOVA. In Proceedings of the Sixth International Workshop on Evaluating Information Access, EVIA 2014, National Center of Sciences, Tokyo, Japan, December 9, 2014. (pp. 1–8). National Institute of Informatics. http://research.nii.ac.jp/ntcir/workshop/OnlineProceedings11/pdf/EVIA/01-EVIA2014-SakaiT.pdf. (Internet Archive)
- Sanderson, M., & Zobel, J. (2005). Information retrieval system evaluation: effort, sensitivity, and reliability. In SIGIR ’05: Proceedings of the 28th Annual International ACM SIGIR Conference on Research and Development in Information Retrieval, Salvador, Brazil, August 15-19, 2005 (pp. 162–169). Association for Computing Machinery. https://doi.org/10.1145/1076034.1076064
- Shuxiang, Z., & Ravana, S. D. (2016). Estimating the reliability of the retrieval systems rankings. In Proceedings of the 1st International Conference on Software Networking, ICSN 2016, Jeju Island, Korean, May 23-26, 2016 (pp. 1-5). IEEE. https://doi.org/10.1109/ICSN.2016.7501924
- Voorhees, E. M. (2004). Overview of the TREC 2004 Robust Track. In Proceedings of the Thirteenth Text Retrieval Conference (TREC 2004). https://trec.nist.gov/pubs/trec13/t13_proceedings.html (Internet Archive)
- Webber, W., Moffat, A., & Zobel, J. (2008). Statistical power in retrieval experimentation. In CIKM ’08: Proceedings of the 17th International Conference on Information and Knowledge Management, Napa Valley, California, USA, October 26-30, 2008 (pp. 571–580). Association for Computing Machinery. https://doi.org/10.1145/1458082.1458158
- Yilmaz, E. & Aslam, J. A. (2008). Estimating average precision when judgments are incomplete. Knowledge and Information Systems, 16(2), 173–211. https://doi.org/10.1007/s10115-007-0101-7
- Zobel, J. (1998). How reliable are the results of large-scale information retrieval experiments? In SIGIR ’98: Proceedings of the 21st Annual International ACM SIGIR Conference on Research and Development in Information Retrieval , Melbourne, Australia, August 24-28, 1998 (pp. 307–314). Association for Computing Machinery. https://doi.org/10.1145/290941.291014