Changing taxpayers’ beliefs with information that enables to make sense of taxes: the case of Lithuania
Arūnas Gudinavičius
Introduction. Tax administrators employ various methods in order to influence taxpayers’ beliefs and behaviour, hoping to reduce tax evasion. The study seeks to identify how much detailed tax related information is required in order to affect the beliefs of taxpayers towards tax compliance.
Method. A nationwide representative survey was used to measure the respondents’ opinions formed when making sense of the three different information messages they were offered.
Analysis. Quantitative data was analysed with the help of the statistical package SPSS.
Results. Findings showed the potential value of including such sense making information for taxpayers’ feedback on paid and distributed taxes. We found that messages from State Tax Inspectorate detailing different information on taxes and examples of how these taxes could be spent, do make sense and affect respondents’ beliefs, however, not necessary in the direction the STI would want them to.
Conclusions. The findings of this study show that providing taxpayers with detailed and personalised information on taxes might also lead in an unwanted direction, as taxpayers might perceive personal information on taxes in a different way than the generalised information presented nationwide or even countywide.
DOI: https://doi.org/10.47989/irisic2019
Introduction
In the past decade various programs have been undertaken in order to influence taxpayer behaviour. Most of them strive to help taxpayers comply with the regulations and prevent tax evasion. However, it is much more important to understand what motivates tax compliance or evasion. According to the Organisation for Economic Cooperation and Development (2010), deterrence, widely known as traditional tool of tax administration, is important but not sufficient to explain the level of tax compliance and evasion in a society. Other factors are also important: personal and social norms, opportunities, fairness and trust in the tax administration, economic factors, and tax administrator’s interaction with the society.
Taxpayers comply with their tax obligations because they believe that this is fair behaviour and not because they are afraid of being punished (Wenzel, 2005). Tax compliance is strongly linked to personal and social standards, therefore personal norms and beliefs are difficult to influence. Efforts can be made to educate and inform taxpayers by emphasising the importance of tax compliance and developing positive personal norms. The effects of personal norms have long-term benefits for tax compliance. To minimize tax evasion, it is important for the tax administrator to understand the factors of equity and trust (OECD, 2010).
Taxpayers' distrust of tax administration increases tax avoidance (Murphy, 2004) and on the contrary, trust in the tax authorities increases tax compliance (Wintrobe and Gërxhani, 2004). Kirchler (2007) integrates his findings on tax compliance into a model based on the interaction climate between tax authorities and taxpayers. Building trust requires clear information of taxpayers on tax collection, emphasising the validity of the approach chosen. Proper taxpayers’ treatment by the tax administrator as well as understanding of the fairness of the tax system affects taxpayers’ personal and social norms and willingness to comply. Perceived tax evasion and social norms usually have strong link between them (Frey and Torgler, 2007). The appeals to social norms in order to affect the decisions of taxpayers on the tax compliance usually have modest, but positive impact (Alm, Schulze, Bose and Yan, 2019).
Surveys asking taxpayers how often they are searching for tax information or consult their tax administrator may reveal insights useful for the development of information services. However, this type of research usually addresses concrete issues (such as the frequency of visits to tax administrators’ website), but not fundamentally demanding questions on the processes which take place when individuals are trying to make sense of the information acquired.
By providing the actual amount of taxes paid and informing taxpayers how their taxes were allocated, tax administrators expect feedback to help people understand the importance of paying taxes and, ultimately, reduce tax evasion. It remains unclear, however, to what level the detailed information on paid and spent taxes should be submitted to taxpayers. Does exhaustive personal information about taxes lead taxpayers towards tax compliance? Or on the contrary – can it prompt the decision to try to minimize the amount of taxes paid? Does the detailed information on the exact services and goods that are paid for using taxpayers’ money encourage tax compliance or tax evasion? For example, Faruqui et al. (2010) discovered that information provided by In-Home Display reduced their consumption of electricity on average by about 7 percent. However, to what extent do taxpayers actually make sense of the information provided by tax administrators? Does the carefully designed and selected information about how taxes are paid and distributed lead to intentions to pay less taxes?
Latest statistics suggest that Lithuania ranks 25th among the 28 European Union countries in terms of tax revenue collection (Eurostat, 2019) and 6th among 31 European countries in size of the shadow economy ( Medina and Schneider, 2018). The European Commission report on Lithuania emphasised poor tax compliance and non-use of the broad tax base (Baltic News Service, 2020). Driven by these questions and expectations to increase awareness of the importance of tax compliance together with the State Tax Inspectorate (STI) under the Ministry of Finance of the Republic of Lithuania we initiated the research aimed at finding out how much detailed information about taxes is necessary to positively (towards tax compliance) affect the beliefs and intended behaviour of taxpayers. The aim of the study is to establish the impact that different levels of submitted information on the taxes paid and their possible distribution has on taxpayers’ beliefs. We suggest that providing feedback on taxes paid and distributed has the potential to allow contextualisation of tax usage and may also encourage taxpayers to become more interested in tax distribution outcomes. We employed the sense-making perspective as the idea that people try to understand the information they receive, to analyse how the information about taxes was perceived by a number of taxpayers.
Making sense of tax compliance
Informing tax payers and tax compliance
Utilisation of various ways of informing taxpayers on their taxes in order to improve tax collection requires research into the effectiveness of those measures, so that they could be adjusted. When surveying taxpayers in Ireland Doyle, Gallery and Coyle (2009) sent letters to the taxpayers who did not submit their returns. They found that letters with a gentle, helpful tone received the most response. More authoritative letters were less effective but still evoked greater response than the standard letter. All the respondents were more likely to contact the tax administrator than the control group which received no letter whatsoever. Another survey of attitudes and behaviour towards tax and compliance (Cleary, 2013) revealed that most people think that tax evaders chose to become such because of the prevailing tax evasion culture in the country and the feeling that they are paying too much. Efforts to inform taxpayers in the future were recommended.
Chetty and Saez (2013) conducted an experiment in the United States with two groups of tax credit recipients: one group received extra personalised information from their tax administrator and the other group received no additional information. They found that the effect on behaviour (clients’ earnings decisions) was significant. During another experiment (Coleman, 2007) carried out in the United States three types of letters were sent (the first type was informing of an increased audit probability; the second was an offer of enhanced assistance; and the third was the newsletter on the use of tax revenues for public services and social norms on paying taxes) to taxpayers ahead of the tax return filing deadline. The results showed that the threat of auditing increased voluntary compliance among low- and middle-income taxpayers, however the results varied among higher income taxpayers. The offer of additional assistance had no effect whatsoever. And the messages about the use of tax revenues and social norms had small but positive effect.
The experiment conducted in the United Kingdom (Behavioural Insights Team, 2012) included sending letters to taxpayers with tax arrears for the first time. The results revealed that payments increased from recipients which received letters mentioning social norms compared to recipients of control letters. Letters referring to local or city social norms were more effective than letters mentioning national social norms. Personalised messages with the taxpayer’s name were most effective, while those with debt size or just informational text had the least impact.
The tax authority in Sweden sent out briefings, dominating the role of taxes in financing public services and identifying the problems caused by the shadow economy. The survey results suggest that taxpayers’ attitudes and behaviour had improved during the campaign period (Skatteverket, 2005). The Italian tax agency also noticed the benefits of informing taxpayers by sending letters (to those whose tax returns had anomalies in previous years) a few months before filing their tax returns. This had a significant impact on taxpayer compliance (Pisani, 2014). Information and services provided by the tax administrator also had a positive impact on tax compliance in Poland (Alm, Cherry, Jones and McKee, 2010).
Summarising the experience of the countries reviewed, it can be stated that many tax administrators are looking for new ways (beside the traditional deterrent actions) to influence taxpayers by informing, educating, and strengthening mutual trust to improve tax collection. The above examples suggest that provision of such tax information could affect taxpayers’ beliefs and attitude. However, these experiments do not investigate how much detailed information about taxes should be provided in order for taxpayers to make sense of that information and achieve most effective results on changing taxpayers’ beliefs towards tax compliance.
Sense-making
The concept of sense-making is often used as theoretical point of view to cover the cognitive gap which individuals experience when trying to make sense of information they retrieved (Dervin, 1983, 1992) such as data provided by State Tax Inspectorate (STI) on taxes. According to Savolainen (2006), the ‘metaphor of gap‐bridging provides heuristic tools guiding the positioning of questions of how people seek, interpret, and design information.’
A sense-making concept assumes that any action of individual sense-making is not static, on the contrary, it assumes constant sense-makings (or un-makings) according to different contexts and uses (Dervin, 1999). Individuals constantly have to merge new knowledge derived from formal information sources with knowledge already acquired and their everyday experience (Kuhlthau, 1991). In other words, ‘sense-making involves the ongoing retrospective development of plausible images that rationalize what people are doing‘ (Weick, Sutcliffe and Obstfeld, 2005). The ever growing amount of information and the need to interact and make sense of that data have increased sense-making activity recently (Pirolli and Russell, 2011).
There are three components of sense-making (Dervin, 1999): situation, gap, and uses. The situation is described as the context of the user, the gap is an element which prevents from decision and action, and the use is the employment of the sense that is achieved. According to Sandberg and Tsoukas (2015), sense-making perspective consists of ‘specific episodes, ambiguous events, processes, outcomes, and situational factors’” Besides, the following processes of sense-making are distinguished: creation (trigger), interpretation (intervention), and enactment (change). The study mostly focuses on the interpretation process, i.e. how taxpayers interpret information submitted (triggered) to them by the tax administrator and how their beliefs change, which supposedly could be followed by their actions (changes). As our research places emphasis on opinion and belief formation (which might lead to attitude change), we suggest that the sense-making information received might lead to the change of taxpayers’ beliefs. Although, the Dervin sense-making methodology is not adopted in our study and the term sense-making is used in its most common meaning as the idea that people seek to understand or make sense of the information they receive.
Methodology
Research design
There are a lot of factors which could affect taxpayers’ beliefs and decisions. Walsh (2012) summarised them into six and we concentrated on one of them – framing, i.e. providing taxpayers with framed information on taxes. We believe that such framed information might help them understand the importance of tax compliance and change their beliefs in the preferred direction. As our objective was to increase fairness and trust between taxpayers and the tax administrator, we chose reciprocity as a principle of influence applied to taxpayers, which emphasises making sense of the benefits of tax compliance (Walsh, 2012).
Experimental design was behind the methodology for our research. When seeking for an effective and safe channel of submitting information to taxpayers, several surveys (above) designed to improve tax collection efficiency were summarised. The results showed that since the beginning of this century one of the key information channels has been traditional (printed) letters to taxpayers. No studies using online information channels have been identified. There are several reasons for this. Firstly, the lack of online channels for tax administrators to successfully reach taxpayers while maintaining data confidentiality. Secondly, the prevailing belief that communication of important information is more reliable and looks more serious when using traditional channels (mail) instead of modern ones (the Internet). And finally, limited use of online technology by taxpayers. Given the relatively high Internet usage in Lithuania and the disposition of a sufficient tried-and-tested online channel for the dissemination of information (Mano VMI, translation in English My State Tax Inspectorate (STI); https://vmi.lt/manovmi/) by Lithuanian tax authorities, this online channel for a taxpayer outreach experiment was used. At the end of 2016, My STI had 902 000 accounts.
My STI enables taxpayers to file tax returns, perform other online procedures as well as receive personal notifications from STI. When the STI sends a message, the taxpayer receives an email. Access to the My STI system is through secure electronic identification system, so the information sent remains safe and for private use only.
Selecting respondents
The study included taxpayers registered in the Lithuanian Taxpayer Register who have an account in My STI. A list of 12 000 respondents who agreed to participate in the study was submitted by the STI for field surveys. The list included names of potential respondents, their residential and email addresses. The standard significance level α = 0.05 (β = 95%) and error ∆ = ± 3% were used to determine the number of respondents required in each survey: at least 1 066 respondents.
As we had the addresses of respondents, we sorted them by place of residence (city, town or village) into equal groups. Using an algorithm which kept the same distribution in place of residency, respondents were randomly divided into control and exploratory groups and subgroups for each of the three stages of the study, resulting in six equal samples of 2,000. All respondents of the pilot survey and three main surveys were surveyed only once.
Survey
Based on the analysed examples, which successfully used the survey method, we also employed the survey to measure the respondents’ opinions when making sense of the information they were provided. According to the sense-making concept, sometimes the information which respondents use is seen as forwarding to useful outcomes and sometimes to non-useful outcomes (Dervin, 1999). Given that the information had been presented in three stages with different levels of personalisation each, three identical surveys were conducted. For the sake of simplicity and clarity of data processing, we used the Likert scale or Yes/No closed-ended questions. The survey was conducted in the official language (Lithuanian). In the course of the surveys answers were recorded using pen-and-paper only and later transferred into digital form. The number of visits to eligible respondents was at least two (if we were unable to find the respondent at home during the first visit).
On 13 August 2018, the first information message was sent to the exploratory group, (Figure 1). After two weeks, a survey of the exploratory group (N=1114; response rate RR=88.9%) and control group (N=1069; RR=76.7%) followed and was finished in five weeks. Surveying was conducted by a contractor market research company; all the processes were closely supervised. The second message (Figure 2) with information was sent on 21 November 2018 and the third (Figure 3) on 26 March 2019. Two more surveys were conducted accordingly: second with N=1 069 respondents with RR=85.5% in the exploratory and N=1 079 with RR=87.4% in the control group; third with N=1 087 respondents and RR=91.3% in the exploratory and N=1 069 with RR=86.4% in the control group. Not all initially selected respondents participated as we reached the minimal number of respondents required in each survey.
Comparison tests were conducted to determine the differences between the exploratory and control groups with each question in the questionnaire. When we had questions with ordinal-type data, we used descriptive statistics and the Mann-Whitney Test to determine whether two sets of opinions differed, using median differences to determine difference in data sets, and histogram mean when having different forms of histograms. When we had nominal-type data we used frequency distribution for the median and mode and the Chi-Square Independence Test to calculate the exact significance value p (Exact significance). These tests showed whether we can reject the null hypothesis (there is no difference between the test and control groups) and confirm the alternative (there is a difference then p <0.05, where 0.05 is our desired significance limit).
Information messages
Three types of messages were designed and sent using My STI online system to exploratory groups only. At stage one, the message (Figure 1) summarised the amount of personal income tax (PIT) collected nationwide (1.3 billion euros in 2017). We chose transport, education, land, and health as examples of how collected taxes could be used: how many kilometres of roads could be constructed, weapons could be purchased, etc. The text and illustrations in the message depicted what could be done for the common good over personal income tax paid by taxpayers nationwide.
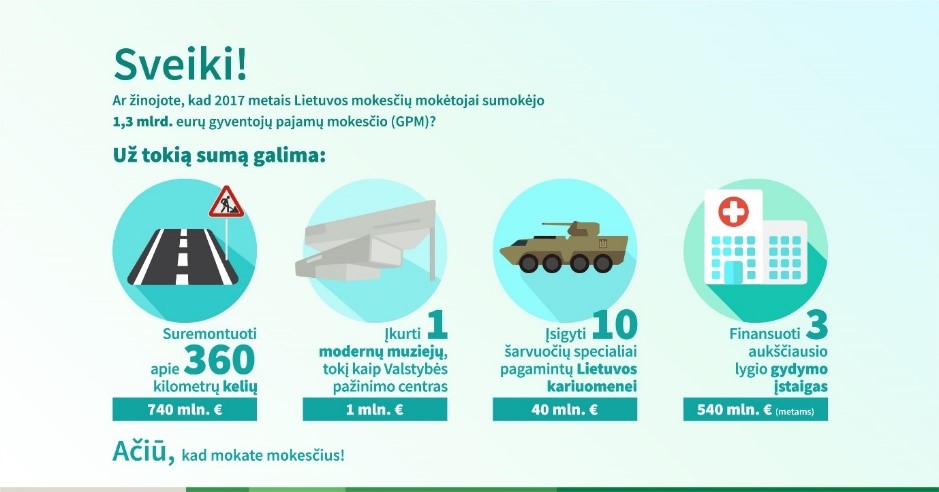
Figure 1: Stage one message
At stage two, the message summarised the amount of personal income tax collected in a particular county (Figure 2). As Lithuania is divided into ten counties, ten different messages with different amounts of personal income tax collected countywide were sent taking into consideration the place of residence of each respondent.
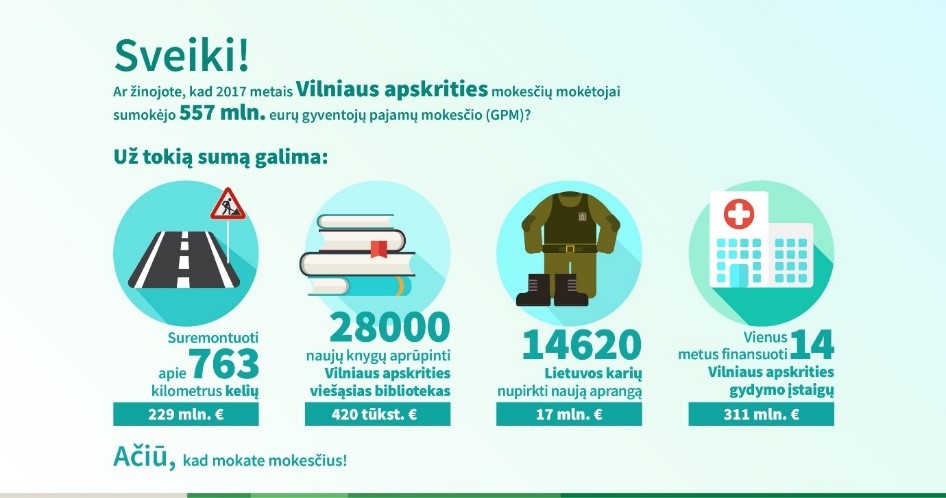
Figure 2: Stage two message
At stage three, the message provided the exact amount of personal income tax paid by the respondent together with examples of how this amount could be distributed (Figure 3) and each message was addressed individually. As each stage of the experiment was conducted consistently, the respondents’ samples for each of the three messages were in different cohorts.
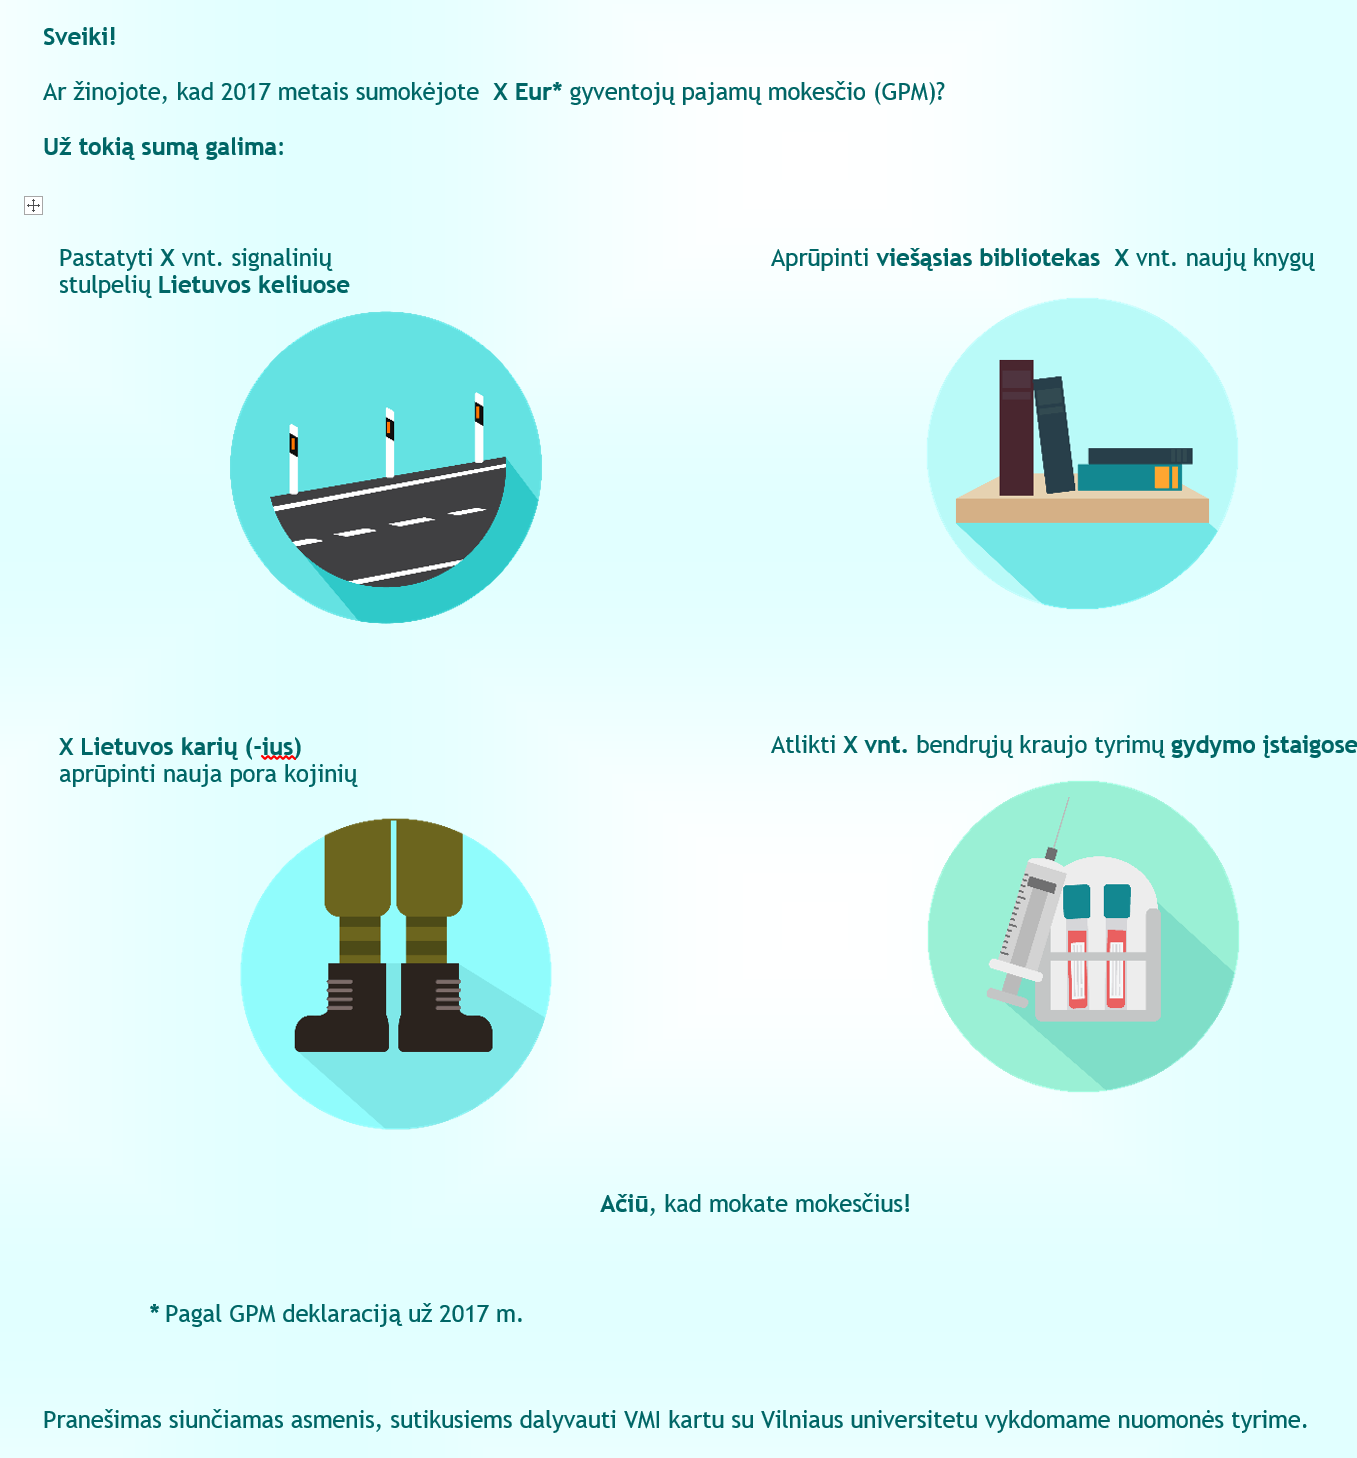
Figure 3: Stage three message where ‘X’ is the individual amount of PIT
Findings
All respondents were asked the same questions which covered topics on making sense of the quality of public services, opinion on penalties for tax evasion, paying and evading taxes and understanding the tax situation in the Lithuanian society.
Making sense of the quality of public services
We asked two questions in order to investigate how the respondents’ beliefs on quality of public services and tax level they are paying change when they read one of the three messages.
Q1. Do you agree that the quality of public services is proportionate to the fees you pay?
All three messages sent had statistically significant impact on respondents when answering this question (Figure 4).
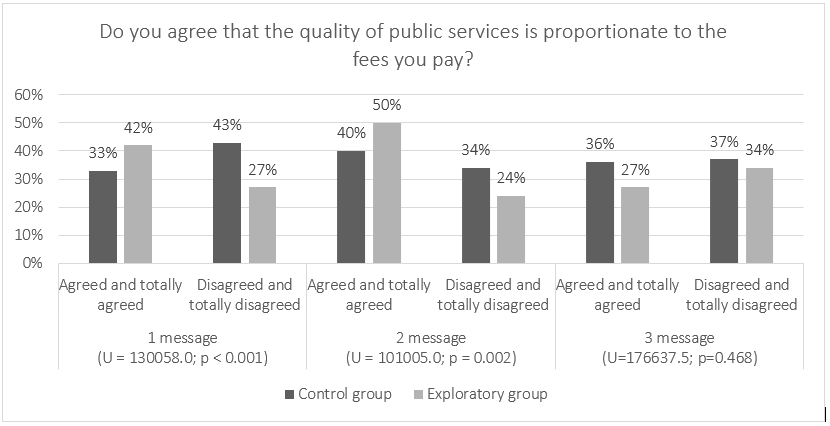
Figure 4: Do you agree that the quality of public services i proportionate to the fees you pay?
After seeing the first and the second messages, respondents were more likely to agree that the quality of public services was proportionate to the level of their taxes. Meanwhile, the third message with personal information about taxes paid had an opposite effect: respondents were less likely to agree that the quality of public services was proportionate to the level of their taxes.
Q2. Would you be willing to pay higher taxes if you received correspondingly better-quality public services?
The first and the second messages sent had a statistically significant but different impact on respondents when answering this question (Figure 5).
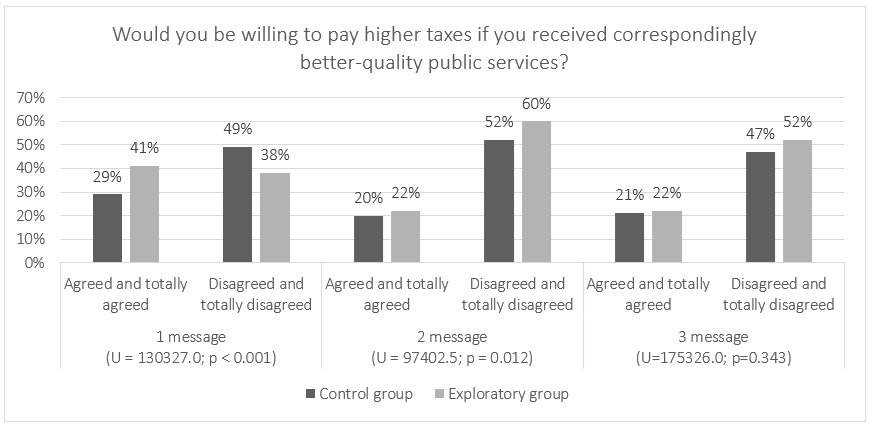
Figure 5: Would you be willing to pay higher taxes if you received correspondingly better-quality public services?
Respondents who received the first message more often agreed, and respondents who received the second message were more likely to disagree to pay higher fees if they received correspondingly higher quality public services. The third message did not produce a statistically significant effect.
It seems that the knowledge gap which filled up by learning the exact amount of taxes paid and what could be done for that money, pushed the respondents towards less likely to agreeing that the quality of public services was adequate to the tax level they paid and less likely to agreeing to pay higher taxes for getting better quality public services.
Opinion on penalties for tax evasion
Q3. Would you anonymously inform the STI if you found out your neighbour was evading taxes?
All three messages sent affected respondents and influenced their beliefs on reporting anonymously to the STI (Figure 6).
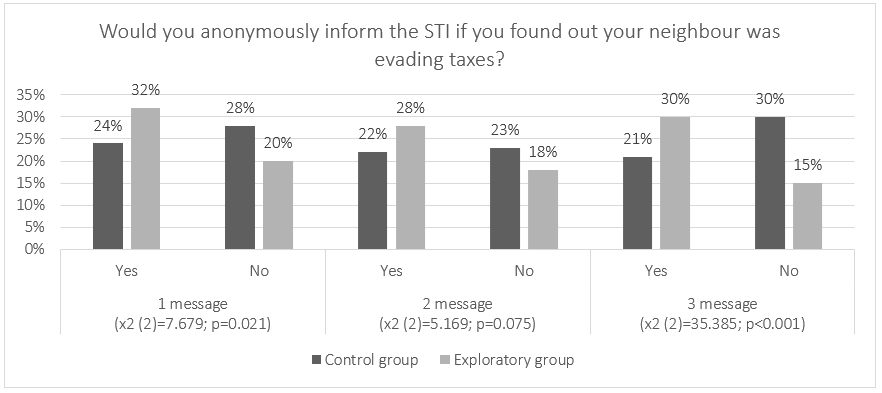
Figure 6: Would you anonymously inform the STI if you found out your neighbour was evading taxes?
Respondents who saw the first and the third messages were more likely to report to the STI. The second message did not have a statistically significant effect but the number of respondents who agreed more frequently after they received the second message also increased.
Q4. Do you agree that people who knowingly hide taxes should be punished?
The first and the second messages had a statistically significant effect on respondents (Figure 7).

Figure 7: Do you agree that people who knowingly hide taxes should be punished?
Respondents who saw these messages were more likely to agree that individuals who knowingly hide taxes should be punished. The third message did not have a statistically significant effect, although here was the opposite effect – the number of respondents who agreed that individuals who knowingly hide taxes should be punished decreased.
Paying and evading taxes
In order to investigate how the respondents’ opinion on paying taxes changed, we presented four statements and asked to indicate whether they agree with them or not.
Q5. Paying taxes is necessary.
All three messages sent had a statistically significant impact on respondents and influenced their beliefs regarding the need to pay taxes (Figure 8).
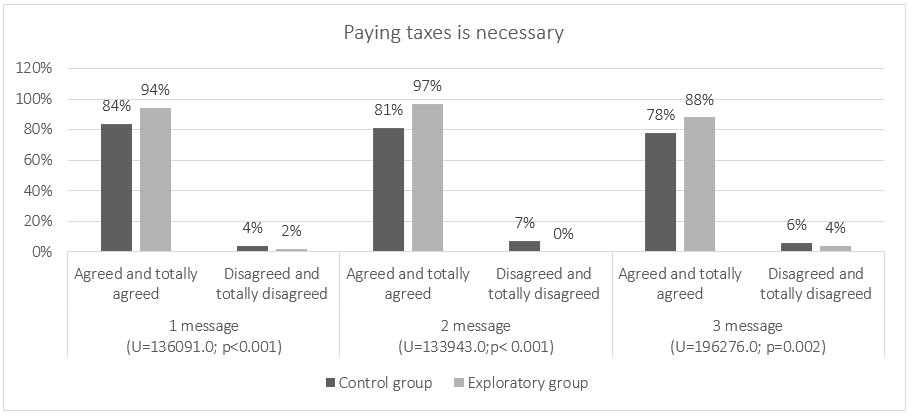
Figure 8: Paying taxes is necessary
Respondents who saw the first, the second or the third message more often agreed that it was necessary to pay taxes.
Q6. Taxes are a coercive obligation and there is nothing wrong in evading them.
All the three messages sent had a statistically significant effect on respondents and affected their perception (Figure 9).
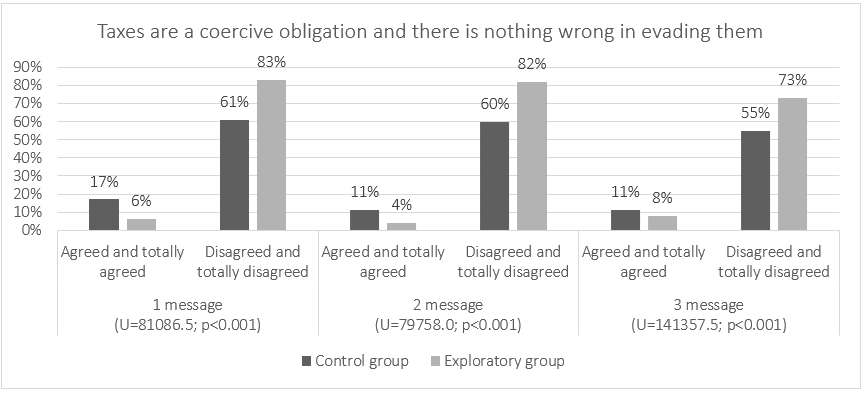
Figure 9: Taxes are a coercive obligation and there is nothing wrong in evading them
Respondents who saw the first, the second or the third message were more likely to disagree and less often agree that taxes were a coercive obligation, so it was quite fair to try to avoid them.
Q7. A person's ability to evade taxes is an indicator of their smartness.
All the three messages had a statistically significant effect on respondents and affected their perception of our statement (Figure 10).
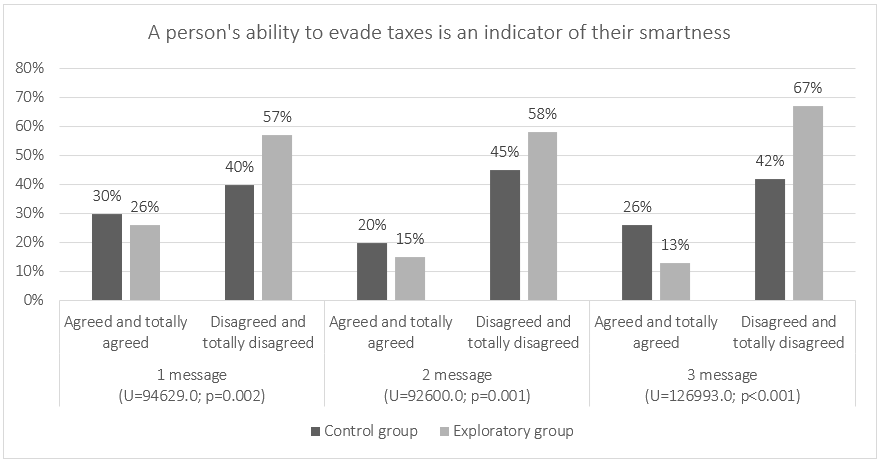
Figure 10: A person's ability to evade taxes is an indicator of their smartness
Respondents affected by the messages were more likely to disagree that a person's ability to evade taxes was an indicator of their smartness.
Q8. I don't see the point in paying taxes.
All three messages had a statistically significant effect on the respondents and influenced their perception of tax paying (Figure 11).
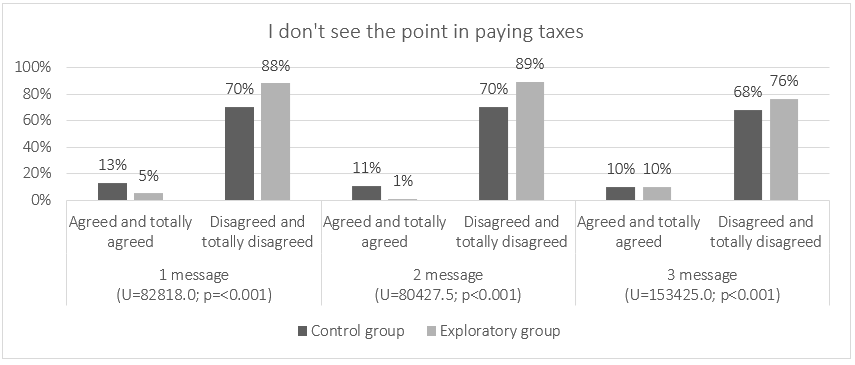
Figure 11: I don't see the point in paying taxes
Respondents more often disagreed that they did not see the point in paying taxes. After they received the first and the second messages, there was the greatest drop in the number of those who agreed that they did not see the point in paying taxes, however, after the third message the impact on the consent was much less significant.
Understanding the tax situation in the Lithuanian society
We asked two questions related to the respondents’ opinion on the tax situation when contributing to the society by paying them.
Q9. Do you feel that you are contributing to the common good of the society by paying taxes?
Only the first message had a statistically significant impact on the respondents' perception of that question (Figure 12).
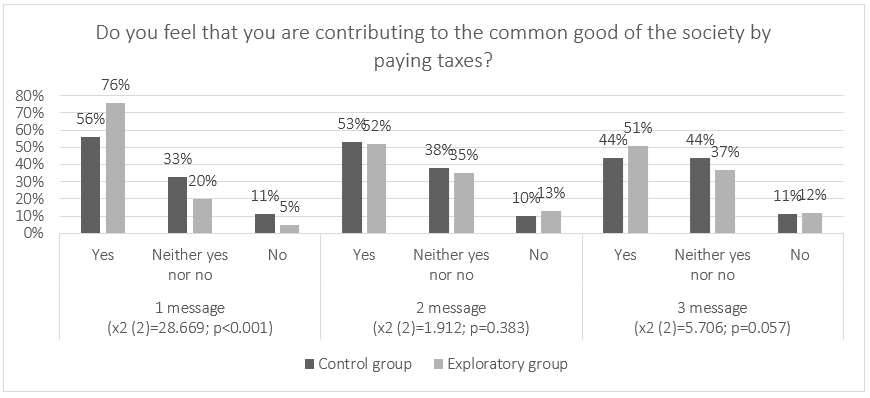
Figure 12: Do you feel that you are contributing to the common good of the society by paying taxes?
They were more likely to agree and were less likely to disagree or stay neutral. Though the second and the third message had no statistically significant impact, the data showed an opposite trend – towards less agreeing and more disagreeing.
Q10. Opinion on Lithuania's tax level
On the second question, the first and the second reports had a statistically significant impact on the respondents' assessment of Lithuania's tax level (Figure 13).
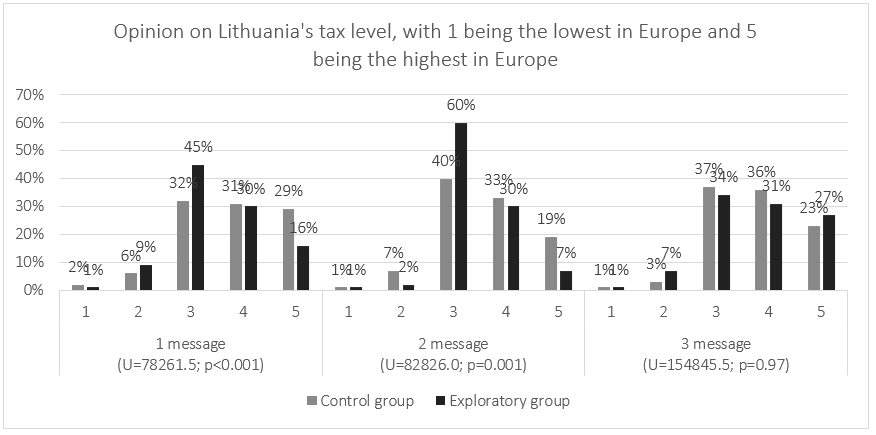
Figure 13: Opinion on Lithuania's tax level, with 1 being the lowest in Europe and 5 being the highest in Europe
Respondents who received the first or the second message rated Lithuania's tax level lower: more often rated “3” and less often “5”. Though the third message had no statistically significant impact on the respondents’ opinion, the respondents who received this message more often gave the rating “5” as compared with the responses to the first or the second message.
Impact differences by age, size of income, education, and place of residence
We assessed impact differences by respondents’ age (<40, 40-50 or >50 years old), size of income (<€550, €550-1,200 or >€1,200), education (primary and secondary education, higher non-university education and higher university education) and place of residence (city, town or village).
Analysing the impact of the first message, we discovered that respondents older than 50 years of age, earning less than €1,200 a month, and holding a higher non-university education degree were most susceptible to the information contained in the message. The place of residence had no significant difference on the impact. However, most resistant to the information in the first message were those aged 40-50, earning more than €1,200 a month, with primary or secondary education, and living in the cities.
Analysing the impact of the second message, we realised that most susceptible to the information provided therein were respondents older than 50 years of age, earning less than €550 per month, with primary or secondary education, and living in the cities. And most resistant to the impact of the information in the second message were those under 50, earning more than €1,200 per month, and holding a higher education degree.
Analysing the impact of the third message, we found that most susceptible to the information were those earning less than €1,200 per month, with primary and higher non-university education, and living in the cities or villages. Most resistant to the impact of the third message were respondents earning more than €1,200 per month, holding a higher university degree and living in towns.
Discussion and conclusions
By means of the lens of making sense of the information received, we explored how taxpayers’ opinions and beliefs change in line with the different level of tax information they were offered. New insights contributed to the potential value of including such sense making information for taxpayers’ feedback referring to social norms (taxes paid and distributed), thus stating that receiving such information did affect the respondents’ beliefs. These findings in general support similar studies suggesting that sending information about the use of taxes and other social norms has a positive effect on taxpayers’ decisions towards tax compliance (Alm et al., 2010, 2019; Cleary, 2013; Coleman, 2007; Pisani, 2014; Wenzel, 2005).
The findings of this study revealed that all three types of messages, which were framed using a reciprocity principle (Walsh, 2012) by emphasising the benefits of tax compliance, affected the respondents’ beliefs in a positive way, i.e. towards tax compliance. The number of respondents who agreed that paying taxes was necessary increased, whereas that of respondents who viewed taxes as a coercive obligation and believed that it was OK to try to avoid them and that a person's ability to evade taxes was an indicator of their smartness and stating that they didn’t see the point in paying taxes decreased accordingly, so the results support Coleman's (2007) findings that messages regarding the distribution of tax revenues had a positive effect on voluntary compliance.
However, analysis of the beliefs regarding the penalties for tax evasion generated less straightforward results. Views of all respondents were influenced in a positive way (more agreed) when it came to reporting anonymously to the STI the fact that their neighbour was evading taxes. Respondents who got messages with the amount of taxes collected in a particular county and nationwide also shifted more towards agreeing that people who knowingly hide taxes should be punished. However, the effect on respondents who got the message with the exact amount of taxes they paid was quite the opposite: they tended to disagree more. This could be explained by the possible idea crossing the taxpayers’ mind: ‘What if this amount belonged to me?’, so they tended to be less strict towards punishment for tax evasion. Yet when information on taxes paid by the whole nation or county was provided, they accepted it less personally, thus becoming stricter with regards to the punishment for tax hiding.
Similar situation was observed with the opinion on the quality of public services and taxes the respondents are paying. After receiving nationwide and countywide tax information, more respondents agreed that the quality of public services was commensurate with the fees they paid. However, after receiving personalised information on taxes paid, the respondents shifted their beliefs towards the opposite direction: less tended to agree with the fact that the quality of public services was proportionate to the fees they paid. Moreover, respondents who received nationwide and countywide tax information were less inclined to agree to pay higher taxes in order to receive correspondingly better-quality public services as compared to respondents who received personalised tax information. This might be explained by the fact that when taxpayers saw the exact tax amounts they paid and what contributions could be done in the interest of the public, they perceived these numbers as highly personal and realised that they had already made a very significant contribution, thus making them less inclined to pay more taxes, even if it would lead to better public services. This explanation is supported by the finding that most resistant to the impact of personalised tax information were those from the highest income group, holding higher university degree and living in towns.
The messages about taxes paid also had a different effect on the understanding of the contribution to the common good of the society and overall tax situation in the country. Information on taxes paid nationwide had an impact on the respondents' beliefs that by paying taxes they were contributing to the common good of the society. Messages with county and personal tax information evoked no significant changes in their opinion. Besides, Lithuanian tax level was rated higher by those respondents who received personal tax information. This could be explained by the assumption that the respondents believed taxes were higher when they saw personal information on taxes paid, rather than it being aggregated at country or county level.
Summarising, it can be stated that messages from the STI with various levels of information on taxes and examples how these taxes could be spent, do make sense and affect the opinions of respondents, at least in the short term (no long-term effects have been studied), but not necessarily in the direction the STI would want them to. This is especially true when speaking about the most detailed and personalised information, which supports the findings of Behavioural Insights Team (2012). The findings of this study, however, revealed that providing taxpayers with detailed and personalised information on taxes, might lead in other directions than the STI would like them to, as taxpayers might make sense and accept personal information on taxes differently than generalised nationwide or even countywide data.
This research is subject to several limitations. Quantitative research does not allow respondents to explain their choices, so respondents' opinions may have been influenced by other external factors, as 3-6 weeks passed after submitting the information and surveying. Besides, the empirical results reported herein should be considered in the light of the fact that though we used a representative sample, only those taxpayers who agreed to participate were surveyed, therefore opinions of respondents who did not agree to participate might be different. Generalisation also is limited by the fact this research was undertaken in Lithuania, a small country with its own tax system which is not necessarily identical to other countries. While further research would be needed to evaluate potential impacts of providing such tax related information according to different socio-cultural backgrounds and economic situations in different countries, our results indicate that there is much potential for this type of feedback in enabling tax payers to make sense of the taxes they pay and how they are distributed in line with their point of view and needs.
Acknowledgements
This research was funded by State Tax Inspectorate Under the Ministry of Finance of the Republic of Lithuania, grant number (1.11-04-2)-23-26. I acknowledge administrative support by State Tax Inspectorate and technical support by Justinas Tamosynas. The author declares no conflict of interest. The funders had no decisive role in the design of the study; in the collection, analyses, or interpretation of data; in the writing of the manuscript, or in the decision to publish the results.
About the author
Arūnas Gudinavičius is Associate Professor, PhD at Digital Media Lab, Faculty of Communication, Vilnius University (Lithuania). His research interests are information beliefs, information use, digital reading, e-books, publishing statistics, digital divide, eye tracking, human-computer interaction. He is also managing director of Vilnius University Press. He can be contacted at arunas.gudinavicius@gmail.com.
References
- Alm, J., Cherry, T., Jones, M. & McKee, M. (2010). Taxpayer information assistance services and tax compliance behavior. Journal of Economic Psychology, 31(4), 577-586. https://doi.org/10.1016/j.joep.2010.03.018
- Alm, J., Schulze, W.D., Bose, C. & Yan, J. (2019). Appeals to social norms and taxpayer compliance. Southern Economic Journal, 86(2), 638-666. https://doi.org/10.1002/soej.12374
- Baltic News Service. (2020). EK ekspertas: Lietuva turi plėsti mokesčių bazę ir gerinti jų surinkimą. https://www.bns.lt/topic/1912/news/60730267/ (Archived by the Internet Archive at https://web.archive.org/web/20200801081045/https://www.bns.lt/topic/1912/news/60730267/)
- Behavioural Insights Team. (2012). Applying behavioural insights to reduce fraud, error and debt. http://38r8om2xjhhl25mw24492dir.wpengine.netdna-cdn.com/wp-content/uploads/2015/07/BIT_FraudErrorDebt_accessible.pdf (Archived by the Internet Archive at https://web.archive.org/web/20200730094032/http://38r8om2xjhhl25mw24492dir.wpengine.netdna-cdn.com/wp-content/uploads/2015/07/BIT_FraudErrorDebt_accessible.pdf)
- Chetty, R. & Saez, E. (2013). Teaching the tax code: earnings responses to an experiment with EITC recipients. American Economic Journal: Applied Economics, 5(1), 1-31. https://doi.org/10.1257/app.5.1.1
- Cleary, D. (2013). A survey on attitudes and behaviour towards tax and compliance. https://www.revenue.ie/en/corporate/documents/research/survey-attitudes-behaviours-dec2013.pdf (Archived by the Internet Archive at https://web.archive.org/web/20191019165016/https://www.revenue.ie/en/corporate/documents/research/survey-attitudes-behaviours-dec2013.pdf)
- Coleman, S. (2007). The Minnesota income tax compliance experiment: replication of the social norms experiment. SSRN Electronic Journal. https://doi.org/10.2139/ssrn.1393292
- Dervin, B. (1983). An overview of sense-making research: concepts, methods and results. Paper presented at the International Communication Association Annual Meeting, Dallas, Texas. http://communication.sbs.ohio-state.edu/sense-making/art/artdervin83.html (Archived by the Internet Archive at https://web.archive.org/web/19980423212212/http://communication.sbs.ohio-state.edu/sense-making/art/artdervin83.html)
- Dervin, B. (1992). From the mind’s eye of the user: the sense-making qualitative-quantitative methodology. In J.D. Glazier & R.R. Powell (Eds.), Qualitative research in information management (pp. 61-84). Libraries Unlimited. https://www.ideals.illinois.edu/bitstream/handle/2142/2281/Dervin1992a.htm (Archived by the Internet Archive at https://web.archive.org/web/20200801085520/https:/www.ideals.illinois.edu/bitstream/handle/2142/2281/Dervin1992a.htm)
- Dervin, B. (1999). On studying information seeking methodologically: the implications of connecting metatheory to method. Information Processing & Management, 35(6), 727-750. http://dx.doi.org/10.1016/S0306-4573(99)00023-0
- Doyle, E., Gallery, K. & Coyle, M. (2009). Procedural justice principles and tax compliance in Ireland: a preliminary exploration in the context of reminder letters. Journal of Finance and Management in Public Services, 8(1), 49-62.
- Eurostat. (2019). Tax revenue statistics. https://ec.europa.eu/eurostat/statistics-explained/index.php/Tax_revenue_statistics (Archived by the Internet Archive at https://web.archive.org/web/20200722015749/https://ec.europa.eu/eurostat/statistics-explained/index.php/Tax_revenue_statistics)
- Faruqui, A., Sergici, S. & Sharif, A. (2010). The impact of informational feedback on energy consumption - a survey of the experimental evidence. Energy, 35(4), 1598-1608. https://doi.org/10.1016/J.ENERGY.2009.07.042
- Frey, B.S. & Torgler, B. (2007). Tax morale and conditional cooperation. Journal of Comparative Economics, 35(1), 136-159. https://doi.org/10.1016/J.JCE.2006.10.006
- Kirchler, E. (2007). The economic psychology of tax behaviour. Cambridge University Press. https://doi.org/10.1017/CBO9780511628238
- Kuhlthau, C.C. (1991). Inside the search process: information seeking from the user’s perspective. Journal of the American Society for Information Science, 42(5), 361-371. http://dx.doi.org/10.1002/(SICI)1097-4571(199106)42:5%3C361::AID-ASI6%3E3.0.CO;2-%23
- Murphy, K. (2004). The role of trust in nurturing compliance: a study of accused tax avoiders. Law and Human Behavior, 28(2), 187-209. https://doi.org/10.1023/B:LAHU.0000022322.94776.ca
- (2010). Understanding and influencing taxpayers’ compliance behaviour. http://www.oecd.org/ctp/administration/46274793.pdf (Archived by the Internet Archive at https://web.archive.org/web/20180920170028/http://www.oecd.org/ctp/administration/46274793.pdf)
- Pirolli, P. & Russell, D. (2011). Introduction to this special issue on sensemaking. Human-Computer Interaction, 26(1), 1-8. https://doi.org/10.1080/07370024.2011.556557
- Pisani, S. (2014). An approach to assess how the activity of the italian revenue agency affects compliance. Discussion Topics of the Italian Revenue Agency. https://www.researchgate.net/publication/268122603 (Archived by the Internet Archive at https://web.archive.org/web/20200801094213/https:/www.researchgate.net/profile/Stefano_Pisani/publication/268122603_An_approach_to_assess_how_the_activity_of_the_italian_revenue_agency_affects_compliance/links/5461da330cf2c1a63c001e93/An-approach-to-assess-how-the-activity-of-the-italian-revenue-agency-affects-compliance.pdf?origin=publication_detail)
- Sandberg, J. & Tsoukas, H. (2015). Making sense of the sensemaking perspective: its constituents, limitations, and opportunities for further development. Journal of Organizational Behavior, 36(S1), S6-S32. https://doi.org/10.1002/job.1937
- Savolainen, R. (2006). Information use as gap-bridging: the viewpoint of sense-making methodology. Journal of the American Society for Information Science and Technology, 57(8), 1116-1125. https://doi.org/10.1002/asi.20400
- Medina, L. & Schneider, F. (2018). Shadow economies around the world: what did we learn over the last 20 Years? International Monetary Fund, working paper 18/17. https://www.imf.org/en/Publications/WP/Issues/2018/01/25/Shadow-Economies-Around-the-World-What-Did-We-Learn-Over-the-Last-20-Years-45583 (Archived by the Internet Archive at https://web.archive.org/web/20200719150630/https://www.imf.org/en/Publications/WP/Issues/2018/01/25/Shadow-Economies-Around-the-World-What-Did-We-Learn-Over-the-Last-20-Years-45583)
- Skatteverket. (2005). Right from the start: research and strategies. Solna.
- Walsh, K. (2012). Understanding taxpayer behaviour - new opportunities for tax administration. The Economic and Social Review, 43(3), 451-475. https://www.esr.ie/article/view/46 (Archived by the Internet Archive at https://web.archive.org/web/20200716205841/https://www.esr.ie/article/view/46)
- Weick, K.E., Sutcliffe, K.M. & Obstfeld, D. (2005). Organizing and the process of sensemaking. Organization Science, 16(4), 409-421. https://doi.org/10.1287/orsc.1050.0133
- Wenzel, M. (2005). Motivation or rationalisation? Causal relations between ethics, norms and tax compliance. Journal of Economic Psychology, 26(4), 491-508. https://doi.org/10.1016/j.joep.2004.03.003
- Wintrobe, R. & Gërxhani, K. (2004). Tax evasion and trust: a comparative analysis. Paper presented at the European Public Choice Society Annual Meeting, Berlin, Germany. https://www.diw.de/documents/dokumentenarchiv/17/41525/Paper-214.pdf (Archived by the Internet Archive at https://web.archive.org/web/20171215081610/http://www.diw.de/documents/dokumentenarchiv/17/41525/Paper-214.pdf)