Proceedings of the Tenth International Conference on Conceptions of Library and Information Science, Ljubljana, Slovenia, June 16-19, 2019
Pressure to publish: a bibliometric study of PhD students (1993-2009)
Tove Faber Frandsen, Rasmus Højbjerg Jacobsen, Jeppe Nicolaisen and Jakob Ousager.
Introduction. Academic advancements as well as funding depend on publications and thus pressure researchers to publish. The perception of the pressure to publish is tied to career stage. The uncertain future careers of PhD-students and postdocs cause them to be more aware of publication pressure.
Method. Using a data set of health sciences PhD-students from the University of Southern Denmark, this paper investigates whether the productivity and citation impact of PhD-students has increased over time. We use a pseudo-experimental matching method to ensure that former and contemporary PhD-students have similar characteristics as measured by a number of balancing variables.
Analysis. The matching method enables us to estimate productivity and impact by an ordinary t-test using standard statistical software packages.
Results. Collectively, after completion of the PhD-program the PhD-students from the new cohort publish more than the PhD-students from the old cohort. The results of the citation analyses show that on average, the publications by the new cohort from years 1 through 5 after graduation receive more citations than the publications by the old cohort. Yet, when comparing normalized and fractionalized citation counts, the cohorts are remarkably similar.
Conclusions. PhD-students have increased their publication rate although the citation rates have not changed.
Introduction
Universities, peers and the surrounding society judge academic achievement primarily by publication outputs. Advancements as well as access to funding depend on publications and thus there is a pressure on researchers to publish (Dinis-Oliveira & Magalhães, 2015 ; Van Dalen & Henkens, 2012). The pressure to publish is also termed the “publish or perish”-paradigm, although it is unclear who coined the phrase (Garfield, 1996 ). This paradigm describes the pressure experienced by researchers to maximize their research output, as a relatively short publication record is disadvantageous when it comes to career prospects. The paradigm also includes the temptations faced by researchers to maximize their output (e.g. by publishing premature results or dividing the research output into the smallest possible units).
Institutions respond to the focus on the amount of publication output too. Academic departments frequently offer writing courses, writing support groups and writing coaches to researchers to increase the publication rates for the participants (McGrail, Rickard & Jones, 2006 ). Some universities even reward the researchers with extra funding depending on their publication record (e.g. Quan, Chen & Shu, 2017; Yuret, 2017 ).
Researchers are consequently under great pressure to maximize their scientific output and they respond to the incentives. Some argue that the pressure to publish is the cause of the salami-slicing- or the least-publishable-unit-effects, both of which are concepts applied to the practice of splitting scientific findings into smaller units to achieve more publications from a single research project (Broad, 1981 ). Others question the existence of this phenomenon, and in particular, the size of the effect is subject to much debate. Cordero et al. (2016 ) argue that the number of data items and density of composite figures are suitable parameters for determining the change in information content per research article over time. They find no change over time in average publishable unit, although they do acknowledge the potential shortcomings of their methodology. Overall, researchers’ individual publication rate has not increased in a century (Fanelli & Larivière, 2016). Pressure to publish may also be the cause of scientific misconduct (Tijdink, Verbeke & Smulders, 2014 ) as well as publishing in low-barrier publication outlets (Grančay, Vveinhardt, & Šumilo, 2017; McCann & Polacsek, 2018). The existence and size of this phenomenon is also debated (Frandsen, 2019; Fanelli, Costas & Larivière, 2015).
The perception of pressure to publish is tied to career stage. The uncertain future careers of PhD-students and postdocs cause them to be more aware of publication pressure (Hangel & Schmidt-Pfister, 2017; Waaijer, Teelken, Wouters & Van Der Weijden, 2018). However, Dyke (2019) argues that early career researchers are dealing with manifold pressures of which the pressure to publish is just one. Miller, Taylor & Bedeian (2011) finds that the primary source for the pressure is the prospects of enhancing the professional reputation, leaving a permanent mark on the profession, and increasing salary and job mobility.
Young scholars in particular feel the pressure to publish which may imply, that – although researchers’ individual publication rate has not increased in a century – this may not necessarily be the case for researchers early in their careers. Elaborating on this issue, the present study investigates whether early career researchers has responded to the increasing pressure by producing more scientific output.
Methods
The primary data set used in this study consists of 1,355 PhD-students from the health sciences at the University of Southern Denmark (until 1998 known as University of Odense) who enrolled in the PhD-program between 1993 and 2009. To look at the development over time, we select two cohorts of students – a recent cohort and an old cohort – and compare the scientific achievements of these two cohorts. In the old cohort, an average of 27 PhD-students enrolled every year. In the recent cohort the number has risen to 67 on average. (Please note that in the recent cohort, the increase is massive for the latest two years whereas the number of starting students in first four years were more modest.).
Table 1 shows the reduction in the data set from the master data set (A) to the potential analysis data set (C). Of the 1,355 individuals, 646 had not completed their PhD-degree, resulting in 709 remaining individuals (data set B). Most of the 646, who we excluded, had enrolled recently (i.e. less than 3 years before), although 70 were dropouts. We measure the publication activity and received citations five years before and after enrolment (see more on the specific choice of publication and citations windows below), and thus the latest year for students in our analysis to be enrolled is 2009 (searches for the analysis were carried out in 2016). Consequently, we excluded an additional 84 individuals leaving us with 625 individuals (data set C). Finally, we excluded 138 individuals to ensure that we only study students who enrolled during the first or the last five years of the analysis period. The resulting data set consists of 487 individuals (data set D).
| Data set | Description | Removed | Remaining |
|---|---|---|---|
| A | Master data set | 1,355 | |
| B | PhD-degree not completed | 646 | 709 |
| C | PhD-study started after 2009 | 84 | 625 |
| D | PhD-study started between 1999 and 2003 | 138 | 487 |
An observed development in research performance over time could be due to selection bias. Characteristics of PhD-students have changed over time, and these changing characteristics may cause any observed changes in publication activity or citation impact. To avoid possible selection bias, we use a pseudo-experimental matching method that is typically used to match a treatment group to a similar control group. Matching methods seek to replicate or imitate a randomized experiment in which the matched treated and control observations do not differ systematically from each other. See Frandsen et al. (2015) for a recent study on gender differences using matching methods on a smaller, but similar data set. In this study we apply a matching method to form PhD-student pairs, which means that we consider “treatment” (defined at being a member of the recent cohort) to be randomly assigned within each pair. Using matching methods, we can answer the main question of whether there are changes over time in the scientific productivity and impact during and after graduate school by comparing the simple means from the two groups. Hence, if the average number of publications and citations is higher (in a statistically significant sense) in the control group of early PhD-students than in the group of later PhD-students, then we conclude that early PhD-students had a higher productivity than more recently enrolled students. In this case, we form two groups: one group consists of PhD-students enrolled 1993-1998, and the other group consists of PhD-students enrolled 2004-2009. The former group enrolled at a time when very few PhD-students enrolled each year, and the latter at a time of massification of student enrollment in graduate programs.
We need to match the PhD-students in the two groups to ensure that they have similar characteristics as measured by a number of balancing variables. The choice of matching variables determines on which parameters they are similar, but does not help to eliminate biases due to disparities in other unobserved variables. The challenge is to find the variables that are of most importance both for the probability of high publication activity and high citation impact, such that any remaining differences may be attributed to differences over time alone. Following the results from Frandsen et al. (2015), age and discipline are important characteristics whereas gender is not. We include matching on the level of sub-discipline, which implies that we compare the production of a recent PhD-student to that of an early PhD-student within the same sub-discipline. This approach means that field normalization is needless.
Sub-discipline: This variable is specified as the hospital department that the individuals were affiliated with. In cases, where individuals were affiliated with more than one department, we made use of both possible sub-disciplines to look-up a possible match. In cases, where the individuals were not affiliated to a specific hospital department, we used the university department to which the student was attached to determine the sub-discipline
Education: Our primary data set contains information about the degree with which the students enter the PhD-study. Most individuals in the data set were MDs, but about one in four has another educational background, whereof most have a degree in science.
Age: We allow up to five years difference in age. Thus, we only match the recent and early students if there is no more than 5 years difference in age between them.
Gender: Following the results from Frandsen et al (2015) we do not match based on gender. However, in the analysis we split up the data in a number of mixed gender pairs and a number of same gender pairs to allow for gender specific publication and citation patterns.
Table 2 shows the reduction in the data set from the potential analysis data set (D) to the final data set used in analysis (E).
| Data set | Description | Pairs | 1993-98 | 2004-09 |
|---|---|---|---|---|
| D | Potential analysis data set | 150 | 337 | |
| E | Match found | 97 | 63 | 97 |
The potential data set (D) from Table 1 consists of 337 students from the new cohort (enrolled during 2004-09) and 150 students from the old cohort (enrolled during 1993-98), hence the number of students more than doubled from the mid-1990s to the mid-2000s. When using the above listed matching criteria, we found 97 pairs of PhD-students (data set E in Table 2). We matched the 97 recent PhD-students with 63 different early PhD-students, and some of the early students thus served as control for more than one recent student. As Frandsen et al. (2015) we thus use matching with replacement that allows a given control subject to be included in more than one matched set. Matching with replacement reduces bias (Dehejia & Wahba, 2002) although one should be careful not to use the same control subject endlessly (Stuart, 2010). In this case 14 early PhD-students each served as control for two different recent PhD-students, 7 early PhD-students each served as control for three different recent PhD-students, and two early PhD-students each served as control for four different recent PhD-students. Consequently, the replacement is at an acceptable level.
If the publication list of an individual could not be determined due to more authors with the same name, we looked for online publication lists.
We identified publications and citations for each individual using Web of Science and personal websites for consultation. The data consists of information on individuals and the publications by these individuals as well as the citations received. Information on individuals consists of
- First name(s)
- Last name
- Educational background
- Hospital department / university department
- Enrolment year
- Date of birth
- Gender
For the 11 years ranging from five years prior to the enrolment year to five years after the enrolment year, we collected the following variables for each publication:
- Publication type (e.g. meeting abstract, review, article)
- Number of authors
- Publication year
Finally, we collected data on the impact of the abovementioned publications. The collected citation data is as follows:
- Citations received in a three-year citation window. The citation window for publications from 2014 is only two years and for publications from 2015 only one year. Publications with only one- or two-year citation windows will all other things equal receive fewer citations. Consequently, we analyze the corresponding publications by the matching PhD-student from the old cohort with similar citation windows.
Since we wish to compare impact over time, we need to take the issue of database coverage into account. The PhD-students in the data set are selected by matching PhD-students from different time periods on the basis of demographic information and information on their research area. This selection method provides the best opportunity to isolate any bibliometric effect, but it can prove difficult to determine to what extent that bibliometric effect is in fact due to differences in database coverage or changes in publication or citation practices over time. To take different citation practices across publication years into account, all citation data should be normalized according to the average number of citations received by papers of the same publication type, published in the same year and in the same field. Determining the field is, however, not a trivial task.
Historically, normalization has often been based on Web of Science subject categories (see Abramo, D'Angelo, & Grilli, 2015 and Ruocco & Daraio, 2013 for recent examples). However, Leydesdorff ( 2008) argues that the subject categories are remarkably flawed. Some of them overlap more than others, many journals are misplaced, and the categories tend to be highly heterogeneous. Leydesdorff and Bornmann (2016 ) further argue that normalizations using these categories might seriously harm the quality of the bibliometric analysis. Consequently, in this study we find it essential to find alternatives to the normalization made based on Web of Science subject categories. Waltman (2016) provide an overview of alternatives and developments.
The traditional normalization based on Web of Science categories, which can also be called “a posteriori”-normalization or “cited-side”-normalization, can be replaced or supplemented with what is known as “citing-side”-, “a priori”-, or “source”-normalization. This approach does not require the division of research into fields and aims to “normalize citation impact indicators by correcting for the effect of reference list length” (Waltman, 2016: 378). Normalization by fractional counting of citations is termed the audience factor by Zitt and Small (2008):
“Hence, the audience factor is a variant of a fractional citation-counting scheme, but computed on the citing journal rather than the citing article or disciplinary level, and, in contrast to other cited-side normalization strategies, is focused on the behavior of the citing entities” Zitt and Small (2008: 1856)
For each paper p citing a paper q the “value” of this citation is inversely proportional to the total number of citations made by the paper p (Bouyssou & Marchant, 2016). Zhou and Leydesdorff (2011: 362) describe the procedure as follows:
“Each of the […] citing documents contains a number of references (k) and is accordingly attributed to the cited document with a fractional weight 1/k.”
Thus, we time-normalize by fractional counting of citations. To provide an overview we also collect the number of citations before normalization in terms of number of authors and time:
- Fractional citation-counting in a three-year citation window. The citation window for publications from 2014 is only two years and for publications from 2015 only 1 year. Only citations to the same publication types are included.
The matching methods enable us to estimate productivity and impact by an ordinary t-test using standard statistical software packages.
Results
Some PhD-projects do not result in any publications within a five-year time window from initiation date. Out of the 97 recent PhD-students in our matched data, 7 individuals did not publish at all during the period stretching from five years before enrolment to five years after enrolment. For the old cohort of PhD-students, this number is twice as high; namely 14. In some cases, the students did in fact publish, but if the publications are not indexed in Web of Science they are not included in this study, which obviously favors journal publications in English.
Splitting the data into same gender pairs and mixed gender pairs we find 52 same gender pairs and 45 mixed pairs in the matched data. Further analyses of the differences between these two groups reveal that there are no statistically significant differences at the 0.05 level in their publication rate or number of citations for any of our indicators. Consequently, we continue the data analyses of the total data set.
Figure 1 shows the average number of publications for the recent and early group of PhD-students over time. This figure (and the following six figures) should be read as follows: The numbers on the horizontal axis represent years from the enrolment year. Hence, the number zero is the enrolment year, the number 2 is two years after enrolment, and the number -3 is three years before enrolment etc. In the appendix, we present statistical tests for the pooled data containing the observations from the 5 years before enrolment (Table A.1) and 5 years after enrolment (Table A.2). The appendix also presents the data points from figures 1-7 and the corresponding statistical tests (Tables A.3-A.9).
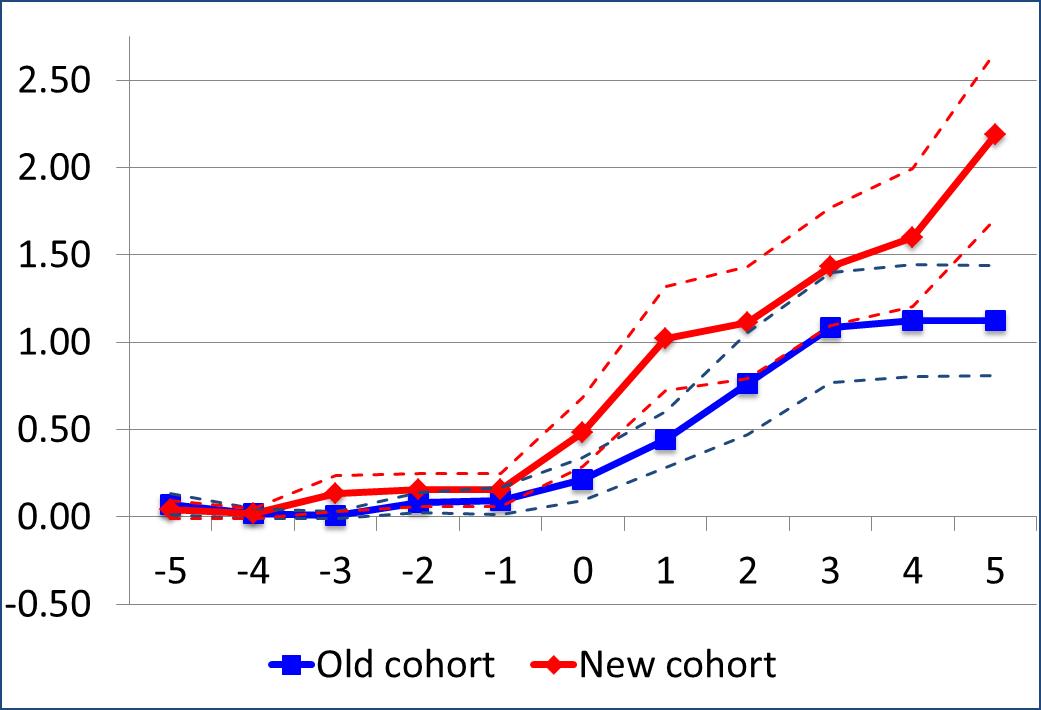
Figure 1: Total publications
Note to figure 1: The difference between the two groups is only significantly different from zero in years -3, 0, 1 and 5, when using a standard t-test and the 5 percent significance level. The remaining years are not different in a statistically significant way, based on a 5 percent significance level. The red and blue dashed lines show the 95 percent confidence interval for the new and old cohorts, respectively. Data points for the figure are available in Table A.3.
The tendencies depicted in Figure 1 exhibit an expected pattern given the population used for the analysis. The average number of published articles is very low in the years until the enrolment in the PhD-program. Thereafter the number rises for the new as well as the older cohort.
Figure 1 further shows that the average total number of publications is higher for the new cohort than for the older cohort, although this difference is only statistically significant in years 1 and 5. However, the total number of publications in years 1-5 is statistically higher for the recent cohort (see Table A.2 in the appendix). The difference in productivity remains stable when we exclude publications of the type ‘other’ (book reviews, meeting abstracts and corrections) and thus keep only articles and reviews (see Figure 2). In year five, the mean difference is at a level of about one publication per individual, which is also the case when looking at articles and reviews only.
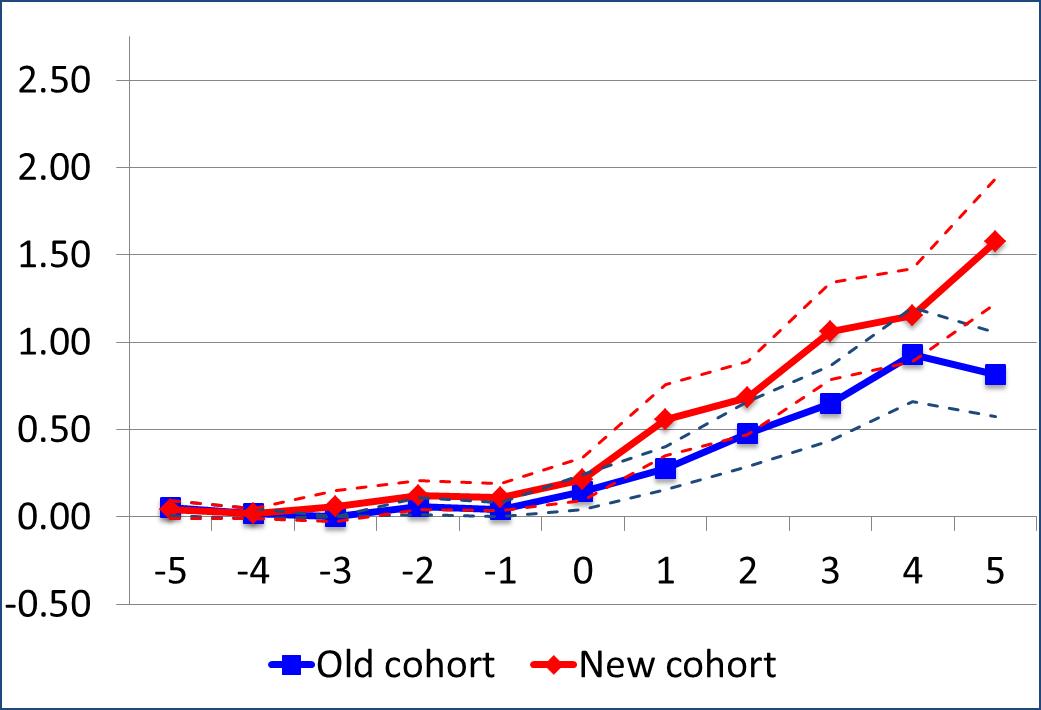
Figure 2: Articles and reviews
Note to figure 2: The difference between the two groups is only significantly different from zero in years 1, 3 and 5, when using a standard t-test and the 5 percent significance level. The remaining years are not different in a statistically significant way, based on a 5 percent significance level. The red and blue dashed lines show the 95 percent confidence interval for the new and old cohorts, respectively. Data points for the figure are available in Table A.4.
Meeting abstracts typically demands less scientific content than a brief communication. However, even though a more fine-grained analysis would be ideal, the data set does not contain the necessary amount for that level of detail.
Excluding publications with less scientific content from the analysis, the difference in productivity remains the same. In this analysis, the difference in productivity is only statistically significant in year 1, 3, and 5 at the 5 percent significance level. The total number of articles and reviews published in years 1-5 is higher and statistically significant at the 1 percent level for the recent cohort (Table A.2).
However, we are missing a crucial aspect of author productivity as the contribution of a single author depends on the number of involved authors. Cropley (2016: 1) states that it is a recent trend to list “everybody who had anything to do with a research project as an author of the project report”. He argues that the increased focus on adding everyone who offered e.g. technical support to the project may lead to undervaluing the importance of ideas, especially novel, even provocative ideas. Fanelli and Larivière (2016) on the other hand conclude that researchers’ individual publication rates have not increased in a century. They base their findings on data from 40,000 researchers. Below, we address both points of view.
First, Figure 3 shows the author productivity in terms of fractionalized articles and reviews when using simple fractionalization, i.e. attributing each publication equally to all contributing authors. The results of an analysis of fractionalized total publications are available in Table A.2.
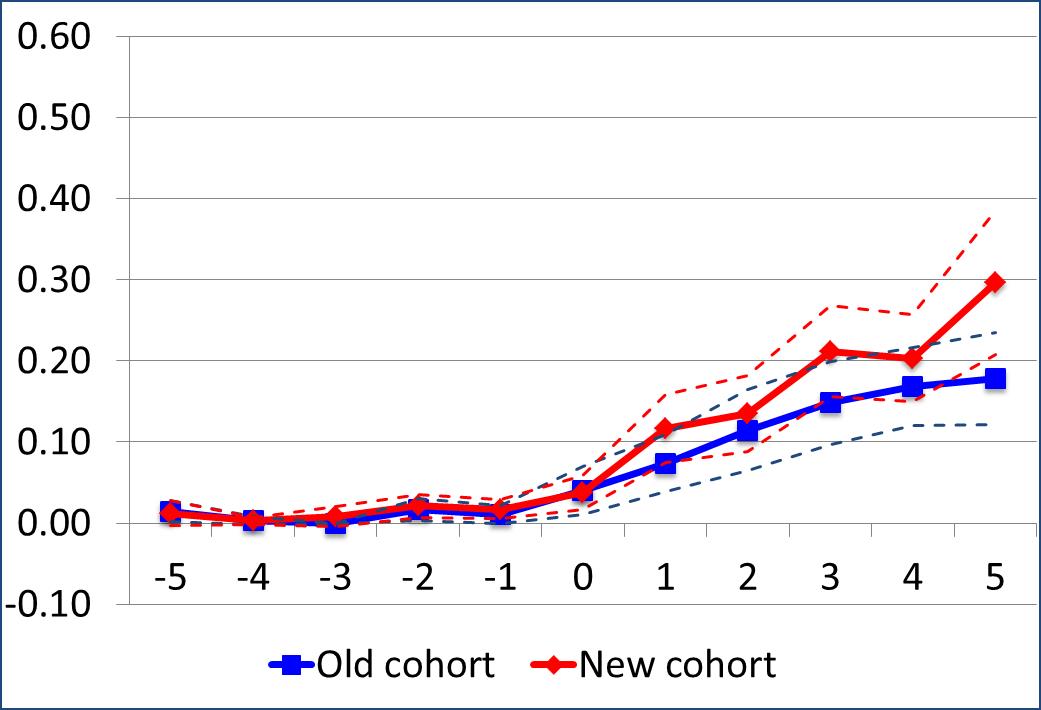
Figure 3: Fractionalized articles and reviews
Note to figure 3: The difference between the two groups is only significantly different from zero in year 5, when using a standard t-test and the 5 percent significance level. The red and blue dashed lines show the 95 percent confidence interval for the new and old cohorts, respectively. Data points for the figure are available in Table A.6.
Figure 3 illustrates that the PhD-students from the new cohort seems to be producing slightly more than the students from the old cohort. On average there is about 7 authors per publication (median of 6) for the new cohort and about 6 authors on average (median of 5) for the old cohort. Consequently, the difference in productivity between the two cohorts is thus expected to decrease compared to figure 1, which is also the case.
However, the total number of fractionalized publications from years 1-5 is still higher for the new cohort than for the old cohort, and this difference is statistically significant at the 5 percent level. We thus observe a difference in overall productivity, although the yearly difference between the two groups is only significantly different from zero in year 5, when using a standard t-test and the 5 percent significance level. The difference in total number of fractionalized articles and reviews published in years 1-5 is statistically is also different from zero at the 5 percent level (Table A.2).
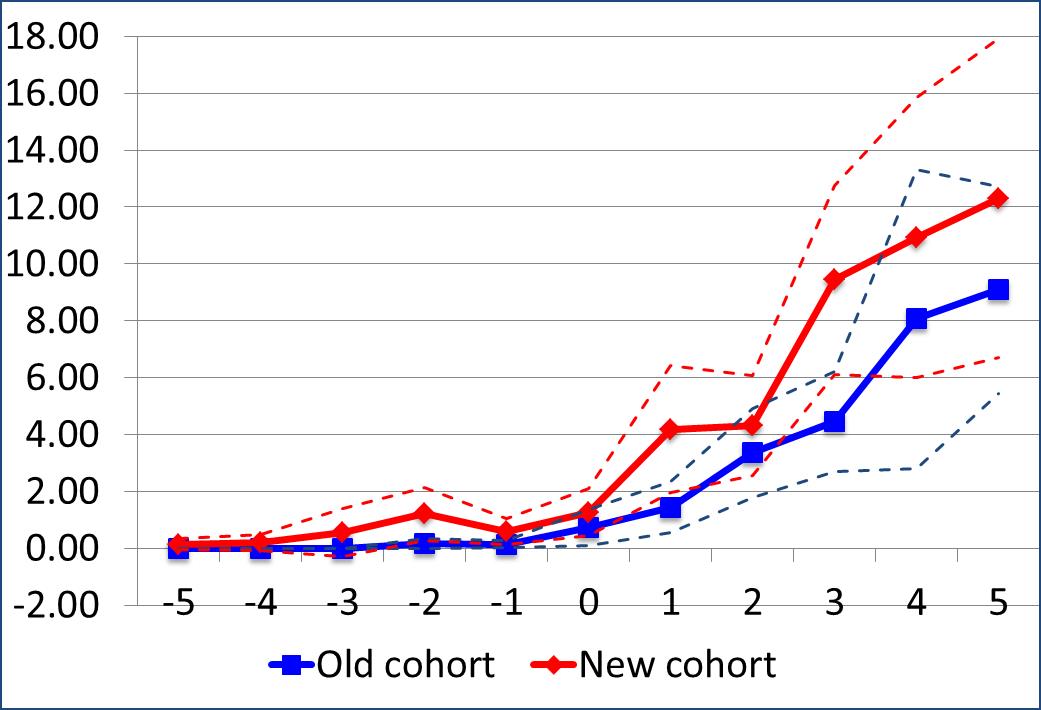
Figure 4: Total citations received
Note to figure 4: The difference between the two groups is only significantly different from zero in years -2, 1 and 3, when using a standard t-test and the 5 percent significance level. The red and blue dashed lines show the 95 percent confidence interval for the new and old cohorts, respectively. Data points for the figure are available in Table A.7.
Figure 4 illustrates the total number of citations received in a three-year citation window to publications published in years -5 to 5. The citation window for publications from 2014 is only two years and for publications from 2015 only 1 year. For matching earlier publications, we reduced the time window accordingly to ensure fair comparisons. The new cohort receives more citations to their publications compared to the old cohort. However, the difference between the two groups is only significantly different from zero in year -2, 1 and 3, when using a standard t-test and the 5 percent significance level. Nevertheless, the total number of citations received during the years 1-5 is higher for the recent group, and this difference is statistically significant at the 5 percent level (Table A.2). Interestingly, the number of citations to publications from years -5 through -1 is also higher for the new cohort than for the old cohort, and this difference is statistically significant at the 1 percent level (Table A.1). However, the overall numbers are quite small as the average number of citations received is just 2.7 for the new cohort and 0.3 for the old cohort.
Finally, Figure 5 shows the number of received citations normalized and fractionalized. This figure shows the time-normalized impact by fractional counting of citations. The overall impression, when comparing the two cohorts, is that they are remarkably similar, and as could be expected, the differences between the cohorts are not significantly different from zero in any year, when using a standard t-test and the 5 percent significance level.
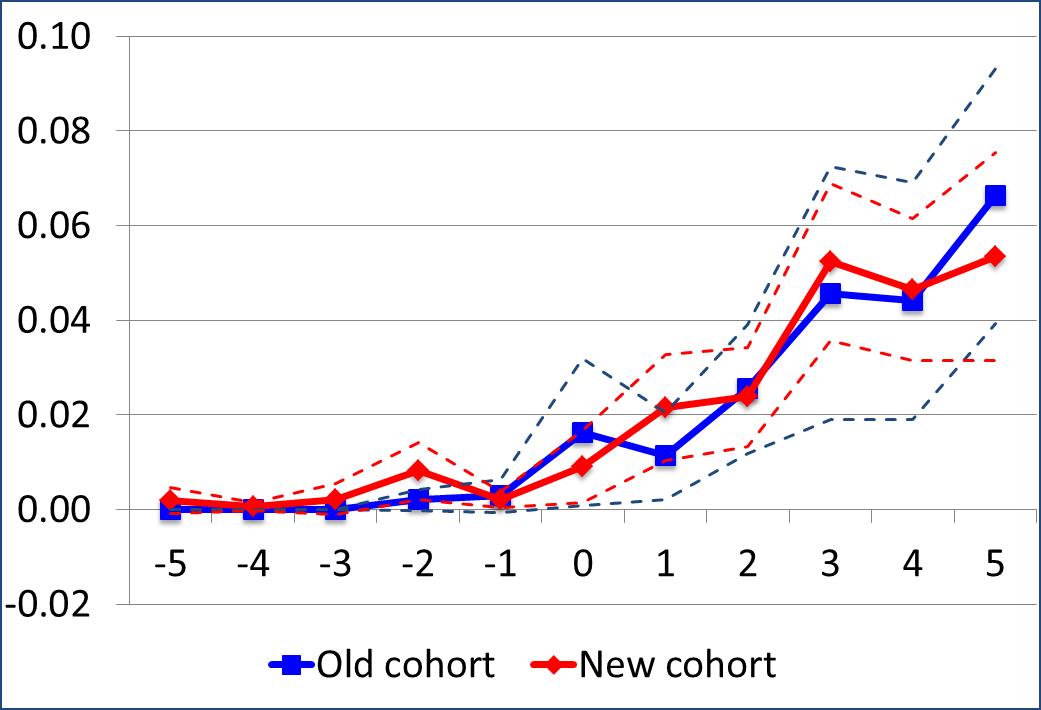
Figure 5: Fractionalized and normalized total citations
Note to figure 5: The difference between the two groups is not significantly different from zero in any year, when using a standard t-test and the 5 percent significance level. The red and blue dashed lines show the 95 percent confidence interval for the new and old cohorts, respectively. Data points for the figure are available in Table A.9.
Discussion and conclusion
Collectively, after completion of the PhD-program the PhD-students from the new cohort have published more compared to the PhD-students from the old cohort. On average, over a period of 5 years from entering the PhD-program, a PhD-student from the new cohort published almost 3 publications more than a PhD-student from the old cohort. The difference is only marginally smaller when narrowing the analysis to just articles and reviews. Thus, the results of the publication analyses are not caused by a possible change in the pattern of document types. When conducting the publication analyses on fractionalized counts, the difference between the two cohorts drops further to just 0.4 publications more over the 5-year period. The difference is still statistically significant implying that on average, over a period of 5 years from entering the PhD-program, a PhD-student from the new cohort did publish more than a PhD-student from the old cohort.
In the present study, we included citation counts to supplement productivity with an estimate of impact. The results of the citation analyses show a pattern similar to that of the publication analyses. On average, the publications from years 1 through 5 after enrolment of the PhD-students from the new cohort received more citations than the publications from the old cohort when using comparable citation windows. Yet, when analyzing the fractionalized citation counts, we found the difference between the two cohorts to be statistically insignificant. Finally, when comparing normalized and fractionalized citation counts, the cohorts are remarkably similar.
Doctoral education in Denmark is legally framed by a ministerial order, and the overall legal framework for doctoral education has remained the same throughout the investigated period. The ministerial order on doctoral education allows for variations in the graduate schools’ implementation in way of local practices, principles, and guidelines. Enrollment criteria, quality assurance processes and requirements, and procedures and standards related to the final assessment and degree award have remained fairly unchanged. The most notable and influential change in the structural framing of doctoral education at the Graduate School of Health Sciences at the University of Southern Denmark in the relevant period is the introduction in 2006 of mandatory funding from external grantors which may have functioned as an added incentive to work even more with the quality assurance, formulation, and trimming of the planned PhD-project, thereby indirectly improving the chances of a successful project start and completion. Consequently, there does not seem to be any changes in the legal framework that would explain the results of the present study.
In this study we find that the productivity of the PhD-students has increased (significantly at the 0.05 level). This is in contrast to Fanelli and Larivière (2016) who find that – after adjusting for developments in co-authorship – the publication rate of scientists in all disciplines has not increased overall. On the contrary, they find that the publication rate has actually mostly declined. The cause of this contrast is likely the use of matching methods in the present study. This ensures that the matched treated and control observations do not differ systematically from each other as they have similar characteristics measured by a number of balancing variables. Consequently, any changes over time in the observed research performance is not due to selection bias caused by changes in the characteristics of PhD-students and their research areas.
Our results seem to match what we would expect from a “publish or perish”-paradigm. The increase in publication counts combined with stable citation counts may suggest that researchers increasingly sense a pressure to publish, which to some extent compromises the quality of their work (as measured by received citations). However, splitting up in smaller units may not necessarily be a questionable research practice. It may simply be caused by e.g. too much data for one paper, limitations in journal space or a need to explain each step in more detail (Happell, 2016; Hicks & Berg, 2014; Refinetti, 1990). An increased tendency to splitting up publications have been confirmed, and discipline specific differences are recognized (e.g. Frandsen et al., 2019), however the extent of the problem is questioned (Hennessey, Williams, Afshar, & MacNeily, 2012; Fanelli & Larivière, 2016). Dyke (2019) even states that the paradigm is largely a myth and that more pressures exist that are at least or even more important (e.g. grant income). Furthermore, a strong correlation between number of papers and number of citations is found by Sandström and van den Besselaar (2016) who also found a correlation for the production of high impact papers: the more papers, the more high impact papers. In this light, the increased productivity is thus not necessarily a sign of questionable research practice, but could be considered a positive development increasing the chances of significant contributions to the scientific communities. The correlation between productivity and impact is discipline specific as well as age specific (Larivière & Costas, 2016; Kolesnikov, Fukumoto & Bozeman, 2018).
About the authors
Tove Faber Frandsen is associate professor at University of Southern Denmark, Department of Design and Communication. She can be contacted at t.faber@sdu.dk
Rasmus Højbjerg Jacobsen is project director at VIVE – The Danish Center for Social Science Research.
Jeppe Nicolaisen is associate professor at Department of Information Studies, University of Copenhagen, Denmark.
Jakob Ousager is head of Research & Development division, Faculty of Health Sciences, University of Southern Denmark
References
- Abramo, G., D'Angelo, C.A. & Grilli, L. (2015). Funnel plots for visualizing uncertainty in the research performance of institutions. Journal of Informetrics,9 (4): 954-961.
- Bouyssou, D. & Marchant, T. (2016). Ranking authors using fractional counting of citations: An axiomatic approach. Journal of Informetrics, 10(1): 183-199.
- Broad, W.J. (1981) The publishing game: Getting more for less.Science, 211: 1137–1139.
- Cordero, R.J.B., León-Rodriguez, C.M., Alvarado-Torres, J., Rodriguez, A.R. & Casadevall, A. (2016). Life science's average publishable unit (APU) has increased over the past two decades.PLoS One, 11 (6): e0156983.
- Van Dalen, H. P. & Henkens, K. (2012). Intended and unintended consequences of a publish-or-perish culture: A worldwide survey. Journal of the American Society for Information Science and Technology, 63 (7): 1282-1293.
- Dehejia, R. H. & Wahba, S. (2002). Propensity score-matching methods for nonexperimental causal studies.Review of Economics and Statistics, 84(1): 151-161.
- Dinis-Oliveira RJ, Magalhaes T. (2015). The Inherent Drawbacks of the Pressure to Publish in Health Sciences: Good or Bad Science. F1000Res 2015;4:419–doi. 10.12688/f1000research.6809.2
- Dyke, G. (2019). Does the early career ‘publish or perish’ myth represent an opportunity for the publishing industry?Learned Publishing, 32(1): 90-94. doi:10.1002/leap.1217
- Fanelli, D. & Larivière, V. (2016). Researchers' individual publication rate has not increased in a century.PloS One, 11(3): doi:10.1371/journal.pone.0149504
- Fanelli, D., Costas, R. & Larivière, V. (2015). Misconduct policies, academic culture and career stage, not gender or pressures to publish, affect scientific integrity.PloS One, 10(6): doi:10.1371/journal.pone.0127556
- Frandsen, T. F. (2019). Why do researchers decide to publish in questionable journals? A review of the literature.Learned Publishing, 32(1): 57-62. https://doi.org/10.1002/leap.1214 (Archived by WayBack Machine at https://web.archive.org/web/20190805114830/https://onlinelibrary.wiley.com/doi/full/10.1002/leap.1214)
- Frandsen, T. F.; Eriksen, M. B.; Hammer, D. M. G. and Christensen, J. B. (2019). Fragmented publishing: a large-scale study of health science.Accepted for publication in Scientometrics.
- Frandsen, T.F., Jacobsen, R.H., Wallin, J. A., Brixen, K. & Ousager, J. (2015). Gender differences in scientific performance: A bibliometric matching analysis of Danish health sciences Graduates.Journal of Informetrics, 9(4): 1007-1017.
- Garfield, E. (1996). What is the primordial reference for the phrase ‘publish or perish’? Scientist, 10: 11.
- Grančay, M., Vveinhardt, J. & Šumilo, Ē. (2017). Publish or perish: how Central and Eastern European economists have dealt with the ever-increasing academic publishing requirements 2000–2015. Scientometrics, 111(3): 1813-1837. doi:10.1007/s11192-017-2332-z
- Hangel, N. & Schmidt-Pfister, D. (2017). Why do you publish? On the tensions between generating scientific knowledge and publication pressure. Aslib Journal of Information Management, 69 (5), 529-544.
- Happell, B. (2016). Salami: By the slice or swallowed whole? Applied Nursing Research, 30, 29-31. doi:10.1016/j.apnr.2015.08.011
- Hennessey, K. K., Williams, A. R., Afshar, K. & MacNeily, A. E. (2012). Duplicate publications: A sample of redundancy in the Journal of Urology. Journal of the Canadian Urological Association, 6(3), 177-180. doi:10.5489/cuaj.11265
- Hicks, R. & Berg, J. A. (2014). Multiple publications from a single study: ethical dilemmas. J Am Assoc Nurse Pract, 26(5), 233-235. doi:10.1002/2327-6924.12125
- Kolesnikov, S., Fukumoto, E. & Bozeman, B. Scientometrics(2018) 116: 1995. https://doi-org.proxy1-bib.sdu.dk/10.1007/s11192-018-2793-8
- Larivière, V. & Costas, R. (2016). How many is too many? On the relationship between research productivity and impact. PLoS ONE, 11(9), e0162709.
- Leydesdorff, L. (2008). Caveats for the use of citation indicators in research and journal evaluation. Journal of the American Society for Information Science and Technology, 59(2): 278-287.
- Leydesdorff, L. & Bornmann, L. (2016), The operationalization of “fields” as WoS subject categories (WCs) in evaluative bibliometrics: The cases of “library and information science” and “science & technology studies”. Journal of the Association for Information Science and Technology, 67: 707–714.
- McCann, T. V. & Polacsek, M. (2018). False gold: Safely navigating open access publishing to avoid predatory publishers and journals. Journal of Advanced Nursing, 74(4): 809-817. doi:10.1111/jan.13483
- McGrail, M. R., Rickard, C. M. & Jones, R. (2006). Publish or perish: a systematic review of interventions to increase academic publication rates. Higher Education Research & Development, 25(1): 19-35.
- Miller, A. N., Taylor, S. G. & Bedeian, A. G. (2011). Publish or perish: academic life as management faculty live it. Career development international, 16(5): 422-445.
- Quan, W., Chen, B. & Shu, F. (2017). Publish or impoverish: An investigation of the monetary reward system of science in China (1999-2016). Aslib Journal of Information Management, 69(5): 486-502.
- Refinetti, R. (1990). In defense of the least publishable unit. The FASEB journal : official publication of the Federation of American Societies for Experimental Biology, 4(1), 128-129.
- Ruocco, G. & Daraio, C. (2013). An empirical approach to compare the performance of heterogeneous academic fields. Scientometrics, 97 (3): 601-625.
- Sandström, U. & van den Besselaar, P. (2016). Quantity and/or quality? The importance of publishing many papers. PloS one, 11(11), e0166149.
- Stuart, E.A. (2010). Matching methods for causal inference: A review and a look forward. Statistical Science, 25(1): 1-21.
- Tijdink, J. K., Verbeke, R. & Smulders, Y. M. (2014). Publication pressure and scientific misconduct in medical scientists. Journal of Empirical Research on Human Research Ethics, 9(5): 64-71.
- Waaijer, C. J., Teelken, C., Wouters, P. F. & van der Weijden, I. C. (2018). Competition in science: links between publication pressure, grant pressure and the academic job market. Higher education policy, 31 (2), 225-243.
- Waltman, L. (2016). A review of the literature on citation impact indicators. Journal of Informetrics, 10(2): 365-391.
- Yuret, T. (2017). Do researchers pay attention to publication subsidies? Journal of Informetrics, 11(2), 423-434.
- Zhou, P. & Leydesdorff, L. (2011). Fractional counting of citations in research evaluation: A cross- and interdisciplinary assessment of the Tsinghua University in Beijing. Journal of Informetrics, 5(3): 360-368.
- Zitt, M. & Small, H. (2008). Modifying the journal impact factor by fractional citation weighting: The audience factor. Journal of the American Society for Information Science and Technology, 59(11): 1856-1860.
How to cite this paper
Appendices
Tables A.1-A.2 shows the comparison of the new and old cohorts for the pooled data containing the observations from the 5 years before enrolment (Table A.1) and 5 years after enrolment (Table A.2). Tables A.3-A.9 below show the data point for Figure 1-7 in the paper.
Each table also contains the T-tests carried out to determine whether the differences between the old and new cohorts where statistically significant. The T-tests were carried out as standard two-tailed tests for equal sample size and equal variance as the expected variances of the two samples a priori were the same. One asterisk (*) marks values that are statistically significant at a 5 percent significance level, while two asterisks (**) mark values that are statistically significant at the 1 percent level.
| Old cohort | New cohort | ||||||
|---|---|---|---|---|---|---|---|
| Variable | Mean | Std.dev. | Mean | Std.dev. | T-test | p-value | |
| Total publications | 0.278 | 0.851 | 0.505 | 1.174 | 1.541 | 0.125 | |
| Articles and reviews | 0.175 | 0.677 | 0.361 | 1.033 | 1.480 | 0.141 | |
| Fractionalized total publications | 0.088 | 0.307 | 0.092 | 0.200 | 0.105 | 0.917 | |
| Fractionalized articles and reviews | 0.045 | 0.179 | 0.062 | 0.169 | 0.649 | 0.517 | |
| Total citations | 0.299 | 1.243 | 2.680 | 8.689 | 2.672 | 0.008 | ** |
| Fractionalized citations | 0.081 | 0.353 | 0.440 | 1.349 | 2.537 | 0.012 | ** |
| Normalized and fractionalized cit. | 0.005 | 0.021 | 0.015 | 0.045 | 1.964 | 0.051 | |
| Old cohort | New cohort | ||||||
|---|---|---|---|---|---|---|---|
| Variable | Mean | Std.dev. | Mean | Std.dev. | T-test | p-value | |
| Total publications | 4.536 | 5.019 | 7.351 | 6.158 | 3.489 | 0.001 | ** |
| Articles and reviews | 3.144 | 3.335 | 5.031 | 4.192 | 3.469 | 0.001 | ** |
| Fractionalized total publications | 1.046 | 1.231 | 1.481 | 1.426 | 2.275 | 0.024 | * |
| Fractionalized articles and reviews | 0.683 | 0.782 | 0.964 | 0.925 | 2.278 | 0.024 | * |
| Total citations | 26.381 | 36.496 | 41.186 | 49.383 | 2.374 | 0.019 | * |
| Fractionalized citations | 5.062 | 7.252 | 6.178 | 5.768 | 1.186 | 0.237 | |
| Normalized and fractionalized cit. | 0.193 | 0.274 | 0.362 | 1.096 | 1.471 | 0.143 | |
The numbers in the two above tables show no overall tendency for neither the old nor the new cohort to be more productive. However, there is a tendency – seen from Table A.2 – for the new cohort to be more productive after enrolment in terms of the total number of publication and citations, while this difference get smaller (and even disappears for citations) when the numbers are fractionalized.
| Old cohort | New cohort | ||||||
|---|---|---|---|---|---|---|---|
| Year | Mean | Std.dev. | Mean | Std.dev. | T-test | p-value | |
| -5 | 0.072 | 0.297 | 0.041 | 0.247 | 0.788 | 0.432 | |
| -4 | 0.021 | 0.143 | 0.021 | 0.143 | 0.000 | 1.000 | |
| -3 | 0.010 | 0.102 | 0.134 | 0.513 | 2.330 | 0.021 | * |
| -2 | 0.082 | 0.277 | 0.155 | 0.464 | 1.316 | 0.190 | |
| -1 | 0.093 | 0.384 | 0.155 | 0.464 | 1.011 | 0.314 | * |
| 0 | 0.216 | 0.616 | 0.485 | 0.980 | 2.280 | 0.024 | * |
| 1 | 0.443 | 0.803 | 1.021 | 1.472 | 3.391 | 0.001 | ** |
| 2 | 0.763 | 1.442 | 1.113 | 1.593 | 1.606 | 1.606 | |
| 3 | 1.082 | 1.559 | 1.433 | 1.670 | 1.511 | 0.133 | |
| 4 | 1.124 | 1.596 | 1.598 | 1.956 | 1.850 | 0.066 | |
| 5 | 1.124 | 1.563 | 2.186 | 2.378 | 3.676 | 0.000 | ** |
| Old cohort | New cohort | ||||||
|---|---|---|---|---|---|---|---|
| Year | Mean | Std.dev. | Mean | Std.dev. | T-test | p-value | |
| -5 | 0.052 | 0.222 | 0.041 | 0.247 | 0.306 | 0.760 | |
| -4 | 0.021 | 0.143 | 0.021 | 0.143 | 0.000 | 1.000 | |
| -3 | 0.000 | 0.000 | 0.062 | 0.429 | 1.422 | 0.157 | |
| -2 | 0.062 | 0.242 | 0.124 | 0.415 | 1.268 | 0.207 | |
| -1 | 0.041 | 0.200 | 0.113 | 0.378 | 1.661 | 0.099 | |
| 0 | 0.144 | 0.500 | 0.216 | 0.599 | 0.911 | 0.364 | |
| 1 | 0.278 | 0.608 | 0.557 | 1.010 | 2.325 | 0.021 | * |
| 2 | 0.474 | 0.925 | 0.680 | 1.046 | 1.454 | 0.148 | |
| 3 | 0.649 | 1.061 | 1.062 | 1.375 | 2.338 | 0.021 | * |
| 4 | 0.928 | 1.333 | 1.155 | 1.318 | 1.192 | 0.235 | |
| 5 | 0.814 | 1.184 | 1.577 | 1.773 | 3.524 | 0.001 | ** |
| Old cohort | New cohort | ||||||
|---|---|---|---|---|---|---|---|
| Year | Mean | Std.dev. | Mean | Std.dev. | T-test | p-value | |
| -5 | 0.035 | 0.211 | 0.012 | 0.078 | 0.999 | 0.319 | |
| -4 | 0.003 | 0.024 | 0.003 | 0.021 | 0.133 | 0.894 | |
| -3 | 0.001 | 0.013 | 0.026 | 0.101 | 2.375 | 0.019 | * |
| -2 | 0.021 | 0.073 | 0.027 | 0.082 | 0.533 | 0.595 | |
| -1 | 0.026 | 0.111 | 0.023 | 0.072 | 0.248 | 0.805 | |
| 0 | 0.061 | 0.176 | 0.094 | 0.201 | 1.201 | 0.232 | |
| 1 | 0.116 | 0.247 | 0.232 | 0.347 | 2.671 | 0.008 | ** |
| 2 | 0.188 | 0.381 | 0.228 | 0.379 | 0.741 | 0.460 | |
| 3 | 0.261 | 0.409 | 0.282 | 0.368 | 0.380 | 0.705 | |
| 4 | 0.216 | 0.309 | 0.300 | 0.420 | 1.599 | 0.112 | |
| 5 | 0.265 | 0.422 | 0.439 | 0.603 | 2.318 | 0.022 | * |
| Old cohort | New cohort | ||||||
|---|---|---|---|---|---|---|---|
| Year | Mean | Std.dev. | Mean | Std.dev. | T-test | p-value | |
| -5 | 0.015 | 0.064 | 0.012 | 0.078 | 0.219 | 0.827 | |
| -4 | 0.003 | 0.024 | 0.003 | 0.021 | 0.133 | 0.894 | |
| -3 | 0.000 | 0.000 | 0.008 | 0.061 | 1.345 | 0.181 | |
| -2 | 0.017 | 0.066 | 0.021 | 0.072 | 0.456 | 0.649 | |
| -1 | 0.011 | 0.053 | 0.017 | 0.058 | 0.766 | 0.445 | |
| 0 | 0.040 | 0.147 | 0.038 | 0.105 | 0.134 | 0.894 | |
| 1 | 0.074 | 0.175 | 0.117 | 0.208 | 1.553 | 0.123 | |
| 2 | 0.115 | 0.245 | 0.135 | 0.234 | 0.596 | 0.552 | |
| 3 | 0.148 | 0.253 | 0.213 | 0.279 | 1.702 | 0.091 | |
| 4 | 0.169 | 0.239 | 0.203 | 0.265 | 0.958 | 0.340 | |
| 5 | 0.178 | 0.281 | 0.297 | 0.441 | 2.228 | 0.0272 | * |
| Old cohort | New cohort | ||||||
|---|---|---|---|---|---|---|---|
| Year | Mean | Std.dev. | Mean | Std.dev. | T-test | p-value | |
| -5 | 0.000 | 0.000 | 0.144 | 0.935 | 1.520 | 0.131 | |
| -4 | 0.000 | 0.000 | 0.196 | 1.404 | 1.374 | 0.172 | |
| -3 | 0.000 | 0.000 | 0.546 | 4.133 | 1.302 | 0.195 | |
| -2 | 0.165 | 0.874 | 1.206 | 4.605 | 2.188 | 0.030 | * |
| -1 | 0.134 | 0.606 | 0.588 | 2.188 | 1.968 | 0.051 | |
| 0 | 0.732 | 3.111 | 1.268 | 4.089 | 1.028 | 0.306 | |
| 1 | 1.433 | 4.453 | 4.186 | 11.056 | 2.274 | 0.024 | * |
| 2 | 3.351 | 7.714 | 4.320 | 8.704 | 0.821 | 0.413 | |
| 3 | 4.454 | 8.732 | 9.433 | 16.411 | 2.638 | 0.009 | ** |
| 4 | 8.062 | 26.080 | 10.938 | 24.404 | 0.793 | 0.429 | |
| 5 | 9.082 | 18.043 | 12.309 | 27.801 | 0.959 | 0.339 | |
| Old cohort | New cohort | ||||||
|---|---|---|---|---|---|---|---|
| Year | Mean | Std.dev. | Mean | Std.dev. | T-test | p-value | |
| -5 | 0.000 | 0.000 | 0.047 | 0.311 | 1.481 | 0.141 | |
| -4 | 0.000 | 0.000 | 0.027 | 0.192 | 1.410 | 0.161 | |
| -3 | 0.000 | 0.000 | 0.085 | 0.637 | 1.314 | 0.191 | |
| -2 | 0.047 | 0.258 | 0.197 | 0.709 | 1.955 | 0.053 | |
| -1 | 0.034 | 0.154 | 0.084 | 0.311 | 1.423 | 0.157 | |
| 0 | 0.182 | 0.719 | 0.234 | 0.874 | 0.456 | 0.649 | |
| 1 | 0.277 | 0.790 | 0.671 | 1.504 | 2.287 | 0.024 | * |
| 2 | 0.682 | 1.695 | 0.788 | 1.553 | 0.456 | 0.649 | |
| 3 | 0.844 | 1.710 | 1.638 | 2.611 | 2.505 | 0.013 | * |
| 4 | 1.189 | 3.071 | 1.564 | 2.594 | 0.919 | 0.360 | |
| 5 | 2.071 | 5.223 | 1.517 | 2.272 | 0.958 | 0.340 | |
| Old cohort | New cohort | |||||
|---|---|---|---|---|---|---|
| Year | Mean | Std.dev. | Mean | Std.dev. | T-test | p-value |
| -5 | 0.000 | 0.000 | 0.002 | 0.014 | 1.333 | 0.185 |
| -4 | 0.000 | 0.000 | 0.001 | 0.004 | 1.398 | 0.164 |
| -3 | 0.000 | 0.000 | 0.002 | 0.016 | 1.301 | 0.195 |
| -2 | 0.002 | 0.011 | 0.008 | 0.030 | 1.895 | 0.060 |
| -1 | 0.003 | 0.017 | 0.002 | 0.008 | 0.442 | 0.659 |
| 0 | 0.016 | 0.077 | 0.009 | 0.037 | 0.825 | 0.411 |
| 1 | 0.011 | 0.045 | 0.022 | 0.056 | 1.407 | 0.162 |
| 2 | 0.026 | 0.068 | 0.024 | 0.052 | 0.203 | 0.839 |
| 3 | 0.046 | 0.133 | 0.117 | 0.655 | 1.043 | 0.299 |
| 4 | 0.044 | 0.125 | 0.046 | 0.074 | 0.156 | 0.877 |
| 5 | 0.060 | 0.123 | 0.153 | 0.878 | 1.034 | 0.303 |