Cultural congruence of Websites: conscious, unconscious or coincidental? The case of Honda Cars
Femke Vyncke, Leo Van Hove and Malaika Brengman
Introduction. This paper analyses the cross-cultural Website design strategy of a division of a single multinational company, namely Honda Cars.
Method. We conducted a content analysis of sixty-one Honda Cars Websites, each targeted at a different country.
Analysis. We perform t-tests and compute Pearson correlations to verify and quantify the cultural convergence of the Honda Cars Websites. We use novel regression analyses to explain the deviations between the culture reflected in the Websites and the culture of the country the sites are targeted at.
Results. We find that the sites of Honda Cars are by and large culturally congruent – for all the dimensions of national culture originally proposed by Hofstede and Hall. The templates that some regional offices of Honda Cars provided to their branches thus do not appear to have overly constrained local developers in creating a culturally sensitive site. Finally, the sites show a higher degree of localisation when the Internet penetration in the country is high and a lower localisation degree when the country has an extreme score on a specific cultural dimension.
Conclusions. Our results suggest that the observed cultural congruence is partly deliberate and partly accidental.
Introduction
Cultural values are an important topic in international marketing, as they affect how consumers respond to marketing communication – including Websites (Usunier and Lee, 2009). Companies that want to address diverse cultural groups across national borders thus face accommodation issues when designing their Websites. Indeed, the consensus in the literature is that sites that reflect a target country’s culture are more effective. The reviews by Vyncke and Brengman (2010) and Tigre Moura, Singh and Chun (2016) show that so-called cultural congruence has a positive impact on Website performance measures such as perceived usefulness, perceived ease of use, positive attitudes, positive intentions and overall effectiveness.
However, the existing studies only investigate whether or not Websites significantly reflect national culture as measured in terms of, for example, Hofstede’s classification. The literature has never really analysed to what extent the reflected culture corresponds with the actual culture of a country, let alone tried to explain the deviations. Moreover, so far only Singh, Baack and Bott (2010) have investigated the strategy of international companies with regard to cross-cultural Website design and examined whether they see localisation as an important issue. The present paper aims to fill these research gaps by means of a case study of Honda Cars.
The structure of the remainder of the paper is as follows. After a brief review of the literature, the section that follows provides a deeper look into Honda Cars and its Website design strategy. The next section then sets out the theoretical background, the research questions, and the hypotheses. After describing the data and the methodology we dive into the results. In the first step, t-tests and correlations verify, as well as quantify, the reflection of culture in the Honda Cars Websites. In the second step we zoom in on the deviations between actual and reflected culture and attempt to explain these deviations by means of regression analysis. In particular, the question here is whether the observed level of cultural congruence is the result of a deliberate strategy, an unconscious process, or just coincidence. In the third and final step, we study whether or not the templates provided by some of the regional headquarters of Honda Cars constrained local developers in creating culturally congruent Websites on the national level. The paper ends with concluding remarks and suggestions for future research.
Literature overview and research gaps
An important stream of literature has investigated whether Websites aimed at different countries are dissimilar. Several content-analytic studies confirm this hypothesis (Calabrese, Capece, Pillo and Martino, 2014; Cyr and Trevor-Smith, 2004; Okazaki, 2004; Okazaki and Rivas, 2002; Robbins and Stylianou, 2003; Simin, Tavangar and Pinna, 2011; Singh, Zhao and Hu, 2003; Singh, Park, Chun, Tigre Moura and Kim, 2017). The studies provide evidence that the cross-country dissimilarities run deep and involve culturally rooted customs such as colour associations, tone of text, vocabulary and type of pictures.
However, not all studies fully support these results. Some conclude that Websites are not culturally sensitive (Callahan, 2005; De Troyer et al., 2006; Stengers, De Troyer, Baetens, Boers and Mushtaha, 2004), other studies find that Websites do reflect some, but not all, aspects of national culture (Chun, Singh, Sobh and Benmamoun, 2015; Sohaib and Kang, 2014; Wang, Lou, Wang and Guo, 2015; Yalcin, Singh, Apil, Sayfullin and Staub, 2010, Yalcin, Singh, Dwivedi, Apil and Sayfullin, 2011). For example, Singh and Baack (2004), Singh and Matsuo (2004), Singh, Kumar and Baack (2005), Singh, Zhao and Hu (2005), Brengman (2007), Sinkovics, Yamin and Hossinger (2007), Sohaib and Kang (2014) and Wang, Lou, Wang and Guo (2015) all conclude that Websites do not reflect uncertainty avoidance, an aspect of culture as defined by Hofstede (1980, 2001); see below. In short, the literature does not agree on the observed cultural congruence of Websites.
This lack of consensus might be in part due to a methodological problem. When comparing groups of Websites that target different countries, many of the content-analytic studies in the domain fail to take into account the specific nature of the industries in their samples (Calabrese et al., 2014; Chun, Singh, Sobh and Benmamoun 2015; Okazaki and Rivas, 2002; Robbins and Stylianou, 2003; Singh and Matsuo, 2004; Singh et al., 2017; Sinkovics et al., 2007; Sohaib and Kang, 2014; Yalcin et al., 2011). This may well distort the results, as marketing concerns differ across sectors (Yalcin et al., 2010). Certain Website features can be essential in some sectors but less so in others (Barber and Badre, 1998). For example, one would expect information about product safety (an item linked to uncertainty avoidant cultures) to be more prominent in automobile than in fashion Websites. An automobile Website may therefore contain more features reflecting uncertainty avoidance than a fashion Website, even when they both target the same country and culture.
The few, and recent, content-analytic studies that do investigate sectoral differences typically find that they do matter. In their comparison of Website design attributes between US and Chinese small- and medium-sized enterprises, Wang et al. (2015, p. 593) find that 'the pattern of differences appears to be highly consistent' across the three sectors they study. However all three sectors: tool, mould and pesticide manufacturing, are industrial sectors. Wu, Peng, Shi and Sia (2015) analyse Fortune 1000 companies that have a Website (or Website pages) in Chinese and explicitly make a distinction between companies that make industrial products and companies that sell consumer products. They find that the latter companies have a significantly higher Website localisation degree. In a paper of an altogether different nature, Bartikowski, Taieb and Chandon (2016) conduct a 2 x 2 x 2 between-subject experiment with participants from two ethnic groups in France – the French majority and the Tunisian minority. They find that the 'effects of culture-specific Website design on consumer Website evaluations are contingent on the Website product category' (p. 1083). In particular, participants preferred a Website design that aligns with the majority population, a 'French design', for consumer electronics, but for ethnic products a design with cultural markers of the Tunisian culture was deemed more appropriate.
Strengthened by the results of the latter two recent studies, this paper takes a different approach compared to the extant literature and investigates the cultural congruence of Websites from the perspective of a single international organisation. Holding the company constant not only filters out sectoral distortions, but also neutralises possible biases linked to company culture. Indeed, over time companies develop a corporate culture that involves specific values, specific symbols, a specific tone of text, etc. This culture impacts the marketing stimuli that the company uses (Picken, 1987), potentially including the design of its Website. A Global 500 company may attach more value to status, and as a result its site might display more pictures of the Chief Executive, an item linked to high power-distance (Chang, 2011). Both industry sector and corporate culture may thus very well distort the measurement of the cultural congruence of Websites. A re-examination of the issue in the more controlled research set-up of a single international company therefore seems warranted, especially since the literature does not agree on whether Websites reflect (all aspects of) culture.
Additionally, existing studies have never investigated precisely to what extent national culture is reflected in Websites, nor have they tried to explain the deviations between actual and reflected culture. The reason is that the latter type of analysis only makes sense when investigating a large set of countries and cultures, rather than just two to four. The data set in the present paper covers sixty-one countries. This not only allows us to perform regression analyses in an attempt to explain deviations, it also allows us to test the hypotheses on cultural congruence in a more rigorous way, by computing correlations between reflected and actual country-level cultural scores. Indeed, the t-tests that are de rigueur in the literature can only determine whether or not Websites aimed at different cultures are, on average, significantly different; they cannot determine whether and to what degree the culture reflected in individual sites actually matches the targeted country cultures, a facet that correlations do capture.
Finally, very few studies have analysed the international Website design strategy of multinational companies. So far, only one study has examined whether managers in headquarters are really concerned about how the company’s Websites are designed across countries, or whether it is mostly a decentralised issue where local marketing managers/Website developers make most of the decisions. Singh et al. (2010) quantify, by means of a survey, the level of attention that managers in sixty-five Fortune 500 companies have for localisation. Singh et al. find that in most headquarters cultural congruence is indeed an important concern. They also find that a managerial focus on localisation correlates positively with the relative importance of localised content in the German Websites of the investigated American companies. Although Singh et al. thus provide indications that some international companies are aware of the need for cultural congruence in Websites, the issue nevertheless remains largely under-investigated. Okazaki and Skapa (2008) and Wu et al. (2015) explicitly call for studies to fill the void.
The case: Honda Cars
The single international organisation of which the international Website design strategy is scrutinised in the present paper is Honda Motor Co., and more precisely its automotive division. Honda Cars was chosen for two reasons. For one, we needed a company with a large number of country Websites. Secondly, in the automotive industry brands are very important for consumer decision making. In their cross-country survey, Fischer, Völckner and Sattler (2010) found that, on average, medium-sized cars have the highest brand relevance value of all categories, even slightly higher than cigarettes. Also important for our purposes is that, unlike for most categories, the brand relevance of cars consistently ranks high in all five countries surveyed (France, Japan, Spain, the United Kingdom and the United States).
The following subsections provide more details about Honda Cars and its Website design strategy. Information about the latter was obtained from interviews with senior marketing managers.
Corporate culture
Honda Motor Co. is an international company of Japanese origin, with a long tradition dating back to 1948. The company mainly manufactures and sells cars, motorcycles, and power products such as lawn mowers. Each product category forms a separate division, Honda Cars being one of them. More recently Honda has also ventured into advanced technologies with projects such as HondaJet (an aeroplane) and Asimo (a humanoid robot). With these moves, Honda gives expression to its global slogan ‘the power of dreams’. Honda’s Websites clearly reflect the company background; design elements referring to Japan (such as the colour red), to tradition, and to innovation are omnipresent.
In the Honda corporate culture, central beliefs are ‘respect for the individual’ and ‘the three joys of buying, selling, and creating’. These central values are also recurring themes in Honda Websites. ‘Respect for the individual’ conveys that Honda recognises the unique character and ability of each and every person. ‘The three joys’ reflects the desire that every individual who comes in contact with the company has a joyful experience, whether they are a customer, a salesperson or a coworker (Honda, 2010).
Industry sector
Honda is a truly global company. At the time of the data collection, Honda was active in six continents and 133 countries. However, to hold the industry sector constant (as justified in the previous section), the present research focuses on the 124 countries in which the car division was active according to the global Honda Website.
Corporate strategy towards cross-country Website design
To learn about Honda Cars’ strategy with regard to international Website design and investigate the extent to which this strategy takes into account culture, we interviewed three Honda marketing officials. Two interviews took place in 2009 and a third, follow-up interview was carried out in 2016. All interviews were of an open, non-structured nature. The first interviewee was marketing manager at the European headquarters, responsible for the marketing strategy in Europe for all forms of communication. The interview revealed that Honda Cars had, at the time, no centralised policy concerning Website design (neither globally nor per continent). To quote the interviewee: ‘We don’t have a common Website [template]'. The local branches, or, in some cases the regional offices (see below), created their own Websites. ‘Any country [region] in Europe has its own responsibility’. Central guidelines did exist, but they were very limited in both number and scope, and only concerned elementary items, such as the colour and placement of the Honda Cars logo. ‘Centrally we only supply information that might be useful for them [the regional/national offices] to insert in the Website'. ‘There are guidelines but very basic'. Furthermore, when national or regional offices deviated from the guidelines, headquarters did not undertake any action: ‘At the moment there is [a] kind of anarchy’.
When asked about the impact of cultural congruence on Website effectiveness, the interviewee appeared to be unaware of the phenomenon. Cultural congruence was clearly not an important issue for the company. The interviewee highlighted that the many Honda Cars Websites in Europe were all very different. But he believed that this was due to different managers and Website developers having different approaches towards Website design. In other words, he was convinced that the different sites reflected the individual tastes of the managers rather than different cultures: ‘The local taste is interpretational’. The interviewee did not think that having different design styles in different countries would improve effectiveness. He was even of the opinion that having a more controllable policy was an important goal for the future.
‘We discovered we have around twenty-one Websites in Europe plus additional microsites…’ ‘They are all very different’. ‘They reflect the local tastes, because they are managed locally'. He indicated that in the future Honda might come to a more structured and centralised approach but was unclear on precisely how Honda would bring this about. One option under consideration was to introduce a common Website template, based on the average European taste, with some room for local adaptations:
We might consider, in the future, to have one Website [template]… If there were a common Website [template] we could say 80% of the Website must follow these rules, then you have 20% local taste. This would be fine… We have plans to follow up whether they [the local national and regional offices] respect the [central] guidelines.
The second interview was with a marketing officer of Honda Cars, region South-Europe (Spain, Italy, France). This interview revealed that those at the regional office were aware of the possible impact of culture on Website performance. In line with this, although the regional office provided a template to the local branches, local marketing employees were given considerable flexibility to adapt and complete the Website as they saw fit (see Figures 1, 2, and 3). ‘Eighty per cent of the content is similar among the three countries, meaning that 20% is made of local development’. ‘Each text/image can be changed locally’. The interviewee stressed that local adaptations could involve the whole of the Website: ‘this impacts the language, the colours of products…’ She thought this autonomy was necessary as Internet users in different countries have different preferences: ‘Interest is different among the countries… on wide subjects such as environment, social networks…’. This said, the interviewee also mentioned that managers at headquarters were in the process of instigating stricter and more wide-ranging guidelines on Website design. According to the interviewee, these guidelines risked destroying the Websites as they existed at that time. ‘It will be difficult to comply with them [the stricter guidelines] without destructing [sic] the whole Website'.
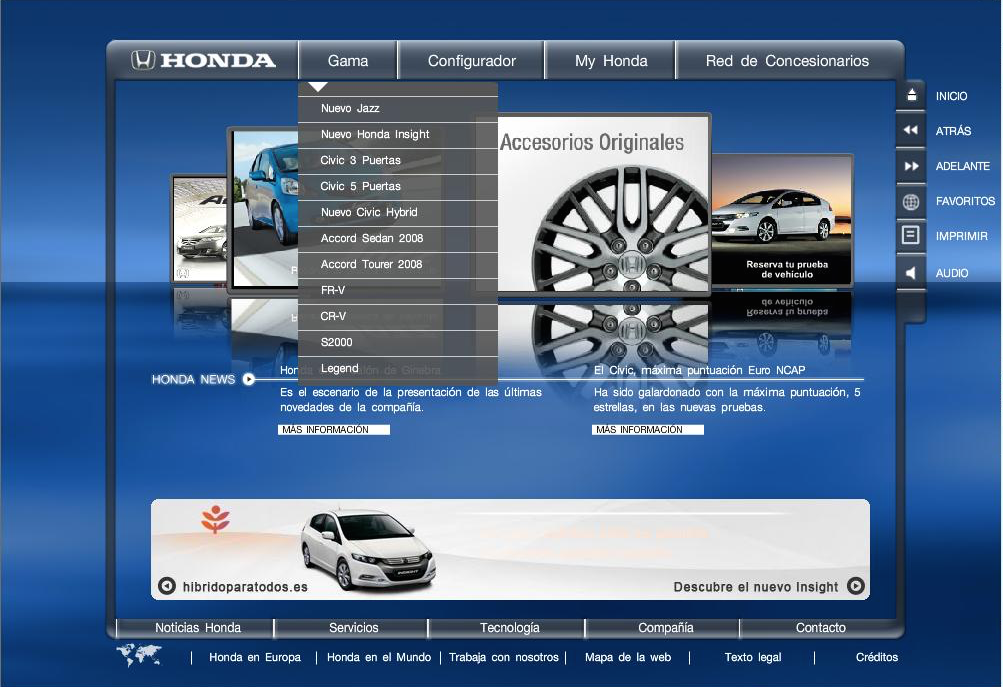
Figure 1: Welcome page of Honda Cars Spain, 2009
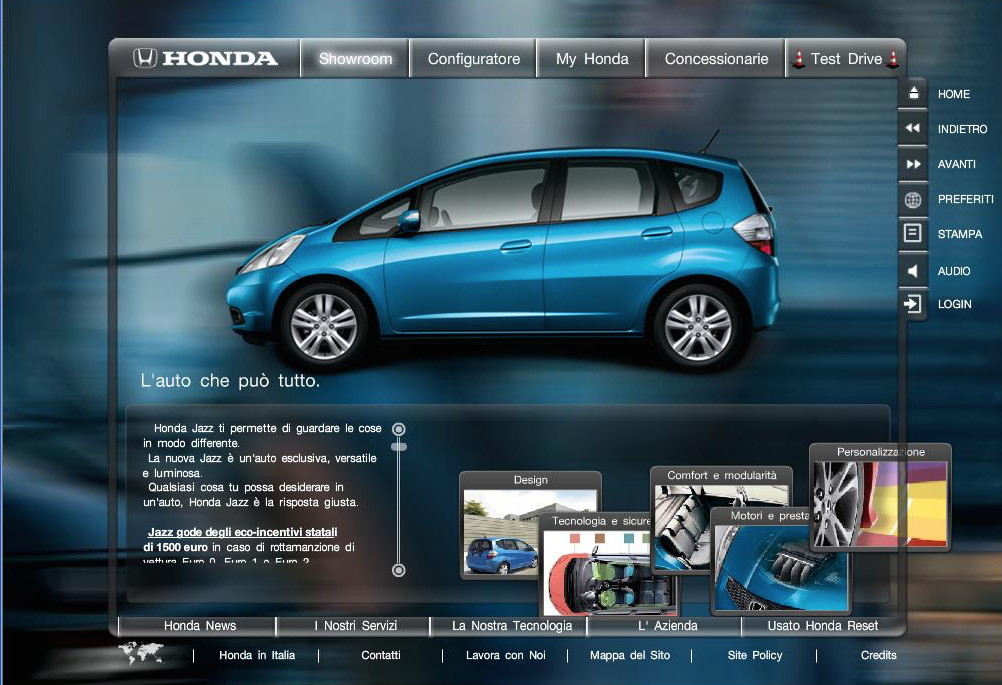
Figure 2: Product page, Honda Cars Italy, 2009
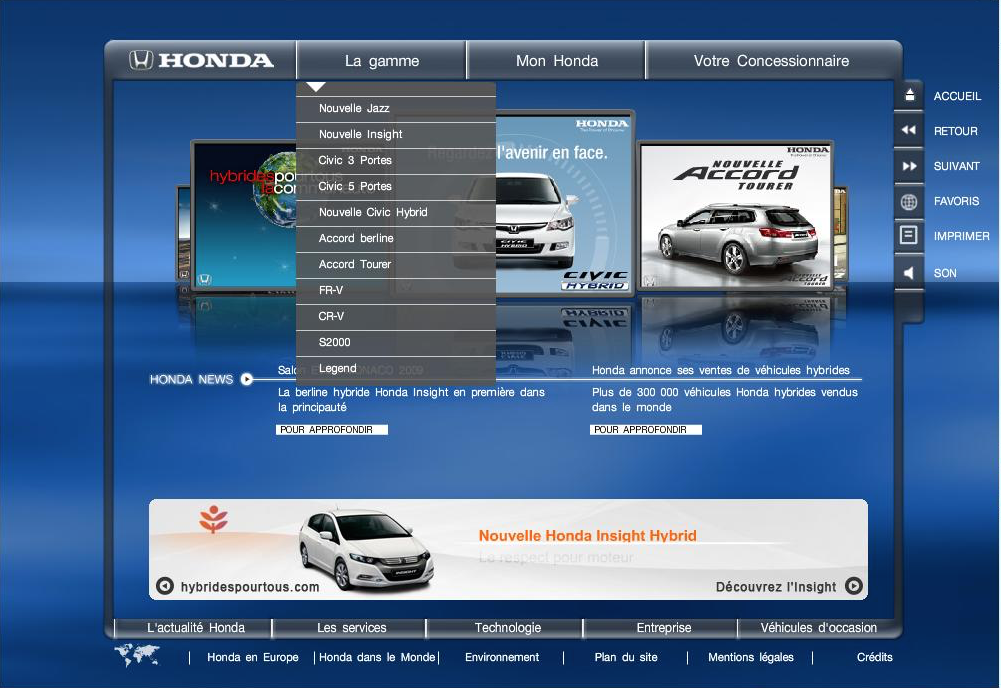
Figure 3: Welcome page of Honda Cars France, 2009
A third, follow-up interview carried out in 2016 confirmed that Honda had in the meantime made the shift towards a more centralised Website design for Europe. However, the process appears to have taken quite some time and the transition was not a big bang: the first Websites in the uniform layout came online only in the second half of 2013, with some countries following only in spring 2015. The current generation of Websites; the award-winning Honda Digital Platform, created by DigitasLBi in London, was launched in late 2015. Aside from local marketing campaigns, local adaptations only concern product highlights and placing. They should not exceed 30-40% of the site and need approval by general headquarters. The general layout always stays the same. With the exception of Switzerland, most European countries now work with this platform.
The overall conclusion is that, in 2009, managers at the European headquarters of Honda Cars did not appear to see culture as an important element of their international Website design process. The creation of the Websites usually took place at the level of individual countries, rather than at headquarters, and centralised guidelines were basic, leaving room for marketing managers and Website developers belonging to the local culture to (consciously or unconsciously) translate their own culture into the Website. Interestingly, certain regional offices, such as the office for South-Europe, did actively interfere in the management of the sites in their country cluster. At this level, managers did appear to be aware of the importance of cultural congruence. The regional offices therefore allowed the local branches to give their sites a local look-and-feel. In short, local managers and Website developers were given the flexibility by both central and regional headquarters to design or redesign the local Websites according to their own judgments. The present paper tests quantitatively whether these creations or adaptations by local branches effectively resulted in more culturally congruent Websites. This question has become more interesting now that a strategy shift has taken place towards a more uniform Website design.
Theoretical background, research questions and hypotheses
Hofstede and Hofstede (2004) define culture as the ‘collective programming of the mind’, formed by core values that distinguish members of one category (e.g., a nation) from members of another category. In quantitative, structured cross-cultural research, cultural classifications serve as a nomological structure that enables the development of hypotheses regarding systematic variations between cultures (Smith, Dugan and Trompenaars, 1996; Steenkamp, 2001). Several academics have successfully developed cultural classifications and have classified countries accordingly, by rating them on the composing dimensions. Two of the most prominent classifications are those of Hofstede (1980, 1994, 2001) and of Hall (1976).
While Hofstede’s classification has received a lot of criticism as to its initial development, overlooked cultural dimensions and different aspects of its operationalisation, such as the level of analysis (Dimitrov, 2014; Shaiq, Khalid, Akram and Ali, 2011), it has also received ample praise (Kirkman, Lowe and Gibson, 2017), and remains widely used in international business research (see the extensive overviews, with commentaries and research recommendations, by Kirkman, Lowe and Gibson, 2006 and Beugelsdijk, Kostova and Roth, 2017). Although according to the emic perspective the use of more qualitative culturally-bound variables may provide more elaborate thick descriptions’ and deeper insights into cultural phenomena (Nakata, 2009), the use of quantifiable etic dimensions of culture is specifically appropriate in cross-cultural research when a large number of countries are investigated and compared (Beugelsdijk et al., 2017). Moreover, both Hofstede and Hall’s cultural dimensions are documented and indexed for a large set of countries and have been operationalised and widely applied to guide the systematic analysis of Website localisation (Singh et al., 2003; Tigre Moura et al., 2016; Vyncke and Brengman, 2010), unlike other important classifications such as Schwartz (1994) and the GLOBE cultural value framework (House, Hanges, Javidan, Dorfmann and Gupta, 2004).
Hofstede (1980, 1994, 2001) captured cultural values in what was originally four dimensions and provided ratings for seventy-nine countries (see Hofstede (2016) and the Hofstede Insights Website for updates):
- Power distance: appreciation of social inequality and hierarchy;
- Individualism vs. collectivism: the degree to which ties between members of a community are loose (i.e., individualistic) or tight (i.e., collectivistic);
- Masculinity: the extent to which masculine values (such as assertiveness, competition, urge for achievement and success) prevail in comparison to more feminine values (such as life quality, nurturing, helpfulness and solidarity);
- Uncertainty avoidance: the degree to which individuals tend to avoid ambiguous situations and risks when making decisions.
Hall (1976), for his part, focuses specifically on cultural differences in expression and communication. He captures these differences in one single dimension, namely high-context vs. low-context cultures. No detailed ratings are available; Hall simply classifies countries as either low- or high-context (Hall, 1976; Singh and Matsuo, 2004). Members of high-context cultures have an implicit, indirect style of communication. Most of the information is already in the physical context or internalised in the person, while very little is in the coded, explicit, transmitted part of the message. In low-context cultures, communication is explicit or direct. The mass of the information is vested in the explicit code.
The present paper builds on these two cultural classifications to investigate two research questions. The first and most basic research question (RQ1) reads: Do the respective national Websites of one international company, Honda Cars, reflect the cultural differences between the countries they target? As explained in the second section, in view of the disagreement in the literature, a re-examination of the issue in the more controlled research set-up of a single company would seem to hold real promise.
As we rely on the classifications of Hofstede and Hall to measure culture, research question 1 translates into five hypotheses:
H1: Honda Cars Websites targeted at countries scoring high on power distance reflect a higher level of power distance in comparison to the company’s sites directed at countries scoring low on this dimension;
H2: Honda Cars Websites targeted at countries scoring high on individualism reflect a higher level of individualism (H2A) and a lower level of collectivism (H2B) in comparison to the company’s sites directed at countries scoring low on this dimension;
H3: Honda Cars Websites targeted at countries scoring high on masculinity reflect a higher level of masculinity in comparison to the company’s sites directed at countries scoring low on this dimension;
H4: Honda Cars Websites targeted at countries scoring high on uncertainty avoidance reflect a higher level of uncertainty avoidance in comparison to the company’s sites directed at countries scoring low on this dimension;
H5: Honda Cars Websites targeted at countries classified as high-context cultures reflect a higher level of high-context communication (H5A) and a lower level of low-context communication (H5B) in comparison to the company’s sites directed at countries classified as low-context cultures.
The second research question of the paper (RQ2) goes one step further and reads: What factors explain the deviations between national culture and the culture reflected in Honda Cars Websites? As pointed out, despite the growing body of literature, studies in the domain have so far only investigated whether or not Websites significantly reflect national culture, as in hypotheses H1-H5. The existing studies have never really analysed the magnitude of the deviations between the culture reflected in a Website targeted at a specific country on the one hand and the culture of that country on the other, let alone tried to explain the deviations. Most of the existing studies seem to implicitly assume that a significant relation between reflected and actual cultural scores must, by definition, point towards a deliberate process of cultural adaptation of the Websites. Only Singh et al. (2010) demonstrate that the observed cultural congruence is effectively (at least partly) the result of a conscious strategy. All other studies simply seem to assume that if Websites reflect the local culture, the localisation must have been deliberate. This is, however, by no means certain. Indeed, as our interviews with Honda Cars officials indicate, cultural congruence may partly be the result of an unconscious process. If the creation of the Websites takes place at the local level, the developers belong to the local culture, which may unconsciously permeate into their designs (Vyncke and Brengman, 2010). Also, especially in the absence of a detailed, structured localisation strategy, one even cannot exclude that part of the congruence is just coincidence.
The final part of our analysis therefore sets out to determine whether the cultural congruence (or the lack thereof) of the Honda Cars Websites is due to, amongst other determinants, factors that would point to, respectively, a deliberate strategy, an unconscious process or plain coincidence. Note that, whereas hypotheses H1-H5 are standard in the literature, the hypotheses in this part of our analysis are, given the dearth of relevant research so far, more of an exploratory nature and should be thought of as an attempt to open up a new line of research and, possibly, trigger theory building.
Starting with possible evidence of a deliberate strategy, the literature (Karacay-Aydin, Akben-Selçuk and Aydon-Altinoklar, 2010; Okazaki and Skapa, 2008) has already suggested market size and market potential as important factors but has not yet tested them. The reasoning here is that in (potentially) more important markets, companies will pay closer attention to, and invest more resources in, their marketing communications, including the local Website. This higher awareness should then result in a higher cultural congruence of the site. Hence, H6 reads:
H6: In countries that are more important for Honda Cars, the respective Honda Cars Websites will show a higher cultural congruence.
We consider the presence of such a positive relationship to be an indication of the existence of a conscious cultural adaptation strategy because the correlation is unlikely to be a coincidence. Crucially, however, the absence of such a correlation should not be seen as proof of the absence of a deliberate strategy. For one, our proxies of market importance (see below) may be inaccurate. More importantly, we have no information on, let alone a quantification of, local decision making within Honda Cars.
This said, the importance of a local Website for Honda Cars would seem to rest not only on the importance of the market that the site targets, but also on the weight of the site in the local mix of marketing communication instruments. This weight in all probability depends on the extent of Internet penetration in the country. Hence, H7 reads:
H7: In countries with higher Internet penetration the respective Honda Cars Websites will show a higher cultural congruence.
Again we interpret a significant positive relationship as an indication of a deliberate, conscious cultural adaptation strategy, and again a similar caveat applies.
Turning to variables that would point to an unconscious process, we have tried to construct a local-developer dummy that would capture whether a local or international developer/development team was behind a given site. Unfortunately, reliably retrieving this information for a sufficiently high number of sites proved impossible. As a result, the paper will not be able to demonstrate (or refute) the existence of an unconscious process.
Where coincidence is concerned, our reasoning was that in a country that has a middle-of-the-road culture, developers might unintentionally come up with a Website that happens to be culturally congruent (or at least for those dimensions where that country has an average score), but that this probability is lower the more the country is an outlier. Hence, H8 reads:
H8: In countries and for dimensions with more extreme cultural scores, the respective Honda Cars Websites will show a lower cultural congruence.
We see confirmation of this hypothesis as an indication that the observed cultural congruence is (partly) due to coincidence. A competing explanation is that developers might simply want to avoid extreme choices, such as making a Website too colourful or using too many price comparisons. Such extremeness aversion would also lead to lower congruence. A counterargument is that what seem extreme choices for an outsider may not feel so extreme for a developer embedded in the local culture.
Our regression analysis also uses two control variables, both of which try to capture possible constraints on the opportunities for cultural adaptation. The first is the age of the current Website. Over time Website design techniques have become more and more sophisticated (Cyr, 2014, p. 13-14), giving developers additional tools to refine their design (cf. Mushtaha and De Troyer, 2014). Older Websites might thus reflect culture to a lesser extent simply because cultural adaptation was not as easy. Interestingly, in their recent paper Wu et al. (2015) came up with a hypothesis that bears some resemblance to ours. They propose that ‘history length’ should associate positively with Website localisation degree. However, their justification is different. They argue that the longer foreign companies are present in a country, ‘the more knowledge and motivation the foreign companies may have to localize their Websites’ (Wu et al., 2015, p. 393).
The second control variable is a dummy for the existence of a template. Templates might limit local developers in translating local culture into the Website; cf. the 80/20-rule envisaged by Honda Cars (see the summary of the interviews in the previous section). Crucially, however, at the time of our research Honda Cars did not use a single, global template, but rather templates per region. If the countries in these regions are not too dissimilar in terms of culture and if the templates themselves are culturally sensitive, then the constraints might actually be minor. Stronger still, the templates might even increase cultural congruence. This is why, at the end of our analysis, we will zoom in on the impact of templates.
Data collection
Website and country sample
As mentioned previously, we initially wanted to consider all 124 countries in which the car division of Honda was active in 2009. However, Honda Cars proved to have a Website in only eighty-five of these. Also, in some of the latter, the official Honda distributor sold multiple car brands and had created a common Website for all of them. Because such sites can never express in full the true Honda culture and identity, we excluded them. This reduced the sample to seventy-nine dedicated Honda Cars Websites. Finally, we had to limit our analysis to those countries for which Hofstede provides cultural scores, which reduced the sample to sixty-one.
Table 1 provides descriptive statistics for the Hofstede cultural scores of the countries in the sample. Note that in his first study, in 1980, Hofstede scaled his scores to 100, but in later studies he added countries, and some of these scored higher than 100 (as can be gleaned from the value range for power distance, masculinity, and uncertainty avoidance). For ease of interpretation of, in particular, deviations between Website reflected cultural scores and country cultural scores, we decided to rescale the country cultural scores of Table 1 to an index on 100.
| Name | Definition | Possible values | Values in sample | Mean | St. Dev. |
|---|---|---|---|---|---|
| Power distance | Extent to which country displays power distance | 11-104 | 11-104 | 58.9 | 22.63 |
| Individualism | Extent to which country displays individualism | 6-91 | 6-91 | 43.7 | 24.88 |
| Collectivism | Extent to which country displays collectivism | Opposite of Individualism | Opposite of Individualism | — | — |
| Uncertainty avoidance | Extent to which country displays uncertainty avoidance | 8-112 | 8-112 | 66.6 | 23.92 |
| Masculinity | Extent to which country displays masculinity | 5-110 | 5-110 | 51.0 | 19.55 |
| High-context culture | Is the country a high-context country? | 1=LC & 2=HC | 1=LC & 2=HC | 1.3* | — |
| Low-context culture | Is the country a low-context country? | Opposite of high-context 2=LC & 1=HC | Opposite of high-context 2=LC & 1=HC | 1.7* | — |
| Note: * In other words, 30% of the countries in our sample are high-context, and 70% are low-context. | |||||
Content analysis
In 2009, shortly after the first two expert interviews, we performed an elaborate content analysis of the sixty-one Honda Cars Websites selected above. Content analysis is a research method that transforms communication content, through objective and systematic application of categorisation rules, into data that can be summarised and compared (Gerbner et al., 1969). Examples of such data are the space devoted to a topic, the frequency of occurrence of a word, symbol, or visual and the presence of dominant themes. This list of operational categories can also be called a coding framework (Singh and Matsuo, 2004). Important advantages of content analysis are objectivity, systematisation and quantification (Berelson, 1952; Kassarjian, 1977; Neuendorf, 2002).
The coding frameworks of Singh et al. (2003, 2005), Singh and Baack (2004), Singh and Matsuo (2004) and Singh, Kumar and Baack (2005) allow researchers to quantify the degree to which Websites display Hofstede’s and Hall’s cultural dimensions. The coding schemes measure the reflection of each cultural dimension by means of multiple Website items and evaluate the degree of depiction of each item on a 5-point Likert scale (1 = not depicted to 5 = prominently depicted).
In the present paper we use an integrated, encompassing coding framework, based on all aforementioned studies. This coding framework includes the following:
- Reflected power distance: presence of company hierarchy information, pictures of CEOs, quality information or assurance and awards, vision statement, pride of ownership appeal, proper titles;
- Reflected individualism (A) vs. collectivism (B): (A) presence of proper privacy statement, independence theme, product uniqueness, personalisation; (B) presence of community relations, clubs or chat rooms, newsletter, family theme, country-specific news, symbols and pictures of national identity, loyalty programs, links to local Websites;
- Reflected masculinity: presence of quizzes and games, realism theme, product effectiveness, clear gender roles;
- Reflected uncertainty avoidance: presence of customer service, secure payment, guided navigation, tradition theme, local stores, local terminology, free trials or downloads, customer testimonials, toll-free numbers;
- Reflected high-context (A) vs. low-context (B): (A) presence of soft sell approach, politeness and indirectness, aesthetics; (B) presence of hard sell approach, ranks or prestige of the company, use of superlatives, terms and conditions of use, explicit comparisons.
Two separate coders analysed all Websites; both were doctoral students trained in the coding scheme. The content analysis was elaborate in the sense that the Websites were exhaustively analysed (all tabs, all car models, etc.). Following Singh and co-authors (Singh et al.2003, 2005; Singh and Baack, 2004; Singh and Matsuo, 2004; Singh, Kumar and Baack, 2005), the percentage of agreement method (Kassarjian, 1977) was used to determine the coefficient of intercoder reliability, which proved to be 78%. This is acceptable and similar to the coefficients obtained by Singh and co-authors.
The coders were instructed to use Google Translate to assist them whenever the Website was in a language they did not master. To be clear: the coders were not asked and did not need to perform a real text analysis as such. They only needed to identify the presence (and gauge the prominence of), say, a privacy statement; they did not need to analyse its content. This approach proved feasible. Knowledge of the local language is not needed to identify and score many of the items, such as pictures of the CEO and symbols of national identity. Other items – such as the presence of secure payment or quizzes and games – could be recognised without much translation. Even detecting the use of superlatives, the closest the coders came to text analysis, proved possible by means of Google Translate. Note also that a limited number of the sites in the sample existed in more than one language. In such cases, the coders were instructed to check that the versions were identical apart from language, which was always the case. Hence, analysing one of the versions sufficed.
After evaluating, on a scale from 1 to 5, the depiction of all items of the coding framework, we first deleted the items with a corrected item-total correlation lower than 0.30 (Chu, 2009). The dropped items amount to eight: pride of ownership appeal (power distance), newsletter and links to local Websites (collectivism), secure payment, tradition theme, free trials or downloads, customer testimonials, and toll-free numbers (uncertainty avoidance). Subsequently we computed, for all Websites, average scores per cultural dimension. These average scores are thus a quantification of the degree of reflection of a specific cultural dimension in a Honda Cars Website. Table 2 provides descriptive statistics for the Website reflected cultural scores. As we did for the country cultural scores in Table 1, these scores too were rescaled to an index on 100. In particular, we first recoded the item scores from 1-5 to 0-4, then recalculated the Website reflected cultural scores, and ultimately rescaled these on 100.
| Dimension | Definition | Possible values | Values in sample | Mean | St. Dev. |
|---|---|---|---|---|---|
| Reflected power distance (5 items; α = 0.77) | Extent to which Website displays power distance | 1-5 | 1.20-4.60 | 2.7 | 0.83 |
| Reflected individualism (4 items; α = 0.70) | Extent to which Website displays individualism | 1-5 | 1.00-4.50 | 2.2 | 0.99 |
| Reflected collectivism (7 items; α = 0.70) | Extent to which Website displays collectivism | 1-5 | 1.33-4.50 | 2.6 | 0.76 |
| Reflected uncertainty avoidance (4 items; α = 0.63) | Extent to which Website displays uncertainty avoidance | 1-5 | 1.75-4.50 | 3.3 | 0.60 |
| Reflected masculinity (4 items; α = 0.64) | Extent to which Website displays masculinity | 1-5 | 1.50-4.50 | 2.6 | 0.65 |
| Reflected high-context culture (3 items; α = 0.90) | Extent to which Website displays high-context culture | 1-5 | 1.00-5.00 | 2.7 | 0.89 |
| Reflected low-context culture (5 items; α = 0.78) | Extent to which Website displays low-context culture | 1-5 | 1.40-4.40 | 2.6 | 0.89 |
T-tests and correlations
To test hypotheses H1-H5, we first performed t-tests on the Website reflected cultural scores. For each cultural dimension, the sixty-one Websites of the sample were divided into two groups: Websites targeted at countries scoring high and Websites targeted at countries scoring low. The hypothesis is confirmed when the t-test reveals that the difference is significant, and when the average Website reflected cultural score of the high group is higher than the average of the low group. If these conditions are fulfilled, the specific cultural dimension is considered to be significantly reflected in Honda Cars Websites. To categorise the countries as high/low in Hofstede’s classification, the average of the Hofstede country cultural scores for the respective dimension was used as the cut-off point (see Table 2). To categorise the countries as low- vs. high-context in Hall’s classification, we relied on Claes and Gerritsen (2007) and Hall (1976).
In addition to the t-tests, we also computed – again dimension per dimension – Pearson correlations between the Website reflected cultural scores and the country cultural scores. As explained in the second section, this allows for a more rigorous test of hypotheses H1-H5.
Regression analyses
Hypotheses H6-H8 are tested by means of linear regression analyses. The dependent variable is on the level of a specific cultural dimension and is given by the absolute value of the deviation between the reflected and the actual cultural score. In a robustness check, we also investigated aggregate cultural reflection. As a reminder, both reflected and actual scores were turned into an index on 100 (see remarks concerning Tables 1 and 2). The idea behind using absolute values of the deviations is that, for example, deviations of +30 and -30 would seem equally suboptimal. The use of percentage deviations would not seem appropriate because a deviation of 20 is equally troublesome when the target is 10 as when the target is 80. 80 is a higher cultural score, but by no means a better score. Note that our regression analyses only relate to Hofstede’s cultural dimensions. This is because Hall’s dimensions are only rated as dummies, which would make the interpretation of deviations difficult.
As can be seen in Table 3, the deviations can be quite high. For any of Hofstede’s dimensions, the reflected cultural scores can be 50 points or more off target. This raises the question of what causes these deviations. As explained, hypotheses H6 and H7 hold that lower deviations could be the result of a conscious cultural adaptation strategy, depending on, respectively, the importance of the local market for Honda and on the significance of the internet in the local marketing mix. At the same time, lower deviations might also be (partly) due to coincidence, with countries with a middle-of-the-road culture ending up with more culturally congruent Websites than countries with a more extreme culture (hypothesis H8).
| Dimension | Definition | Values in sample | Mean | St. Dev. |
|---|---|---|---|---|
| Deviation power distance | Absolute value of the difference between rescaled reflected power distance and rescaled power distance | 0.19-81.54 | 20.9 | 17.67 |
| Deviation individualism | Absolute value of the difference between rescaled reflected individualism and rescaled individualism | 0.50-52.50 | 17.6 | 14.73 |
| Deviation collectivism | Absolute value of the difference between rescaled reflected collectivism and 100-rescaled individualism | 0.00-59.83 | 22.2 | 17.41 |
| Deviation uncertainty avoidance | Absolute value of the difference between rescaled reflected power distance and rescaled power distance | 0.00-49.11 | 15.5 | 12.68 |
| Deviation masculinity | Absolute value of the difference between rescaled reflected masculinity and rescaled masculinity | 0.23-56.25 | 12.9 | 10.57 |
Lower deviations could also be the result of an unconscious process. However, as explained in the methodology section, we have been unable to construct a good indicator to test the latter, and thus cannot draw any conclusions in this respect. Finally, the Website developers might have faced constraints, such as limited availability of tools at the time of creation and/or the obligation to use a template.
Apart from the possible unconscious element, the determinants listed above were operationalised by means of the following proxies (always with data for the year 2009; see Table 4):
- for the importance of the market (for Honda): market potential, in number of car registrations for all brands in the country, and market size, in number of cars sold by Honda alone;
- for the significance of the Internet and Website: internet penetration;
- for extremeness of the culture: absolute value of the percentage deviation of the country cultural score from the average, per dimension; and
- for the control variables: age of the Website is measured as the time elapsed since the creation of the current Website; the existence of a template is captured by a simple dummy.
| Name | Definition | Source | Values in sample | N | Mean | St. Dev. |
|---|---|---|---|---|---|---|
| Market potential | Total number of car registrations in 2009 in a country | Bestsellingcarsblog.com * | 3,000-10,400,000 | 59 | 906,018 | 1,973,291 |
| Market size | Number of Honda cars sold in 2009 in a country | Data from Honda directly | 36,100-1,150,000 | 30 ** | 90,781 | 250,587 |
| Internet penetration | Per cent of population with access to internet, per country, in 2009 | International Telecommunication Union | 3.10-92.08 | 61 | 50.2 | 26.08 |
| Extremeness power distance | Absolute value of the difference between the AVG (rescaled power distance scores) and a country’s rescaled power distance score | Own data | 0.57-45.76 | 61 | 17.8 | 12.32 |
| Extremeness individualism | Absolute value of the difference between the AVG (rescaled individualism scores) and a country’s rescaled individualism score | Own data | 2.42-47.42 | 61 | 21.8 | 11.69 |
| Extremeness collectivism | Idem extremeness individualism | Own data | 2.42-47.42 | 61 | 21.8 | 11.69 |
| Extremeness uncertainty avoidance | Absolute value of the difference between the AVG (rescaled uncertainty avoidance scores) and a country’s rescaled uncertainty avoidance score | Own data | 0.53-52.15 | 61 | 17.8 | 11.56 |
| Extremeness masculinity | Absolute value of the difference between the AVG (rescaled masculinity scores) and a country’s rescaled masculinity score | Own data | 0.83-53.72 | 61 | 13.5 | 11.37 |
| Age of the Website | Time elapsed since the creation of the current Website (measured in semesters) | Own check through www.Web.archive.org | 1 (sem 1 of 2009)-12 (sem 1 of 2003) | 52† | 4.4 | 2.52 |
| Template | Is the country’s Website based on a template? | Own data | 0=NO & 1=YES | 61 | 0.4 | 0.50 |
| Notes: * Double-checked for most EU27 countries on www.acea.be and supplemented for twelve countries thrugh other sources such as www.eiu.com. ** We lost observations because our contacts at Honda could not provide us with data for all the countries. †We lost observations because not all sites have been sufficiently archived by the Wayback Machine. | ||||||
Results
This section reports the results of our successive analyses. The first subsection reports on the tests of hypotheses H1 to H5. From the second subsection onwards, the focus is on Hofstede’s cultural dimensions. To give the reader a feel for the data used in the regression analyses, the second subsection presents country rankings of the deviations per cultural dimension. The third subsection summarises the results of the regression analyses. Because the result obtained for the template dummy is something of a surprise, the final subsection zooms in on the Websites that were built on a template.
T-tests and correlations
The t-test comparisons of the Website reflected cultural scores provide support for hypotheses H1-H5. Table 5 shows that, regardless of the dimension, the Website reflected cultural scores are always significantly higher for countries that score high than for countries that score low. The most salient example is reflected individualism, with averages of 3.1 and 1.6 respectively. But the differences for all other dimensions are also significant at the 0.01 level.
The Pearson correlation coefficients listed in the final column of Table 5, which are all significant at the 0.01 level (and even at the 0.001 level), show (and to the best of our knowledge this is a first) that hypotheses H1-H4 also withstand a more thorough test that takes into account not average but individual Website and country scores. It is difficult to determine what level of correlation is good enough, but overall the correlations are fairly high, with individualism being the dimension that is reflected best in the Honda Cars Websites. In addition, let us stress that, unlike a string of papers listed in the literature overview, we find that differences in uncertainty avoidance between countries are also reflected, albeit to a lower extent. As suggested in the second section, perhaps we find a deviating result because we focus on a sector, the automobile industry, where this dimension happens to be more important. We see this result as underpinning our argument that the multi-sector studies in the field should explicitly take into account the specific nature of the sectors and their shares in the samples.
| Dimension | t-tests | Pearson coefficients | ||
|---|---|---|---|---|
| Websites of countries with high score Mean | Websites of countries with low score Mean | t-value | ||
| Reflected power distance | 3.0 | 2.3 | -3.42* | 0.42* |
| Reflected individualism | 3.1 | 1.6 | -7.23* | 0.72* |
| Reflected collectivism | 2.9 | 2.2 | -4.03* | 0.45* |
| Reflected uncertainty avoidance | 3.6 | 2.9 | -3.65* | 0.44* |
| Reflected masculinity | 3.2 | 2.3 | -5.49* | 0.57* |
| Reflected high-context | 3.1 | 1.7 | -6.92* | — |
| Reflected low-context | 3.3 | 2.3 | -4.82* | — |
| Note: * p ≤ .01 | ||||
Rankings of deviations
While the t-tests and especially the correlations demonstrate that culture is indeed reflected in Honda Cars Websites, the reflected and country cultural scores do not tally perfectly. This subsection therefore takes a closer look at the extent to which the reflected scores deviate from the country-level scores. Table 3 already showed that, for Hofstede’s dimensions, the deviations can be quite high. To give the reader a better idea of how the deviations vary, Table 6 lists, dimension per dimension, the top five countries where the Honda Cars sites had the smallest deviations (that is, the best performers) as well as the bottom five countries where the sites had the largest deviations (the worst performers). The numbers in brackets are the absolute deviations.
The table shows that the per-country deviations can be quite dissimilar across the different cultural dimensions: as many as eight countries (indicated in italics) appear amongst the best performers for one dimension but amongst the bottom performers for another. Together with the observation that the deviations are quite large, this clearly justifies a closer look at what factors influence these deviations. This is done on the level of individual cultural dimensions, as Table 6 suggests that different factors might be at play.
| Power distance | Individualism | Collectivism | Uncertainty avoidance | Masculinity | |
|---|---|---|---|---|---|
| Best |
1. Sweden (0.19) 2. Taiwan (0.77) 3. New Zealand (1.15) 4. Costa Rica (1.35) 5. El Salvador (1.54) … |
1. Colombia (0.50) 1. Venezuela (0.50) 3. Philippines (0.75) 4. Denmark (1.00) 4. Malaysia (1.00) … |
1. Belgium (0.00) 2. UAE (0.50) 3. Hungary (0.83) 4. Philippines (1.33) 5. South-Africa (2.50) … |
1. Ireland (0.00) 1. New Zealand (0.00) 1. Austria (0.00) 4. Japan (0.89) 4. Canada (0.89) 4. Norway (0.89) … |
1. Mexico (0.23) 2. Thailand (0.34) 3. South-Africa (1.02) 4. El Salvador (1.14) 5. Finland (1.36) … |
| Worst | 54. Portugal (50.58) 55. Bangladesh (51.92) 56. Ecuador (60.00) 56. Slovakia (60.00) 58. Romania (81.54) |
54. New Zealand (41.50) 55. India (41.75) 56. Poland (47.50) 57. Ireland (51.25) 58. Australia (52.50) |
54. Pakistan (52.67) 55. Bangladesh (55.00) 56. Romania (57.50) 57. Ecuador (58.67) 58. Panama (59.83) |
54. Philippines (35.71) 54. Vietnam (35.71) 56. Uruguay (45.54) 57. El Salvador (46.43) 58. Venezuela (49.11) |
54. Pakistan (26.70) 55. Hungary (30.00) 56. Norway (30.23) 57. UAE (40.23) 58. Slovakia (56.25) |
Regression analyses
Before going into the regression analyses, it is necessary to check the conditions. For all regressions, there is homoscedasticity of the errors and normality of the error distributions. Multicollinearity proved to be a problem for market size and market potential (r = 0.87; sig = 0.000), but this should not come as a surprise. The two variables are alternative proxies of market importance and were never meant to appear in the same regression in the first place. In our discussion of the results we will focus on market potential because the variable has more data points and, in general, a higher explanatory power.
Table 7 shows that, for four out of the five cultural dimensions of Hofstede, the model explains the variation in the dependent variable, the deviations, to a significant degree. The R2 ranges from 19.3% for masculinity to 43.3% for power distance. Note that the one dimension for which the R2 is disappointing – individualism – happens to be the one for which the Pearson correlation coefficient in Table 5 is the highest, and by a substantial margin. This suggests that the smaller the deviations for a specific dimension, the harder they are to explain, which is not illogical.
To start with hypothesis H6, market potential is not significant in any of the models. The same is true for market size (not reported). H6 is thus rejected. Our results do, however, provide support for H7. Internet penetration is significant and has the expected negative sign for three of the five dimensions, namely power distance, collectivism, and uncertainty avoidance. Taking H6 and H7 together, the evidence of a conscious, deliberate cultural adaptation strategy is thus mixed. Also, attempts with an interaction term between Internet penetration and market potential did not yield significant results. The evidence for H8 is also not univocal. Extremeness of the cultural score has a positive and significant coefficient in three out of the five models, namely for power distance, uncertainty avoidance, and masculinity. For these three dimensions, the deviations between Website reflected cultural scores and country cultural scores are thus significantly higher for countries with an extreme cultural score, or, in other words, lower for countries with a middle-of-the-road cultural score. For these dimensions part of the observed cultural congruence might thus be due to coincidence. Interestingly, two of these dimensions – power distance and uncertainty avoidance – are dimensions for which Internet penetration also proved significant. As a reminder, the analysis in Table 7 lacks a suitable proxy for the unconscious part of the cultural adaptation process.
| Deviation power distance | Β | Beta | t(sig) | R2 | Adj. R2 | F(sig) |
|---|---|---|---|---|---|---|
| Intercept | 28.147 | — | 4.301*** | 0.433 | 0.187 | 2.026* |
| Market potential | -0.000 | -0.086 | -0.615 | |||
| Internet penetration | -0.179 | -0.290 | -2.088** | |||
| Extremeness of the cultural score | 0.379 | 0.306 | 2.193** | |||
| Age of the Website | -1.140 | -0.185 | -1.334 | |||
| Template | 0.191 | 0.006 | 0.044 | |||
| Deviation individualism | Β | Beta | t(sig) | R2 | Adj. R2 | F(sig) |
| Intercept | 19.950 | — | 2.971*** | 0.058 | -0.049 | 0.540 |
| Market potential | -0.000 | -0.149 | -0.963 | |||
| Internet penetration | 0.065 | 0.116 | 0.774 | |||
| Extremeness of the cultural score | -0.102 | -0.082 | -0.524 | |||
| Age of the Website | -0.417 | -0.074 | -0.495 | |||
| Template | -3.789 | -0.132 | -0.876 | |||
| Deviation collectivism | Β | Beta | t(sig) | R2 | Adj. R2 | F(sig) |
| Intercept | 30.569 | — | 4.444*** | 0.253 | 0.168 | 2.978** |
| Market potential | -0.000 | -0.088 | -0.641 | |||
| Internet penetration | -0.311 | -0.477 | -3.586*** | |||
| Extremeness of the cultural score | 0.292 | 0.202 | 1.457 | |||
| Age of the Website | 0.193 | 0.030 | 0.223 | |||
| Template | 3.281 | 0.099 | 0.740 | |||
| Deviation uncertainty avoidance | Β | Beta | t(sig) | R2 | Adj. R2 | F(sig) |
| Intercept | 13.013 | — | 2.242** | 0.317 | 0.239 | 4.081*** |
| Market potential | -0.000 | -0.049 | -0.380 | |||
| Internet penetration | -0.189 | -0.366 | -2.902*** | |||
| Extremeness of the cultural score | 0.535 | 0.443 | 3.472*** | |||
| Age of the Website | 0.326 | 0.063 | 0.503 | |||
| Template | 2.667 | 0.101 | 0.781 | |||
| Deviation masculinity | Β | Beta | t(sig) | R2 | Adj. R2 | F(sig) |
| Intercept | 8.129 | — | 2.077** | 0.193 | 0.101 | 2.106* |
| Market potential | -0.000 | -0.072 | -0.517 | |||
| Internet penetration | -0.043 | -0.111 | -0.710 | |||
| Extremeness of the cultural score | 0.393 | 0.476 | 2.965*** | |||
| Age of the Website | 0.149 | 0.039 | 0.283 | |||
| Template | -0.159 | -0.008 | -0.057 | |||
| Note: * p ≤ 0.10, ** p ≤ 0.05, *** p ≤ 0.01 | ||||||
Where the control variables are concerned, both the age of the Website and the template dummy never have a significant coefficient. The result for age is in line with Wu et al. (2015), who find that the length of time an American Fortune 1000 company has been active in the Chinese market has no significant impact on the localisation degree of its Website. Wu et al. explain this lack of support for their hypothesis by pointing out that the role of Websites in companies’ strategies can be different: ‘For some companies, Websites are an important channel to communicate with local consumers and building brand image, while Websites are just a way to deliver basic information for other companies’ (2015, p. 399). This is another argument in favour of our single-company approach.
The absence of any impact of the second control variable is particularly interesting. In the case of Honda Cars, templates apparently did not constrain developers in translating local culture into the Website. This said, as mentioned when describing our case, one must keep in mind that Honda Cars used regional templates. If the cultural ratings of the countries in these regions are similar and if the templates themselves are culturally sensitive, then templates should not impose real constraints. This is precisely why the next subsection zooms in on the role of templates.
As signalled, we also performed a number of robustness checks. In a first test we pooled the data across dimensions and repeated the regression analysis on the aggregate level. This regression proved significant (R2=0.119; Adjusted R2=0.101; F(sig)=6.568 p ≤ 0.01) and, in line with the models for power distance and uncertainty avoidance, provided support for both H7 (on Internet penetration) (t(sig)=-3.778 p ≤ 0.01, Beta=-0.233) and H8 (extremeness of the cultural score) (t(sig)=4.514 p ≤ 0.01, Beta=0.278). As such, these results again suggest that, overall, low observed deviations between actual and reflected cultural scores are partly the result of a conscious effort and partly due to coincidence.
The country rankings of the absolute deviations in Table 6 provided the inspiration for the second robustness check. Focusing first on the worst performing sites, one can see that four out of the five dimensions (the exception is collectivism) might have one or more outliers. For power distance, for example, the potential outliers among the worst performers are Ecuador, Slovakia and especially Romania. Conversely, among the best performing sites, two out of the five dimensions (namely power distance and masculinity) might have at least one outlier. To continue with the same example, for power distance Sweden could be an outlier. For this reason, in a second test we reran the regressions of Table 7 after having eliminated all potential outliers. This obviously left the results for collectivism unchanged, as this dimension did not seem to have any outliers. The removal of outliers also did not affect the results for uncertainty avoidance (the strongest model), but the regressions for both power distance and masculinity (not surprisingly the weakest models) lost their overall significance. This said, our identification of potential outliers was quite strict. For example, the results for the power distance model remain unchanged if one only removes the biggest outlier, namely Romania.
A final test consisted of a similar reinspection of the results of the regression on the aggregate level. Reassuringly, leaving out all outliers identified above did not affect the results of the pooled regression which confirms that, in general, the data support H7 and H8.
The impact of regional templates
Finally, Table 8 compares the distribution of the country cultural scores and the Website reflected cultural scores (both rescaled) for: (1) all Websites, (2) Websites without a template, and (3) two subsets of Websites in regions with a template. For the latter, we focus on North-Europe and Nordic Europe because they are larger regions than South-Europe and because the interviews at Honda Cars confirmed the deliberate use of templates.
The North-European and the Nordic-European examples yield two explanations as to why the regional Honda templates did not constraint the reflection of culture in the local Websites. First of all, the examples support our assumption that templates are designed for a set of countries that are culturally similar. The standard deviations of the cultural scores within the two regions are nearly always smaller than in general, or for countries not belonging to a region with a template. Secondly, in the few cases where the standard deviation is larger in North- or Nordic-Europe (see underlined numbers), the template does not seem to discipline local developers too much, as the standard deviation of the reflected cultural scores stays rather large. This suggests that the templates offered enough leeway to local developers to translate differences in cultural scores into the Website.
| Dimension | All Websites St. Dev. N=61 | Without templates St. Dev. N=35 | With North-Europe template St. Dev. N=4 | With Nordic European template St. Dev. N=5 |
|---|---|---|---|---|
| Rescaled country cultural scores | ||||
| Power distance | 21.76 | 21.10 | 22.43 | 7.65 |
| Individualism | 24.88 | 24.79 | 10.58 | 5.77 |
| Collectivism | 24.88 | 24.79 | 10.58 | 5.77 |
| Uncertainty avoidance | 21.36 | 21.69 | 16.63 | 15.35 |
| Masculinity | 17.78 | 13.30 | 10.02 | 9.91 |
| Rescaled Website reflected cultural scores | ||||
| Reflected power distance | 20.71 | 22.89 | 21.60 | 7.07 |
| Reflected individualism | 24.65 | 25.29 | 17.95 | 8.15 |
| Reflected collectivism | 18.99 | 19.52 | 11.28 | 6.18 |
| Reflected uncertainty avoidance | 15.05 | 13.42 | 11.83 | 11.35 |
| Reflected masculinity | 16.36 | 18.50 | 19.43 | 5.59 |
Discussion and conclusions
Judging from the empirical evidence summarised by Vyncke and Brengman (2010) and Tigre Moura et al. (2016), culturally congruent Websites (e.g., a French Website reflecting French culture) outperform culturally incongruent Websites on several performance measures, namely usefulness, ease of use, positive attitudes, positive intentions and overall effectiveness. Culturally congruent Website design should therefore be an important business consideration for any international company.
Several content-analytic studies have investigated whether real-life Websites are effectively culturally congruent. While several studies confirm this hypothesis, other authors find that sites are not culturally sensitive, or not on all aspects. The present paper therefore re-examined the research question in a more controlled research set-up. Examining the Websites of a single international company allowed us to control for industry sector, corporate culture and corporate Website design strategy. Studying Websites across a wide range of countries also makes it possible to test for cultural congruence in a more thorough way, by computing correlations rather than just performing rough t-tests. This also allows us to investigate two under-researched issues, namely whether company policy towards cross-cultural Website design dovetails with actual practice, and whether the observed deviations between actual and reflected culture can be explained.
The paper analyses sixty-one national Websites within Honda Cars. T-test comparisons and Pearson correlations demonstrate that the hypotheses on cultural congruence (H1-H5) can be accepted. More specifically, the Websites significantly reflect all four original Hofstede dimensions examined (power distance, individualism vs. collectivism, masculinity and uncertainty avoidance) as well as Hall’s dimension (high-context vs. low-context), albeit not to the same extent. The dimension that is reflected best is individualism, with a correlation coefficient of no less than 0.72.
Although we find that Honda Cars Websites take into account local culture, looking at the extent to which reflected cultural scores deviate from country-level scores reveals that these deviations can nevertheless be surprisingly large. For all of Hofstede’s dimensions, the reflected cultural scores can in some cases be fifty points or more off target. However, as already pointed out when discussing our results, it is not easy to determine what level of correlation is ‘good enough’, especially not in the light of the results of Bartikowski and Singh (2014). In their article, Bartikowski and Singh argue for a more nuanced approach to the positive effects of Website cultural congruence because extant claims neglect the moderating roles of brand equity and purchasing risk. In an experimental study where they manipulate Web pages retrieved from the French-language version of the Website of Hewlett-Packard, which in 2010 was among the top ten global brands, Bartikowski and Singh find, for example, that in the strong brand equity condition Website cultural congruence has no positive effect on attitude to the site. Bartikowski and Singh (2014, p. 247) even suggest that a strong equity brand might actually suffer in the presence of higher Website cultural congruence, ‘because the display of foreign cultural markers could dilute the brand’s identity’. They therefore call for research into what constitutes an ‘appropriate’ level of cultural adaptation. Note in this respect that in 2009, the year in which we collected our data, Honda ranked 18th in Interbrand's Best Global Brands report (2016).
Whatever the case, it is interesting to investigate the determinants of the observed deviations between Website reflected cultural scores and country-level cultural scores, and in this way improve our understanding of Website cultural congruence. To do so, we use regression analysis to try to determine, dimension per dimension, whether the observed level of cultural congruence is the result of a deliberate effort, just coincidence or a combination of the two. We find that the variables that would point to the presence of a deliberate strategy (market importance and internet penetration) are significant for, respectively, none and three of the five dimensions. In particular we find that the higher the Internet penetration in a country, the more culturally congruent the Honda Cars Websites are for power distance, collectivism and uncertainty avoidance, as well as on the aggregate level. The evidence of a conscious, deliberate cultural adaptation strategy is thus somewhat mixed, but does not entirely clash with the results of Singh et al. (2010), who, by means of a survey, find evidence of the existence of a conscious approach.
The evidence pointing towards coincidence is also mixed. Extremeness of the cultural score has a positive and significant coefficient in three out of the five models, namely for power distance, uncertainty avoidance and masculinity. (Interestingly, two of these dimensions are dimensions for which Internet penetration also proved significant.) In other words, for three out of five dimensions – as well as on the aggregate level – the paper finds that the more a country is a cultural outlier, the lower the congruence of the local Honda Cars Website. This is tantamount to stating that the cultural congruence of Honda Cars Websites is higher when a country has a middle of the road score for a specific dimension. As explained, we take this to be evidence of unintentional congruence.
A final interesting (and at first sight somewhat counterintuitive) result is that templates do not appear to overly constrain local developers in creating culturally congruent Websites at the national level. Importantly, however, this would only seem to be the case under two conditions: (1) the templates relate to a group of culturally similar countries and (2) the templates offer enough leeway to local developers.
Our paper also has important implications for corporate strategy. Given that cultural congruence has a positive impact on the performance of Websites (Tigre Moura et al., 2016; Vyncke and Brengman, 2010), managers, marketers and Website developers should be aware of the phenomenon. Our interviews indicate that this is not always the case. The European headquarters of Honda Cars even considered imposing a centralised European template, which might ruin the observed cultural congruence of its Websites as the template would apparently be based on average consumer preferences towards Website features and would probably include 80% common and 20% local content. One could interject that the approach that was in use in 2009 at the regional levels within Honda Cars Europe was not dissimilar. However, a template based on average tastes in, for example, the region South-Europe (Spain, Italy, and France; that is, broadly similar cultures) is more likely to allow for sufficient cultural adaptation at the local level than a template based on the average tastes of the whole of Europe (covering a diverse set of cultures; for example, both Northern and Southern cultures).
One suggestion is therefore that marketing managers at the headquarters of international companies who want to align cross-cultural Website design practices, do so while taking cultural differences into account. Templates should be made at an appropriate level of aggregation, grouping only countries with reasonably similar cultures. Additionally, some flexibility should be incorporated in the templates to allow for local additions and adaptations. Marketers and Website developers closer to the consumer would seem to have a better understanding of what the market needs and are therefore more likely to (consciously or unconsciously) create a Website that better reflects the local preferences. Only this type of strategy can jointly optimise the efficiency of the Website design process and the effectiveness of the Websites. This strategy is known in the broader literature as regionalisation (Rugman, 2003). In a recent article, Cyr (2013, p. 382) calls it ‘cluster localization’ and points out that it ‘serves the purpose of providing some degree of cultural adaptation to user groups, but with a substantial cost savings (sic) to online vendors over deep localization procedures’.
To the best of our knowledge, besides the present paper the only other paper that presents tentative evidence that a regionalised Web design strategy might work for ‘countries that are geographically close and have low cultural distance’ is a recent paper by Singh et al. (2017, p. 70). Singh et al. examine forty local South Korean corporate Websites, eighty Websites of American multinationals (forty designed for Korean consumers and forty designed for American consumers) and eighty Websites of Japanese multinationals (again forty directed at the Korean market and forty at their home market). In particular, Singh et al. find that the cultural depictions on the local Korean Websites are similar to the cultural depictions on the sites that the selected Japanese multinationals had designed for their Japanese home market. This suggests that Japanese companies need not customise their sites for the Korean host market very extensively. However, Singh et al. (2017, p. 78) stress that ‘future studies need to be undertaken to further validate these findings in other culturally similar countries’. This would indeed seem to be a promising avenue for further research.
There is also ample room for research in other directions. For example, we have interviewed only three managers of the company under consideration, which might limit the reliability of the information gathered (even though it was cross-checked by means of content analysis). Studies that interview more decision makers, all the way to the Website developers, would be most welcome. As far as we know, there is no study that maps the entire intercultural Website design process of a specific company.
Another possible extension of our research would consist of repeating the exercise with the current generation of Honda Cars Websites, especially with an eye on gauging the effect of the shift to a more centralised Website design for Europe. More generally, quite apart from our case, there is a clear dearth of longitudinal studies in the domain. The recent review by Tigre Moura et al. (2016) makes mentions of only one, whereas they correctly stress that ‘Web design features are impermanent, constantly changing over time’ (Tigre Moura et al., 2016, p. 312).
A fourth research opportunity consists in strengthening the theoretical background of our hypotheses H6-H8. As stressed, these hypotheses were of an exploratory nature. But given that we find significant results for both H7 (on the importance of the Internet) and H8 (on the extremeness of cultural scores) we have reason to believe that this is a promising avenue, although common sense would dictate that the impact of Internet penetration should fade over time. In the same vein, one could also look for additional factors that might explain the deviations between Website reflected cultural scores and country cultural scores. Again, the present study is only a first attempt and the list of explanatory factors is probably incomplete. In particular, future studies might be able to better capture phenomena of unconscious cultural adaptation.
As we are the first to opt for a single-company quantitative approach, a final, obvious research opportunity would be to collect and analyse data on other international companies. We find that management at Honda Cars headquarters did not deliberately take into account cultural adaptation and that Website strategy was a largely decentralised issue. However, Singh et al. (2010) find that for the majority of the companies in their American sample, local Website design was a joint effort between headquarters and local subsidiaries and cultural adaptation was a deliberate strategy. Approaches would therefore appear to differ substantially across companies. Additional case studies of international companies varying not only in Website design strategy, but also industry and origin (global HQ in Japan, USA, etc.) should help improve the profession’s understanding of the issue.
Acknowledgements
The authors would like to thank all the employees at Honda who have cooperated and especially Sofie Mollekens without whom this work would never have been possible. They also thank Kalina Mikolajczak-Degrauwe for helping with the data collection and Lieselot Vanhaverbeke and Kim Willems for comments on earlier versions.
About the authors
Femke Vyncke holds a Master's Degree in Applied Economics: specialisation Commercial Engineer from the Solvay Business School of the Free University of Brussels. Currently she is Research Director at Haystack International, Research Consultancy. She is a specialist in qualitative research with an international scope, but with a special interest in hybrid methodologies involving quantitative, sensorial and other techniques. She has conducted projects in the domain of UX and Website design, both on the academic and the business side of research. She can be contacted at femke.vyncke@haystack-international.com.
Leo Van Hove is a Professor of Economics at the Department of Applied Economics of the Vrije Universiteit Brussel (Free University of Brussels), where he teaches courses in monetary economics, research methods, and economics of information. He is also a visiting research professor at the Nicolaus Copernicus University in Toruń, Poland. His current research interests include payment instruments, network effects, e-commerce, and access to finance. He can be contacted at Leo.Van.Hove@vub.be
Malaika Brengman (PhD in Applied Economics, University of Ghent) is Associate Professor at the faculty of Social Sciences & Solvay Business School at the Vrije Universiteit Brussel (VUB), where she teaches (digital) marketing, consumer behaviour and market research. Her scientific research generally focuses on shopping motivations and behaviour in offline as well as online retail contexts, with a special attention to new technologies and their impact on consumer behaviour. She can be contacted at Malaika.Brengman@vub.be
References
- Barber, W. & Badre, A. (1998). Culturability: the merging of culture and usability. In Proceedings of the Fourth Conference on Human Factors & the Web, Basking Ridge, NJ. (10 pp.). Retrieved from http://zing.ncsl.nist.gov/hfWeb/att4/proceedings/barber/index.html (Archived by WebCite® at http://www.Webcitation.org/6hh8m29j2)
- Bartikowski, B. & Singh, N. (2014). Should all firms adapt Websites to international audiences? Journal of Business Research, 67(3), 246–252.
- Bartikowski, B., Taieb, B. & Chandon, J.-L. (2016). Targeting without alienating on the Internet: ethnic minority and majority consumers. Journal of Business Research, 69(3), 1082–1089.
- Berelson, B. (1952). Content analysis in communication research. Glencoe, IL: Free Press.
- Beugelsdijk, S., Kostova, T. & Roth, K. (2017). An overview of Hofstede-inspired country-level culture research in international business since 2006. Journal of International Business Studies, 48(1), 30-47.
- Brengman, M. (2007). Cultural differences reflected on the internet: a comparison between Belgian and Dutch e-commerce Websites. Paper presented at the Symposium of the European Communication Research and Education Association (ECREA), Brussels, Belgium. Retrieved from http://www.slideshare.net/ibbt/ecrea3k-brengman-malaika-paper (Archived by WebCite® at http://www.Webcitation.org/6hh968lq8)
- Calabrese, A., Capece, G., Di Pillo, F. & Martino, F. (2014). Cultural adaptation of Web design services as critical success factor for business excellence: a cross-cultural study of Portuguese, Brazilian, Angolan and Macanese Web sites. Cross Cultural Management, 21(2), 172-190.
- Callahan, E. (2005). Cultural similarities and differences in the design of university Websites. Journal of Computer-Mediated Communication, 11(1), article 12. Retrieved from https://onlinelibrary.wiley.com/doi/epdf/10.1111/j.1083-6101.2006.tb00312.x
- Chang, H.-J. (2011). Multinationals on the Web: cultural similarities and differences in English-language and Chinese-language Website designs. Journal of the American Society for Information Science and Technology, 62(6), 1105–1117.
- Chu, K.-M. (2009). A study of members' helping behaviors in online community. Internet Research, 19(3), 279-92.
- Chun, W., Singh, N., Sobh, R. & Benmamoun, M. (2015) A comparative analysis of Arab and U.S. cultural values on the Web. Journal of Global Marketing, 28(2), 99-112.
- Claes, M.-T. & Gerritsen, M. (2007). Culturele waarden en communicatie in internationaal perspectief. [Cultural values and communication in an international perspective]. Bussum, The Netherlands: Coutinho.
- Cyr, D. (2013). Website design, trust and culture: an eight country investigation. Electronic Commerce Research and Applications, 12(6), 373-385.
- Cyr, D. (2014). Return visits: a review of how Web site design can engender visitor loyalty. Journal of Information Technology, 29(1), 1-26.
- Cyr, D. & Trevor-Smith, H. (2004). Localization of Web design: an empirical comparison of German, Japanese, and United States Web site characteristics. Journal of the American Society for Information Science and Technology, 55(13), 1199-208.
- De Troyer, O., Mushtaha, A., Stengers, H., Baetens, M., Boers, F., Casteleyn, S. & Plessers, P. (2006). On cultural differences in local Web interfaces. Journal of Web Engineering, 5(3), 246-65.
- Dimitrov, K. (2014). Geert Hofstede et al’s set of national cultural dimensions - popularity and criticisms. Economic Alternatives, 31(2), 30-60.
- Fischer, M., Völckner, F. & Sattler, H. (2010). How important are brands? A cross-category, cross-country study. Journal of Marketing Research, 47(5), 823-839.
- Gerbner, G., Holsti, O. R, Krippendorff, K., Paisley, W.J. & Stone, P.J. (1969). The analysis of communication content: developments in scientific theories and computer techniques. New York, NY: Wiley.
- Hall, E. T. (1976). Beyond culture. New York, NY: Doubleday & Company.
- Hofstede, G. (1980). Culture’s consequences: international differences in work related values. Beverly Hills, CA: Sage.
- Hofstede, G. (1994). The business of international business is culture. International Business Review, 3(1), 1-14.
- Hofstede, G. (2001). Culture’s consequences: comparing values, behaviors, institutions, and organizations across nations. Thousand Oaks, CA: Sage.
- Hofstede, G. (2016). Geert Hofstede cultural dimensions. Retrieved from http://www.geert-hofstede.com/hofstede_dimensions.php (Archived by WebCite® at http://www.Webcitation.org/6hh9Hd5gX)
- Hofstede, G. & Hofstede, G.J. (2004). Cultures and organizations: software of the mind. New York, NY: McGraw-Hill.
- Honda (2010). Honda worldwide: Honda Motor Co., Ltd. Retrieved from http://world.honda.com (last accessed 14 October 2010; no longer available).
- House, R.J., Hanges, P.J., Javidan, M., Dorfman, P.W. & Gupta, V. (Eds.) (2004). Culture, leadership, and organizations: the GLOBE study of 62 societies. Thousand Oaks, CA: Sage Publications.
- Interbrand (2016). Best global brands 2009 ranking. Retrieved from http://interbrand.com/best-brands/best-global-brands/previous-years/2009/ (Archived by WebCite® at http://www.Webcitation.org/6hiQC7tR0)
- Karacay-Aydin, G., Akben-Selçuk, E. & Aydin-Altinoklar, A.E. (2010). Cultural variability in Web content: a comparative analysis of American and Turkish Websites. International Business Research, 3(1), 97-103.
- Kassarjian, H.H. (1977). Content analysis in consumer research. Journal of Consumer Research, 4(1), 8-18.
- Kirkman, B.L., Lowe, K.B. & Gibson, C.B. (2006). A quarter century of culture's consequences: a review of empirical research incorporating Hofstede's cultural values framework. Journal of International Business Studies, 37(3), 285-320.
- Kirkman, B.L., Lowe, K.B. & Gibson, C.B. (2017). A retrospective on culture’s consequences: the 35-year journey. Journal of International Business Studies, 48(1), 12-29.
- Mushtaha, A., & De Troyer, O. (2014). The cultural conceptual model for simplifying the design of localized Websites. In A. Marcus, (Ed.), Design, User Experience, and Usability. User Experience Design for Diverse Interaction Platforms and Environments. Third International Conference, DUXU 2014, Held as Part of HCI International 2014, Heraklion, Crete, Greece, June 22-27, 2014, Proceedings, Part II (pp. 158-169). Berlin: Springer. (Lecture Notes in Computer Science, 8518).
- Nakata, C. (Ed.) (2009). Beyond Hofstede, cultural frameworks for global marketing and management. Basingstoke, UK: Palgrave MacMillan.
- Neuendorf, K.A. (2002). The content analysis guidebook. Thousand Oaks, CA: Sage.
- Okazaki, S. (2004). Do multinationals standardise or localise? The cross-cultural dimensionality of product-based Web sites. Internet Research, 14(1), 81-94.
- Okazaki, S. & Rivas, J. A. (2002). A content-analysis of multinationals’ Web communication strategies: cross-cultural research framework and pre-testing. Internet Research, 12(5), 380-90.
- Okazaki, S. & Skapa, R. (2008). Global Web site standardization in the new EU member states: initial observations from Poland and the Czech Republic. European Journal of Marketing, 42(11/12), 1224-1245.
- Picken, S.D.B. (1987). Values and value related strategies in Japanese corporate culture. Journal of Business Ethics, 6(2), 137-43.
- Robbins, S.S. & Stylianou, A.C. (2003). Global corporate Web sites: an empirical investigation of content and design. Information & Management, 40(3), 205-12.
- Rugman, A.M. (2003). Regional strategy and the demise of globalization. Journal of International Management, 9(4), 409-417.
- Schwartz, S. (1994). Beyond individualism/collectivism: new cultural dimensions of values. In K. Uichol, Triandis, H.C., Kagitcibasi, C., Choi, S.-C. & G. Yoon (Eds.), Individualism and collectivism: theory, method, and applications (pp. 85-119). Thousand Oaks, CA: Sage.
- Shaiq, H.M.A., Khalid, H.M.S., Akram, A. & Ali, B. (2011). Why not everybody loves Hofstede? What are the alternative approaches to study of culture? European Journal of Business and Management, 3(6), 101-111.
- Simin, S., Tavangar, M. & Pinna, A. (2011). Marketing and culture in university Websites. CLCWeb: Comparative Literature and Culture, 13(4), Article 6.
- Singh, N. & Baack, D.W. (2004). Web site adaptation: a cross-cultural comparison of U.S. and Mexican Web sites. Journal of Computer-Mediated Communication, 9(4).
- Singh N., Baack, D.W. & Bott, J. (2010). Are multinationals localizing their Websites? The link between managerial attitudes and MNE Web content. International Journal of Commerce and Management, 20(3), 258-267.
- Singh, N., Kumar, V. & Baack, D.W. (2005). Adaptation of cultural content: evidence from B2C e-commerce firms. European Journal of Marketing, 39(1), 71-86.
- Singh, N. & Matsuo, H. (2004). Measuring cultural adaptation on the Web: a content analytic study of U.S. and Japanese Web sites. Journal of Business Research, 57(8), 864-72.
- Singh, N., Park, J.E., Chun, W., Tigre Moura, F. & Kim, S.H. (2017). Strategic insights into localizing Web communications: evidence from South Korea. The DATA BASE for Advances in Information Systems, 48(3), 69-82.
- Singh, N., Zhao, H. & Hu, X. (2003). Cultural adaptation on the Web: a study of American companies’ domestic and Chinese Websites. Journal of Global Information Management, 11(3), 63-80.
- Singh, N., Zhao, H. & Hu, X. (2005). Analyzing the cultural content of Web sites: a cross-national comparison of China, India, Japan and the US. International Marketing Review, 22(2), 129-46.
- Sinkovics, R.R., Yamin, M. & Hossinger, M. (2007). Cultural adaptation in cross border e-commerce: a study of German companies. Journal of Electronic Commerce Research, 8(4), 221-35.
- Smith, P.B., Dugan, S. & Trompenaars, F. (1996). National culture and the values of organizational employees: a dimensional analysis across 43 countries. Journal of Cross-Cultural Psychology, 27(2), 231-64.
- Sohaib, O. & Kang, K. (2014). Cultural aspects of business-to-consumer (B2C) e-commerce: a comparative analysis of Pakistan and Australia. Electronic Journal of Information Systems in Developing Countries, 61(2).
- Steenkamp, J.-B.E.M. (2001). The role of national culture in international marketing research. International Marketing Review, 18(1), 30-44.
- Stengers, H., De Troyer, O., Baetens, M., Boers, F. & Mushtaha, A. (2004). Localization of Web sites: is there still a need for it? Paper presented at the International Workshop on Web Engineering, Santa Cruz, CA. Retrieved from https://bit.ly/2YRKrNk
- Tigre Moura, F., Singh, N. & Chun, W. (2016). The influence of culture in Website design and users’ perceptions: three systematic reviews. Journal of Electronic Commerce Research, 17(4), 312-339.
- Yalcin, S., Singh, N., Apil, A.R., Sayfullin, S. & Staub, K. (2010). Culture and marketing communications on the Web: a cross-cultural analysis. Journal of Euromarketing, 19(2/3), 93-113.
- Yalcin, S., Singh, N., Dwivedi, Y., Apil, A.R. & Sayfullin, S. (2011). Culture and localization on the Web: evidence from multinationals in Russia and Turkey. Journal of Electronic Commerce Research, 12(1), 94-114.
- Usunier, J.-C. & Lee, J. (2009). Marketing across cultures. Harlow, Essex, UK: Pearson Education.
- Vyncke, F. & Brengman, M. (2010). Are culturally congruent Websites more effective? An overview of a decade of empirical evidence. Journal of Electronic Commerce Research, 11(1), 14-29.
- Wang, V., Lou, H., Wang, Y. & Guo, C. (2015). Differences in organizational Web site design across cultures. Asia Pacific Journal of Marketing and Logistics, 27(4), 582-599.
- Wu, T., Peng, C.-H., Shi, Y. & Sia, C.L. (2015). An exploratory study of Website localization strategies: the effect of exogenous factors. In Nah, F.F.-H. & C.-H. Tan, (Eds.), HCI in Business. Second International Conference, HCIB 2015, Held as Part of HCI International 2015, Los Angeles, CA, USA, August 2-7, 2015, Proceedings (pp. 392-402). Berlin: Springer. (Lecture Notes in Computer Science, 9191).