Information behaviour, visual research, and the information horizon interview: three ways
Jenna Hartel
Introduction. As visual research increases across information science, the first and most prevalent visual method used to study information behaviour—the information horizon interview (Sonnenwald, 1999)—warrants critical attention.
Method. The paper draws upon the social scientific literature about visual methods and close readings of three visual data gathering techniques native to information science.
Analysis. The original formulation of the information horizon interview by Sonnenwald and the subsequent, novel reinventions of the information source horizon (Savolainen, 2008) and the analytical information horizon map (Huvila, 2009) are analysed comparatively in terms of their theoretical commitments, research designs, and data gathering protocol.
Results. The three visual methods have significant differences. The information horizon interview is a graphical elicitation technique that generates a diagram of an information seeker’s information resources within an activity space. The information source horizon is a more psychological notion that focuses on source preferences and their relevance. The analytical information horizon map is a tool for synthesizing and displaying multiple accounts of information behaviour from a collective.
Conclusion. Researchers of the future may recognise the unique characteristics of each technique and therefore more easily adopt the one most suited to elicit answers to their research questions.
Introduction
Over the last two decades there has been a global surge in the popularity of visual methods (Prosser and Loxley, 2008). In visual methods images are used to learn about the social world. The visual medium of inquiry is an alternative or complement to more traditional research methods centered on words or numbers. Visual methods are not homogenous or epistemologically neutral and there is a range of perspectives. Images may be seen as objective reflections of the world that capture facts, an approach common to anthropology. Alternatively, they may be cast as social constructions that reveal more about their creator than their subject, a sensibility native to visual studies. From within these stances, myriad visual research designs are possible; images can be used at any stage of the empirical research process, from conception to the dissemination of results. Adding to the diversity further, images may be produced by the researcher, the informant, or both parties in collaboration.
Across information science, and particularly in the specialty of information behaviour, there have already been a wide variety of visual research designs that target diverse questions, topics, and populations Hartel and Thomson, 2011). For example, students have been asked to take photographs of their everyday life to shed light on their library experience (Foster and Gibbons, 2007). Researchers have produced photographs and floor plan sketches of the homes of gourmet cooks (Hartel, 2007, 2010) or home office workers (Thomson, 2010), to document personal information collections. Cartoons have been used to capture and represent aspects of youth information literacy (Lundh, 2010). In an especially playful study aimed at understanding children’s conceptions of the Internet, youngsters were invited to draw ‘their Internet’ onto mock-paper laptops (Jankevičiūtė, 2011). Reflecting this groundswell of image-based projects, there have recently been panels that survey visual research at ASIS&T annual meetings (Hartel, 2012; Beaudoin and Ménard, 2013).
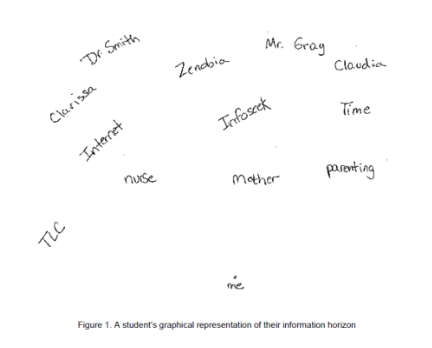
Predating most of these forays into visual research is a technique advanced by Diane Sonnenwald, the information horizon interview (Sonnenwald, Wildemuth and Harmon, 2001). As the first and currently best-established visual method for the study of information behaviour, it merits special attention. Here, Sonnenwald is credited individually as the originator of the information horizon concept, though it has been developed with collaborators and co-authors over the years. (A social genealogy of the information horizon idea is beyond the scope of this article.) The idea grew out of her theoretical framework of information behaviour (Sonnenwald and Iivonen, 1999), which holds that within any context or situation individuals have an ‘information horizon’ in which they can act, and where information activity takes place. An information horizon contains documents, information retrieval tools, social networks, experimentation, observation, and other resources for the information seeking process. Sonnenwald demonstrated that individuals can articulate their information horizon in words and also draw it on a piece of paper during an interview process. Once described and drawn by an informant, the textual and visual data makes information behaviour appear more concrete, and the drawing can be used to motivate additional details from the respondent. Two examples of outcomes from information horizon interviews in a study of information seeking by undergraduate students are shown below as Figure 1. Information horizon drawings such as these can ultimately be analysed qualitatively and/or quantitatively using matrixes or social network techniques.
When Sonnenwald hatched this idea in 1999, theoretical conceptions of information behaviour in spatial metaphors such as a horizon were not entirely new. An information use environment (Taylor, 1991) and information world (Chatman, 1992) are examples of frameworks for information behaviour that likewise invoke geographies. However, the full development of the information horizon concept as a research method, particularly one that featured a graphical mode, was pioneering since there was not a large and obvious movement or literature in such methods at that time.
In the intervening years, methods akin to the information horizon interview have flourished across the social sciences and have since been critically surveyed in order to systematise techniques and terminology. A recent interdisciplinary review of research involving the production of diagrams identified 80 articles (Umoquit, Tso, Burchett, and Dobrow, 2011) found in the fields of education, healthcare, engineering, environmental science, geography, industrial design, psychology, and social science. There has also been an analysis of diagrammatic methods by scholars in information science (Copeland and Agosto, 2012) that outlines their benefits and drawbacks. Based upon these reviews it is now possible to better characterise the information horizon interview and its resulting data, thereby increasing the methodological acumen of its adopters in information science.
Diagrammatic elicitation
The review by Umoquit et al. (2011) establishes that the information horizons shown in Figure 1 are forms of graphic communications (Engelhardt, 2002) known as diagrams. On a spectrum of structural composition by Banks (2001) in which the visual represents one end and the verbal represents the other end, diagrams belong in the middle. They are ‘a visual representation of information that uses both visual and language-based elements’ (Umoquit, Tso, Burchett and Dobrow, 2013, p. 4). Pointing to the same hybrid quality, Richards (2002) states that diagrams ‘occupy that hinterland between written text and the purely graphical. That is their strength, enabling, often through the use of graphic metaphor, the visual representation of the otherwise invisible’ (p. 91). A diagram’s great affordance as a data gathering instrument in information behaviour research is likely its potential ability to render information behaviour visible that is otherwise invisible.
Sonnenwald refers to the outputs of her protocol as information horizon ‘maps’. Indeed, they contain features of two common subcategories of diagrams, concept maps and mind maps (Wheeldon and Ahlberg, 2012). Concept maps are a technique for individuals to visually represent their perceived relationships between various concepts, usually enclosed in circles or boxes. Concept maps often evolve from a focusing question. In Sonnenwald’s case, the focusing interview question asks informants to describe an information seeking experience. Mind maps are more flexible than concept maps and are diagrams used to represent words, themes, ideas and other concepts that radiate from a central idea or word (Buzan, 1997). The information horizon process asks the informant to place themselves at the center of a piece of paper and then surround themselves with information resources. Hence, the end-product of Sonnenwald’s information horizon interview is technically a diagram that exhibits features of both concept maps and mind maps.
In its original formulation (Sonnenwald, Wildemuth, and Harmon, 2001), the information horizon diagram is created after a substantial semi-structured interview which continues into the drawing activity. Umoquit et al. (2011) name this simultaneous process in which respondents talk and draw diagrammatic elicitation. In diagrammatic elicitation, ‘a study participant physically creates and/or physically or verbally edits a diagram with the visual as the focus thereby encouraging participants to communicate through the use of a diagram rather than relying on verbal communication alone’ (p. 7). Diagrammatic elicitation can entail minimal instruction from the interviewer while the participant draws without interruption; or, the researcher may converse and probe along the way, which occurs in the information horizon interview.
Visual theorist Gillian Rose (2007) champions a critical visual methodology in which scholars seriously consider the nature of images and their role in the research process. For diagrammatic elicitation, this means scrutinizing the site where the diagram is produced and the diagram itself as a visual artifact. Newcomers to visual research who use the information horizon interview protocol may not realise that all aspects of the diagrammatic elicitation process—the instructions, writing instruments, paper, sequencing, and timing—exert and maintain the researcher’s control (Varga-Atkins and O’Brien, 2009) on the final outcome and are subject to manipulation and critique. In the past decade, information behaviour scholars who have taken up and customised the information horizon approach have tinkered with various elements of the protocol and in a constructive spirit these will be examined shortly.
The information horizon interview: three ways
The next section takes a closer look at Sonnenwald’s first detailed methodological statement on the information horizon interview to set the stage for comparison to later reformulations by Savolainen (2008) and Huvila (2009). There have been many other studies of information horizons but these two examples are chosen as points of comparison because of their high quality and theoretical and methodological commentary. Below, each instance of the information horizon idea will be discussed in turn; attention will be placed upon the theoretical commitments, research designs, and distinguishing features of the diagrammatic elicitation process. Due to space limitations of this paper, the visual analysis of the diagrams and the findings of each study will not be discussed extensively.
Sonnenwald’s information horizon
Sonnenwald outlines the information horizon interview in a methodological statement that is also a case study of information behaviour (Sonnenwald et al., 2001). The paper won the Association for Library and Information Science’s Methodology Paper award. The case study evaluated the impact of an electronic mentoring program on students in lower socioeconomic areas and also focused on their information seeking behaviour. The participants were 11 undergraduates enrolled in a biology course that had an electronic mentoring feature. Following general interview questions about the course and mentoring component, the researcher asked questions about information seeking processes and information resources. Then, the information horizon element began thusly:
Interviewer: One other thing that we’re trying in this study is that we’re asking people if they could draw what we’re referring to as their information horizon or information horizon map: to put yourself on this piece of paper, and then draw in the people and other resources that you typically access when you’re either seeking information for your courses or for your career. And if you could indicate which ones you might go to first, or you could go to several simultaneously, or which ones you prefer – and talk about it as you’re drawing it.Study Participant: Okay; in the middle, 'course it’s me. (Sonnenwald et al., 2001, p. 6).
As the informant draws the diagram, the researcher continues to listen and probe, with questions such as, ‘Do you use any other resources? When, or why would you go to this particular resource after/before going to this other one?’ (p. 6). Throughout the drawing activity it is easy to envision the researcher and informant hovering over the paper together and pointing to specific graphic objects.
While the award-winning paper stands as a pioneering statement on a new data gathering method, aspects of the staging for diagrammatic elicitation are ambiguous. For instance, the type of writing instrument is not addressed. It matters whether the informant uses a pencil or pen and whether multiple colours were available. There are also no specifications on the paper, which may or may not be standard in its texture, weight, and size. Whether the paper is presented to the informant in portrait or landscape orientation is also unspecified. These seemingly inconsequential variables actually impose a relative size, shape, and character to the information horizon diagram that gets generated. Further, the instruction that directs the student ‘to draw’ are quite abbreviated and may result in confusion about the use of text and/or graphic objects, as seen in a comparison of the top and bottom diagrams of Figure 1. One can imagine a student wondering or asking, ‘Just what do you mean by draw?’
In the article, the timespan of the information horizon interview is also undefined. A footnote reports that the interview process took 45-75 minutes, but it is unclear whether that figure refers to the whole critical incident interview and/or the information horizon element alone. It is also worth noting and reflecting that the activity occurred at the end of a longer interview session, and participants may have been tired, restless, or eager to finish—hence expeditious with the graphical elicitation task.
The results of the case study identified, in a vivid new way, the undergraduate students’ favoured information resources, their order of access, and the impact of social networks on information behaviour. All 11 participants were able to create the maps, confirming that people can draw their information horizons. Despite the ambiguities raised from a more contemporary critical visual methodology the landmark statement and approach has been an inspiration and blueprint for many subsequent information behaviour research projects.
Savolainen’s information source horizon
In Everyday Information Practices: A Social Phenomenological Approach, Reijo Savolainen (2008) redesigns the information horizon concept and interview technique. His protocol was first described in an earlier study of internet use in the context of self-development (Savolainen and Kari, 2004). The reformulation is based upon phenomenology, a philosophy of the structures of experience and consciousness. It recasts the information horizon from a physical resource and activity space to a more psychological notion coined an information source horizon, wherein greater importance is placed on source preferences and their relevance.
According to Savolainen, an information source horizon opens up before the mind’s eye of an information seeker and stretches to a distant horizon of their perceived information environment. In keeping with Sonnenwald’s original idea, individuals are able to imagine information sources therein for any information seeking situation. Differently, in an information source horizon, resources are positioned in terms of their relevance, with the most relevant items perceived as nearest to the individual and the least relevant envisioned farther off at the vanishing point of the horizon. To sum it up, when compared to Sonnenwald’s information horizon, the information source horizon is a more fulsome mental geography that is charged with informational properties, namely location-related relevance.
An empirical example of the approach is detailed in the study of internet use in the context of self-development (Savolainen and Kari, 2004), which are non-work pursuits such as hobbies. For the research design, semi-structured interviews were conducted with 18 Finnish citizens engaged in self-development projects.
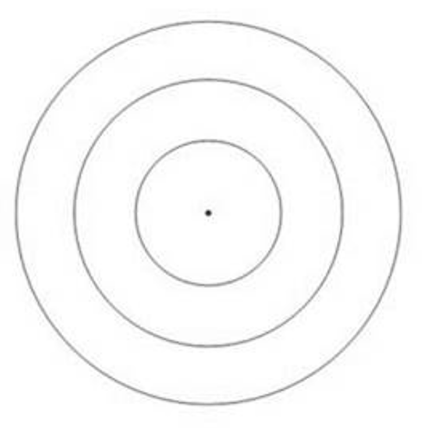
The informants were first invited to talk generally about Internet use in their everyday life information seeking. Next, their information source horizon was solicited through a structured drawing exercise. Participants were asked to focus on an instance of information seeking for self-development. They were then given a piece of paper with a diagram of three nested circles (shown in Figure 2) and advised to mark the most important sources in the innermost circle (Zone 1); the second most important sources in the intermediary sphere (Zone 2); and the least important sources in the outermost sphere (Zone 3). Informants were told no criteria for the preferences and were asked to think aloud about each source.
From a critical visual perspective, Savolainen’s version of the information horizon and its associated data gathering process can be problematised, too. Like Sonnenwald, no information is provided about the drawing tool and duration of the exercise. Yet this second generation protocol exerts greater researcher control on the graphical production process. Rather than a blank slate, the participants begin with a bounded canvas of three circular Zones. This approach immediately imposes a relative structure and scale to a subject’s information experience, which if expressed organically may not be round, nested, or symmetrical.
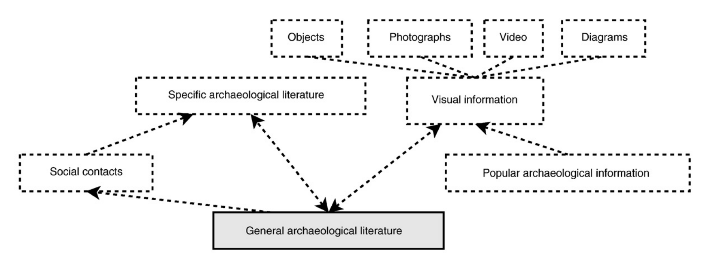
A more striking issue and incongruity is that the circular template shown in Figure 2 does not reflect the definition of an information source horizon as extending in front of the mind’s eye. Rather, it presents an information phenomenon that surrounds an individual in an all-encompassing, 360-degree manner. One may ponder whether participants considered the implications of graphically representing an information source as behind them in the circle, or to the left or the right, for that matter. Hence, Savolainen’s written conception of the information source horizon is not mirrored correctly in the graphical data gathering instrument. To amend this disconnect, a researcher could supply a panoramic template that likewise features three Zones of relevance, as drawn by this author in Figure 3; it more accurately reflects the description of the information source horizon and may increase the coherence of Savolainen’s methodology.

In Savolainen and Kari’s study (2004), the 18 self-developers were able to produce the information source horizon, and the difficulties mentioned above were not reported by the researchers. The study identified 111 possible information channels and sources; their distribution across the three Zones; comparisons of networked versus print sources; and the reasons for source preferences per each zone. Overall, Savolainen’s reinvention of the information horizon supplies a more precise methodological tool for information behaviour research, especially when source identification, preference, and relevance are the research goals.
Huvila’s analytical information horizon map
Isto Huvila has spent several years investigating the information work of Nordic archaeologists, a project anchored in his doctoral dissertation (2006). Over the duration of this extended study he modified Sonnenwald’s information horizon approach substantially and advanced the notion of an analytical information horizon map, (Huvila, 2009).
The analytical information horizon map differs from Sonnenwald’s information horizon in three essential ways, it: captures the information activities and resources of a collective (e.g. Nordic archaeologists)—not an individual; is drawn by the researcher—not the informant; and is an instrument for data analysis, rather than data collection. Of note, the diagram produced through the process does not locate resources in graphical space based upon their relevance, per Savolainen.
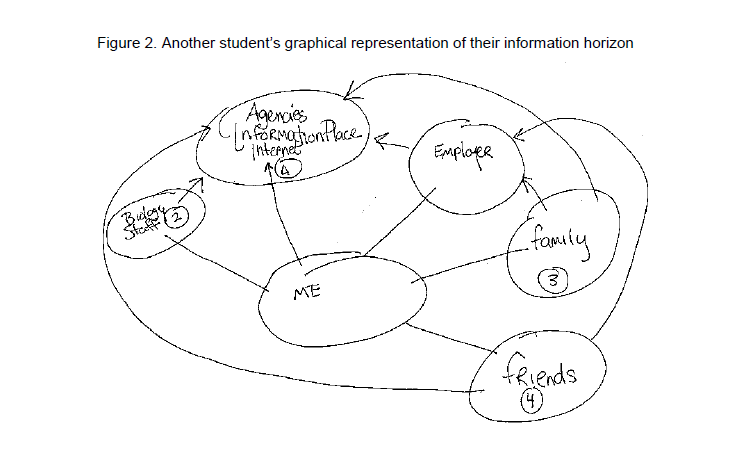
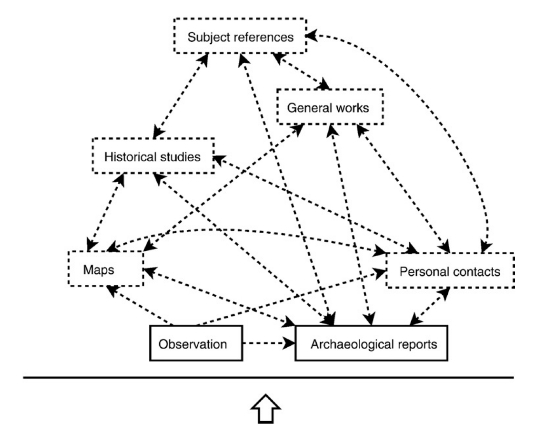
The theoretical framework and research design Huvila employs to generate the maps is sophisticated and layered. He conducted focused interviews (Hirsjarvi and Hurme, 1995) with 25 Finnish and Swedish archaeology professionals followed by a schema analysis (Ryan and Bernard, 2000) of the interview data to identify seven archaeological work roles (e.g. academic teaching, field archaeology, antiquarian, public dissemination, academic research, cultural heritage administration, and infrastructural development). The seven work roles were then subjected to information work analysis (Huvila, 2006). The resulting work role-related information behaviour that emerged was summarised in the maps that display the archaeologists’ perception of available resources, their mutual relationships, and the patterns of use. The maps differ per role, as shown in the two examples of Figure 4, which represent the academic teaching role (left) and the field archaeology role (right).
The distinguishing features of Huvila’s version of the information horizon bear restatement: it is not diagrammatic elicitation, as defined above, since a participatory graphical exercise was not used to gather visual data from research subjects. Rather than functioning during data gathering, it serves subsequently as an analytical tool for synthesizing and illustrating multiple accounts of information behaviour that have been gathered via interviews from a collective. With the analytical information horizon maps Huvila performs a deft act of metatheoretical gymnastics. The approach shifts Sonnenwald’s information horizon and Savolainen’s information source horizon from a cognitive metatheoretical perspective (centered on an individual’s mind) to a socio-cognitive (Jacob and Shaw, 1998) or domain analytic perspective (Hjørland and Albrechtsen, 1995) that represents the information practices of a social world.
Through the lens of a critical visual methodology, Huvila can be commended for taking the graphical construction and visual nature of the analytical information horizon maps seriously. (His heightened attention and sensitivity is perhaps because he created the maps himself, whereas Sonnenwald and Savolainen were limited to the role of observers of their images. Also of note, across his work Huvila has demonstrated a strong interest in visual research methods and information display, as evidenced at his personal academic website at http://www.istohuvila.se/.)
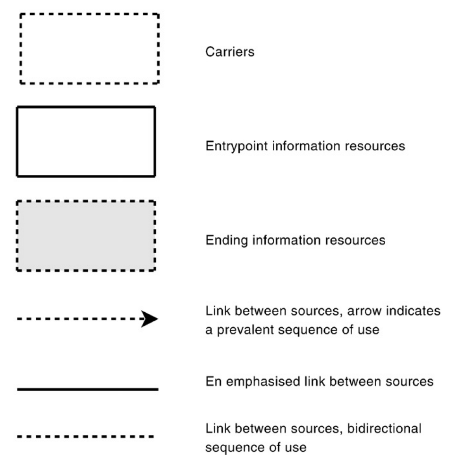
Huvila explains in writing and through a concise key (Figure 5) the meaning of the visual elements of the maps. The distances between individual objects on the map suggests progress or effort; that is, nearby entities are engaged sooner whereas distant entities are engaged later. This corresponds advantageously to our natural understanding of space on road maps and timelines. The various boxes with solid or dashed lines as well as white or shaded interiors reflect the nature of a resource as either an entry point, carrier, or ending point, specifications adopted from Sonnenwald. The connecting lines display prevalent sequences of use that may be either emphasised or unidirectional/bidirectional in their flow. The overall depth or breadth of each one as it appears on a page is also an indicator of the archaeologist’s sense of their information environment as either narrow and limited or broad and abundant, resource-wise.
With interviews as source material, Huvila was able to construct distinct analytical information horizon maps for the information behavior common to each of the seven roles in archaeological work. His process included a successful validity check in which the maps were approved by archaeologists, to confirm them as more than a figment of his imagination. One notable drawback of the maps may be the time required to master and apply the complex theoretical framework as well as the need for significant skill and fluency in the visual realm (whereas Sonnenwald’s original version retains an appealing simplicity). Still, Huvila’s reformulation is another productive extension of the information horizon, an idea which has proven to be powerful and malleable.
Conclusion
This paper has focused on Sonnenwald’s information horizon concept and interview in order to illuminate essential differentiating features of its progeny, the information source horizon (Savolainen, 2008) and analytical information horizon map (Huvila, 2009). Through this comparison, the three visual methods show distinct theoretical commitments, research designs, and data gathering protocols. Researchers of the future may recognise the unique characteristics of each method and therefore more easily adopt the one most suited to elicit answers to their research questions. What is more, researchers may make modifications to these visual methods, which may generate still more effective and creative diagram-based approaches. As information scientists increasingly embrace and apply visual methods it is beneficial to reflect critically, carefully, and constructively upon the use of images in the research process.
About the author
Jenna Hartel is an Associate Professor at the Faculty of Information, University of Toronto. She is an enthusiast and early adopter of visual research methods in information studies. She can be contacted at jenna.hartel@utoronto.ca.
References
- Banks, M. (2001). Visual methods in social research. London: Sage.
- Beaudoin, J. & Ménard, E. (2013). Questioning the visual: research methods and the problem of perception. In Proceedings of the 76th Annual Meeting of the American Society for Information Science and Technology, Beyond the Cloud: Rethinking Information Boundaries. Montreal, QC, November 1-5, 2013.
- Buzan, T. (1997). The mind map book. London: BBC Books.
- Chatman, E. A. (1992). The information world of retired women. New York: Greenwood Press.
- Copeland, A. & Agosto, D. (2012). Diagrams and relational maps: the use of graphic elicitation techniques with interviewing for data collection, analysis, and display. International Journal of Qualitative Methods, 11(5), 513-533.
- Engelhardt, Y. (2002). The language of graphics: a framework for the analysis of syntax and meaning in maps, charts and diagrams. (Unpublished doctoral dissertation). Institute for Logic, Language and Computation, University of Amsterdam, The Netherlands.
- Foster, N.F. & Gibbons, S. (Eds.), (2007). Studying students: the undergraduate research project at the University of Rochester (pp. v–ix). Chicago: Association of College and Research Libraries.
- Hartel, J. (2007). Information activities, resources, and spaces in the hobby of gourmet cooking. (Unpublished Doctoral Dissertation). University of California, Los Angeles.
- Hartel, J. (2010). Managing documents at home for serious leisure: a case study of the hobby of gourmet cooking. Journal of Documentation, 66(6), 847-874.
- Hartel, J., (2012). State of the art/science: Visual methods for information behaviour research (panel convener). ASIS&T Annual Meeting, Baltimore, MD.
- Hartel, J. & Thomson, L. (2011). Visual approaches and photography for the study of immediate information space. Journal of the American Society for Information Science and Technology, 62(11), 2214-2224.
- Hirsjarvi, S. & Hurme, H. (1995). Teemahaastuattelu (Thematic interview). Helsinki, Finland: Yliopistopaino.
- Hjørland, B. & Albrechtsen, H. (1995). Toward a new horizon in information science: domain analysis. Journal of the American Society for Information Science 46(6), 400-425.
- Huvila, I. (2006). The Ecology of information work: a case of bridging archaeological work and virtual reality based knowledge organisation. Åbo: Åbo Akademi University Press.
- Huvila, I. (2009). Analytical information horizon maps. Library & Information Science Research, 31(1), 18-28.
- Jacob, E.K. & Shaw, D. (1998). Sociocognitive perspectives on representation. In M.E. Williams (Ed.), Annual Review of Information Science and Technology, Medford, NJ, Information Today, (pp. 131-185).
- Jankevičiūtė, L. (2011). Using visual methods in research about young people's digital worlds. International Visual Research Association Conference. Milton Keynes, UK.
- Lundh, A. (2010). Studying information needs as question-negotiations in an educational context: a methodological comment. Information Research, 15(4) paper colis722. Retrieved from http://InformationR.net/ir/15-4/colis722.html (Archived by WebCite® at http://www.webcitation.org/6jRGpI6Mb)
- Prosser, J. & Loxley, A. (2008). Introducing visual methods (National Centre for Research Methods Review Paper). Retrieved from http://eprints.ncrm.ac.uk/420/1/MethodsReviewPaperNCRM-010.pdf (Archived by WebCite® at http://www.webcitation.org/6jRGGIZUV)
- Rose, G. (2007). Visual methodologies: an Introduction to interpreting visual materials (2nd ed.). London: Sage.
- Richards, C. (2002). The fundamental design variables of diagramming. In M. Anderson, B. Meye, & P. Olivier (Eds.), Diagrammatic representation and reasoning (pp. 85-102). London: Springer-Verlag London Limited.
- Ryan, G. W. & Bernard, H. R. (2000). Data management and analysis methods. In N. K. Denzin & Y. S. Lincoln (Eds.), Handbook of qualitative research (pp. 769-802). Thousand Oaks, Ca: Sage.
- Savolainen, R. & Kari, J. (2004). Placing the Internet in information source horizons. A study of information seeking by Internet users in the context of self-development. Library & Information Science Research, 26(4)2, 415-433.
- Savolainen, R. (2008.) Everyday information practices: a social phenomenological perspective. Lanham, Maryland: The Scarecrow Press.
- Sonnenwald, D. H. (1999). Evolving perspectives of human information behaviour: Contexts, situations, social networks and information horizons. In T. D. Wilson & D. K. Allen (Eds.). Exploring the contexts of information behaviour: proceedings of the second international conference in information needs, seeking and use in different contexts (pp. 176-190). London: Taylor Graham.
- Sonnenwald, D. H., Wildemuth, B. M., & Harmon, G. L. (2001). A research method using the concept of information horizons: an example from a study of lower socio-economic students’ information seeking behaviour. The New Review of Information Behaviour Research, 2, 65-86.
- Sonnenwald, D.H. (2005). Information horizons In: K. Fisher, S. Erdelez, & L. McKechnie (Eds). Theories of information behaviour: a researcher's guide. NY: Springer.
- Sonnenwald, D.H. & Iivonen, M. (1999). An integrated human information behaviour research framework for information studies. Library and Information Science Research, 21 (4), 429-457.
- Taylor, R.S. (1991). Information use environments. Progress in Communication Sciences, 10, 217-255.
- Thomson, L.E.A. (2010). Information in the home office: an ethnographic study of space, content, management & use. Unpublished Masters thesis. University of Toronto, Toronto, ON.
- Umoquit, M.J., Tso, P. Burchett, H.E.D., & Dobrow, M. J. (2011). A multidisciplinary systematic review of the use of diagrams as a means of collecting data from research subjects: application, benefits and recommendations. BMC Medical Research Methodology, 11(11).
- Umoquit, M., Tso, P., Varga-Atikins, T., O’Brient, M., & Wheeldon, J. (2013). Diagrammatic elicitation: defining the use of diagrams in data collection. The Qualitative Report, 18(30), 1-12.
- Varga-Atkins T. & O' Brien, M. (2009). From drawings to diagrams: maintaining researcher control during graphic elicitation in qualitative interviews. International Journal of Research & Methods in Education, 32, 53-67.
- Wheeldon, J. & Ahlberg, M. (2012). Visualizing social science research: maps. methods, and meaning. Thousand Oaks, CA Sage Publications.