A review of large-scale 'How much information?' inventories: variations, achievements and challenges
Martin Hilbert
University of California, Davis, Department of Communication, Kerr Hall 369; Davis, CA, 95616, USA.
Introduction: motivation, background and context
Why the question "how much information"?
The quantification of information stocks and flows is driven by the desire to gain a deeper understanding of the social, economic, cultural and psychological role of information in society. To quote Lord Kelvin:
when you can measure what you are speaking about, and express it in numbers, you know something about it; but when you cannot measure it, when you cannot express it in numbers, your knowledge is of a meagre and unsatisfactory kind; it may be the beginning of knowledge, but you have scarcely in your thoughts advanced to the state of Science (quoted from Bartlett, 1968, p. 723a).
As such, answering the question of 'How much information?' there is in society, is an indispensable step in the process of creating a more complete information science as it relates to social processes. The interest in the quantification of human kinds' stock and flow of information has been intensified by recent advancements in large scale analysis of the digital wealth of so-called Big Data (e.g., Manyika et al., 2011; Mayer-Schonberger and Cukier, 2013; Hilbert, in press). Big data has been described as 'the new oil' (Kolb and Kolb, 2013, p. 10) and is currently seen as a concrete form of socio-economic input, a form of capital and asset. The recognition of the economic, social and political relevance of information refueled the interest in the quantification of the availability and consumption of this ever more abundant kind of resource.
The results of these studies have been important and converted many gut-feeling judgements about the information age into solid and quantified scientific facts. They quantified the increasing mismatch between information provision and information consumption (Pool, 1983; Pool, Inose, Takasaki and Hurwitz, 1984; Neuman, Park and Panek, 2012); the increasing role of direct household-to-household and consumer-to-consumer communication at the expense of corporate control of information flows (Dienes 1991; Gantz et al., 2007, 2008); the dominance of the United States in global information production (Lyman, Varian, Dunn, Strygin and Swearingen, 2000; Lyman, et al., 2003); the increasing role of computers as standalone agents of our communication landscape (Short el al., 2012); the end of the text hegemony and the rise of the bi-directional exchange of video (Pool, 1983; Odlyzko, 2008; Cisco Systems, 2011); and that the world's computational capacity has grown three times faster than the world's information storage and communication capacity (Hilbert and López, 2011), showing potential to confront the information overload with computational power.
These new insights led to considerable public interest, producing attention-grabbing newspaper headlines like 'WW data more than doubling every two years' (2011); 'Business information consumption: 9,570,000,000,000,000,000,000 bytes per year' (Graham, 2011); 'World's shift from analog to digital is nearly complete' (Leontiou, 2011); 'All human information, stored on CD, would reach beyond the moon' (Lebwohl 2011); 'Data shows a digital divide in global bandwidth: access to the Internet may be going global, but a 'bandwidth divide' persists' (Orcutt, 2012); 'World's total CPU power: one human brain' (Trimmer, 2011); 'New digital universe study reveals big data gap: less than 1% of world's data is ed; less than 20% is protected (2012); and 'Disconnect between U.S. wireless demand and infrastructure capacity' (Kleeman, 2011), among others.
Why compare 'How much information?' inventories?
Notwithstanding the importance of these and other related results, the bulk of the quoted inventories often produce confusion, because the numbers they present vastly differ. For example, Lyman, Varian, Dunn, Strygin and Swearingen (2000) and Lyman et al. (2003) report that the world produced some four exabytes of unique information in the year 2000, while Hilbert and López (2011) estimate that the world's installed capacity of storing and of communicating optimally compressed information in 2000 reached some 1,200 exabytes. The latter number is roughly 300 times larger than the former. Hilbert and López also report that the amount of globally communicated amount of information sums up to 1.15 zettabytes in 2007, while Bohn and Short (2009) report that only one year later, in 2008, Americans alone consume more than three times as much, 3.6 zettabytes. The reason for these differences is of methodological nature. The devil is in the detail. Unique information is not equal to installed technological capacity, and communication is not equal to consumption.
This can also be seen in the resulting growth rates. Focusing on consumption, the growth rates of consumed bytes estimated by Bohn and Short (2009) are in the same order of magnitude than the growth rates of hours of media consumption. They estimate that in the United States, hours of information consumption grew at 2.6% a year from 1980 to 2008, while bytes consumed increased at 5.4% a year. Focusing on the installed capacity, Hilbert and López (2011) and Hilbert (2014a) detect annual growth rates of 20-30%.
The other way around, at times similar numbers refer to different things, increasing the existing confusion, especially when secondary literature cites the reported numbers. For example, Gantz, et al., (2008) report that the digital universe in 2007 inhabits 281 exabytes, while Hilbert and López (2011) report that the worldwide installed capacity to store information consists of 295 exabytes. While both numbers are similar, the second number refers exclusively to data storage capacity, the first number also includes data creation and communication flows, such as sent text messages and e-mails. Besides, the second number refers to optimally compressed bits, while the first number reports uncompressed binary digits. Finally, the second study covers some sixty types of technologies, while the first number tracks some thirty comparable types.
To obtain a more solid understanding of these inventories and their differences, this paper presents a comparative methodological review of the most important of these inventories, discussing their approaches and achieved insights. The choice of the inventories is based on their historical importance (pioneering studies that influenced subsequent generations of projects), as well as their comprehensiveness (the most extensive of their kind). The author is not aware of any additional inventory project that would fit be comparable with those selected in terms of pioneering influence and scope.
While collections of articles published elsewhere have provided detailed discussions of the challenges faced by one or the other project (see Hilbert, 2011; Bohn and Short, 2012; Bounie and Gille, 2012; Dienes, 2012; Hilbert and López, 2012a; 2012b; Lesk, 2012; Neuman, Park and Panek, 2012; and Odlyzko, 2012), this integrative review provides one single comparative overview of the most influential of these inventories in a comparative manner. The idea behind the paper is not to normatively argue in favour of one approach or the other (as done elsewhere; see Dienes, 2012). Neither is it the idea to provide the history of the various intents in chronological context (as done elsewhere; see Hilbert, 2011). The main idea is to present and stress the complementary nature of the existing approaches in a descriptive manner, providing the reader with a one-stop introduction to the existing methodological choices.
Historical context
It is important to recognise that several proxies exist that can be used to answer the question without the need to quantify information directly. The two most common ones refer to measuring economic resources dedicated to information (e.g., measured in US dollars) or the quantification of the technological infrastructure that carries the information (e.g., the number of technological devices or active subscriptions).
The first scholars to take up the question in modern times were economists. In 1962, Machlup presented an estimation of 'The production and distribution of knowledge in the United States' (1962). He did not directly quantify the amount of information or knowledge, but rather the size of the information-intensive industries (in US dollars) and the respective occupational workforce. He followed the logic of national accounting from economics and identified some sectors that he considered information-intensive. Porat (1977) advanced this approach and reached the much-cited conclusion that the value of the composed labour and capital resources of these information sectors made up 25% of U.S. gross domestic product in 1967. He measured the economic value of the related 'information activity [which] includes all the resources consumed in producing, processing, and distributing information goods and services' (Porat, 1977, p. 2). As information capital he loosely identified a 'wide variety of information capital resources [that] are used to deliver the informational requirements of one firm: typewriters, calculators, copiers, terminals, computers, telephones and switchboards… microwave antennae, satellite dishes and facsimile machines' (Porat, 1977, p. 2–3).
Over the decades, the basic notion of the approach evolved and led to the creation of international instruments that institutionalised the definition, harmonisation, collection and interpretation of indicators of information and communication technologies. The most influential heir is the Working Party on Indicators for the Information Society (WPIIS) of the Organization for Economic Co-operation and Development; an international economic cooperation among thirty-four industrialised countries (OECD, 2011). The Working Party has set a number of global standards for measuring key components of the information society, such as the definition of industries producing information and communication technology goods and services (OECD, 2007), a classification of information and communication technology, content and media products, and a definition of electronic commerce and Internet commerce transactions (OECD, 2009). Several international organizations from the United Nations have worked on taking such indicators global by fine-tuning them to meet the needs of developing countries (Partnership..., 2005, 2008). This statistical groundwork is nowadays feeding an impressive mechanism of institutionalised research production on the advancement of the so-called information society (e.g., ITU, 2007; 2009; 2010; 2011; 2012; UNCTAD, 2005; 2006; 2009; 2010; 2011; 2012; 2013; Qiang, 2006; World Bank, 2009; 2012), which is accompanied by at least a dozen of international information and communication technology-indexes that rank societies according to their informational readiness (e.g., Minges, 2005). In other words, the global measurement of such indicators counts with the commitment of sizable public funds and has already reached a considerable level of institutionalisation. This is good news.
Despite their widespread usage and the undoubted usefulness, it is important to underline that all of these efforts employ mere proxies of the amount of information and communication. They track indicators like the number of mobile phones and Internet subscriptions, or the amount of money spent or invested into information and communications infrastructure, but not the amount of information or communication involved. It can be expected that more such infrastructure or more expenditure leads to more information and communication, but this relation is not necessary, nor automatic, and can be deceptive (see Hilbert, 2014c).
A comparative overview
Instead of presenting an exhaustive list of the more than two dozen individuals papers and studies undertaken so far, this review presents the distinct flavours of methodological choices by focusing on the most influential studies and grouping them into families (for a more detailed discussion of twenty six different studies, see Dienes, 2012). This results in eight broad families that naturally emerged after reviewing the inventory projects. They are the essential aspects of common differences among them. This aggregation surely compromises historical and conceptual accuracy, but allows for a more clear-cut communication of the main distinctions between approaches as they exist up to date. The single one-stop-shop of this article is presented in the Appendix, in Table 1. Throughout the paper we will review different aspects of what Table 1 contains, and what is still missing.
Main conceptual groups
This section will look into the differences in research interest and methodology. The question of what to measure is of research interest, not of validity. To do so, it is important to stress that some project report their sources and assumption in a more transparent manner than others. For example, López and Hilbert (2012) provide more than 300 pages of Supporting Appendix outlining methodological assumptions and providing the details of their more than 1,100 distinct sources, while Gantz, et al. (2008) present one page of notes on methodology and key assumptions, list fifty-two sources and declare that additionally internal IDC databases were used. Such differences in style are mainly due to the academic or commercial nature of the study, and do not change the fundamental fact that different researchers are simply interested in different things, which leads to different conclusions.
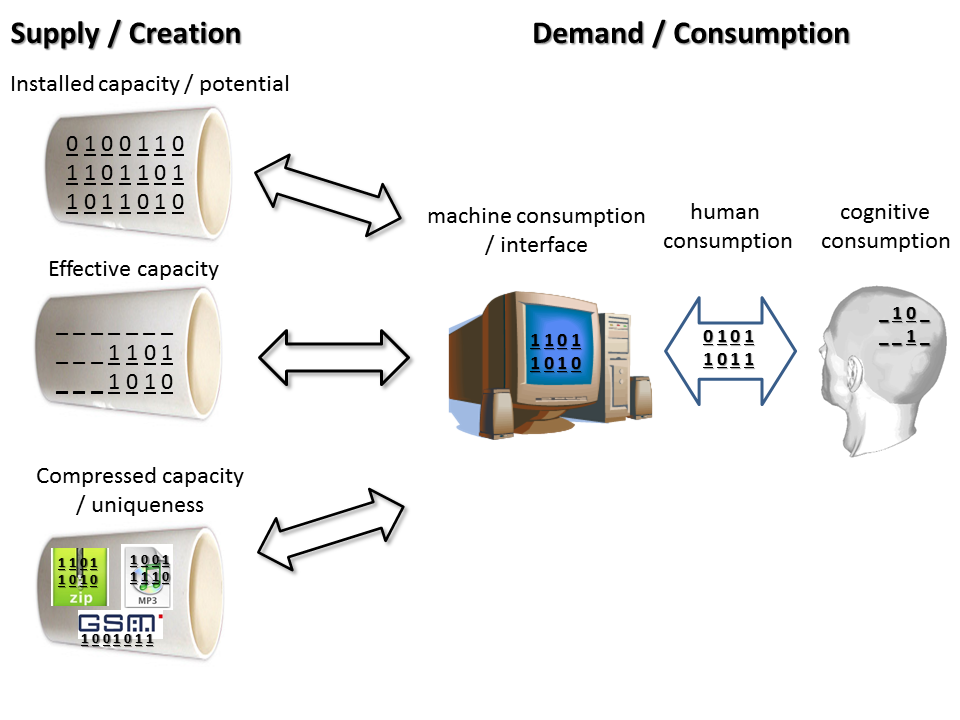
The first distinction to make is if the amount of information is accounted for in form of a stock (e.g., information storage) or in terms of a flow (e.g., broadcasting or communication). Besides this basic distinction, there are several other aspects, mainly concerning the distinction between information supply (or creation) versus demand (or consumption). Figure 1 differentiates among some broad conceptual groups (see Figure 1). The presentation should only be understood schematically. Particular studies use specific definitions that often crosscut these schematic categories. Some studies compare information supply and demand and have long found an increasing divergence between information provision and consumption, resulting in an increasingly intensified information density per user (Pool, 1983; Neuman, Park, Panek, 2012).
On the supply side, researchers sometimes report the installed capacity, which, in its purest form, simply accounts for the existing technological infrastructure (e.g., Lesk, 1997). The equivalent would be to assume that all hard disks would be filled, all fiber-optic cables run at full capacity, and all PCs and servers would be computing for 24 hours a day. Another alternative is to focus only on the information that is effectively present, which is a subgroup of the former. For example, according to Hilbert and López (2012a), if all broadcast receivers would receive information 24 hours a day, 15.9 zettabytes could have been transmitted in 2007. Effectively, however, the average broadcasting receiver only runs for some three hours a day, resulting in an effective capacity of 1.9 zettabytes. Besides, and this aspect already jumps ahead to the subsequent section on the measurement unit, when measuring bits, one can measure the brute force number of binary bins existing in a storage device or in a communication channel (often referred to as binary digits), or to a more or less sensible compression of the information contains in these space holders (compressed bits) (for a more detailed discussion see Hilbert and López, 2012b). Since compression can largely reduce the numbers of bits of the same content, Lyman, et al. (2000; 2003) present a range of high and low estimates, which responds to different levels of compression available at a certain point in time. Hilbert and López (2011) assume that all content, independent of which year, would be compressed with the optimal compression algorithms available in the year of measurement, which has the benefit of making the amount of content comparable over time.
The general logic of compression leads to the distinction between unique and duplicate information. What compression essentially does is to take redundancy out of the source. This means that five equal pieces of content are not recorded or transmitted five times (i.e., [content], [content], [content], [content], [content]), but rather one time, while adding the marginally negligible informatics remark of duplication (i.e., [content]*5). Optimal compression eliminates duplication asymptotically. Therefore, if it would be possible to make the world's global information capacity subject to one a single compression mechanism, only purely unique information would be identified (see Hilbert and López, 2012b; Box 2). Following the compression logic one could run the compression algorithm not on the global amount of information, but on the amount of information pertaining to an individual. Lyman et al. (2000; 2003) aimed for an approximation of unique content per individual following a less technical methodology. On the contrary, the estimations of Hilbert and López (2011, 2012a) apply compression standards as reported by the industry per file type, such as a song, an average text file, or a movie. This takes out internal redundancy from these standard information entities (predictability and uniqueness within a song, text of movie), measuring only unique information within such entities, while not eliminating redundancy among entire duplicates of the same song, text file or movie.
This created supply of information can then be consumed by a machine and/or human. There are different ways to measure consumption. Bohn and Short (2009) and Neuman, Park and Panek (2012) assess the amount of time an individual interacts with the media and multiply this time with a certain information flow rate. This essentially assumes that every second of interaction has the same average information flow intensity. Something additional that can be done is to apply some kind of fudge factor to media interaction time periods, which accounts for a certain 'percentage of inattention' (Pool, 1983, p. 610). This suggests distinguishing between a gross rate of human consumption and a net rate of effective cognitive consumption (see Figure 1). In reality, data sources on the question of attention are scarce and ambiguous, which makes this distinction dubious in practice.
Depending on the focus of specific definitions, resulting numbers vary. For example, according to the numbers of Hilbert and López (2012a), if all Internet subscriptions would run at the potential bandwidth promised by Internet network providers for 24 hours a day, the world would need a network infrastructure that could carry 13.6 zettabytes in 2007. At the same time, people report using or consuming the Internet for 1.6 hours a day on average, which reduces this potential to 907 exabytes of gross media consumption (13,600*1.6/24). Comparing the numbers reported by Odlyzko (2010) and Cisco Systems (2008) about the existing Internet backbone infrastructure that effectively carries information, which is some 68 exabytes, it results that the average user only uses its promised full bandwidth for effectively nine minutes a day. During the remaining 87 minutes of the session, the screen is open, but no telecommunication takes place through the modem.
Unit of measurement
Besides the question of conceptualisation, there is also the question of the scale of measurement. Usually researchers estimate the number of technological devices, classify these devices into different kinds of device families, and then multiply each kind of device with a respective average performance indicator in a chosen unit that represents information. An alternative approach tracks the amount of US dollars spent into the technological infrastructure (instead of tracking the number of devices), and then multiplies the respective spending category with an information performance indicator of a certain unit (Short, Bohn and Baru; 2011).
The first variable that defines the measurement unit is the focus on stocks (information in space), on flows (information per unit), or on some kind of information process (which can refer to some metric that measures information processes in space and time, such as instructions (MIPS) or operation (FLOPS)) (see Table 2).
The pioneering Information Flow Census of Japan's Ministry of Posts and Telecommunications (MPT) from the 1970s and early 1980s (Ito, 1981) initially chose uncompressed binary digits as the unit of measurement. However, they felt that the results did not sufficiently recognise the contribution of text, in relation to data-intensive images and voice, so they decided to introduce the measure of 'amounts of words' as the unifying unit. This was effectively implemented by the use of conversion rates that assumed that a minute of speech over radio or a telephone line was equal to 120 words, a picture on a fax machine was equal to 80 words a page, and TV provided 1,320 words a minute ( see also Duff, 2000).
Bohn and Short (2009) and Short (2013) have undertaken the effort to present information consumption and in different informational units, namely bits, words and amounts of time. Bohn and Short found that in 2008 Americans consumed about 1.3 trillion hours of information outside of work, which totalled 3.6 zettabytes, corresponding to the informational equivalent of 1,080 trillion words. The comparison of the resulting numbers led to interesting insights. Video sources (moving pictures) dominate bytes of information (i.e., from television and computer games). If hours or words are used as the measurement, information sources are more widely distributed, with substantial amounts from radio, Internet browsing, and others. This high number of bytes contained in video begs the question of the value of information, i.e., in comparison to the information stemming from radio and Internet (more weight in terms of words).
| Supply or creation | ||||
|---|---|---|---|---|
| Storage or stocks | Communication or flows | Computation or processes | ||
| Demand or consumption | Technical information or metric | Bits (compressed) | Bits (compressed) Time | Instructions per second (MIPS; FLOPS); bits of output |
| Concepts | Words | Words and time | Tasks (?) | |
| Time | — | Time | O-notation (?) | |
Geographical scope
As shown in Table 1, these kinds of inventories either focus on a global aggregate level, or on a specific country or region (such as the U.S., Japan, Hungary, or Europe). The reason in more practical than methodological and stems from the availability of reliable statistics. For some technologies, such as for the estimation of Internet traffic, it is much easier to estimate the global aggregate capacity, while other statistics are only available for specific countries. To cover more countries, studies often make inferences on the basis of statistics from other countries. As subsequent studies have shown, such extrapolations have to be taken with a large grain of salt, since regional and national differences can be surprisingly large. For example, for the estimation of global telephone traffic, Lyman, Varian and collaborators (2003) follow the lead of Bounie (2003) in taking the number of minutes per line of France as a representation for the entire world (resulting in some 9.5 minutes per line a day). More detailed data became available later (ITU, 2010) and showed a global weighted average of some 18 minutes per installed line in the world, almost twice as much as the average of France (with more industrialised member countries of the OECD reaching a weighted average of some 21 minutes per line a day and less industrialised non-OECD countries reach some 7 minutes per line a day).
The increasing direct registration of digital information flows through the sampling of IP traffic (e.g., Cisco Systems, 2012) or the testing of broadband bandwidth can potentially provide more sustainable and more cost-effective solutions to capture aspects of this worldwide diversity. It is important to notice that related tracking of online usage around the world can go as far as employing illegal practices. One example is the study of Botnet (2012), an anonymous hacker who took over some 420,000 devices to conduct a swift Internet census as the captured routers pinged IP addresses and waited for answers. Another example is the polemic online tracking of the USA's National Security Agency, which publicly states that it touches about 1.6% of global Internet traffic, while selecting 0.025% for more detailed review (including content) (US National..., 2013, p. 6). While such extensive sampling provides a wealth of up-to-date information about magnitudes, usage patterns and specific content, it currently takes place in a legal and ethical grey zone with no clear definition of the proportionality and adequateness of means and ends.
Temporal scope
Time series are the key for understanding dynamics and therefore impact. Statistical scarcity is once again the main limitation here. Most studies with extensive reach and long time series (such as Dienes, 2010; or Hilbert and López, 2011) often take more detailed inventories in specific years and then extrapolate between them.
As always when working with time series, methodological consistency is of utmost importance. Even if the very unit of measurement is questioned, methodological consistency can still lead to important insights, since growth rates can reveal relative tendencies independently of the chosen unit of measurement. For example, while the early studies of Japan's Ministry of Posts and Telecommunications (MPT) (Ito, 1981) and of Ithiel de Sola Pool (1983) were criticised for their choice of indicator (focusing exclusively on text, translated in words, while excluding imagery and audio), these pioneering studies were able to show ground-breaking results with regard to the transitions from analogue mass media to electronic point-to-point media during the 1960s and 1970s, as well as the diverging trajectories of information provision and consumption.
Fine-grained distinctions
Besides presenting aggregate numbers as results of their inventory, all studies also include some differentiation among different kinds of technologies or users. The nature of this distinction brings us back to the particularity of the question on the researcher's mind.
For example, in the early 1980s, Pool (1983) was interested in the transition from mass communication (basically one-way information diffusion technologies), toward (what he called) point-to-point media (basically two-way communication technologies). He aimed to quantify the superiority of point-to-point in terms of cost-effectiveness and therefore the evolution from a broadcasting to a communication paradigm. Cisco Systems (2012) distinguishes between wired and wireless traffic and reports that in 2012 wired devices accounted for 59 % of global IP traffic. Other studies distinguish among the kind of content. Cisco Systems (2013) reports that in 2012 IP video traffic accounts for 60% of all IP traffic. While increasing shares of video content is often seen as one of the characteristics of the digital multimedia age, Hilbert (2014a) reports that the relative share of text actually captures a larger proportion of the two-way communication exchanges than before the digital age. In the late 1980s, most technologically mediated communication exchanges took place in form of voice exchanges (through the telephone) and text represented less than half percent of (optimally compressed) bits that flowed through global information channels in 1986 (in the form of postal letters, etc.). The share of alphanumeric data grew to almost 30% in 2007, a time when the Internet communicates vast amount of written information on the web and people exchange large text files and databases.
Dienes (1994) distinguishes between the kinds of societal sectors. He reports that 72% of the information goods and services output in the U.S. in 1990 is provided by corporations, 16% by households and 12% by governments. He also distinguishes between import and export of information goods and service and reports that the United States in 1990 imported 1.7 times more information than it exported.
In principle, there is no limitation to the kind of attribute that can be assigned to the information unit under analysis. In the fourth generation of their digital universe reports, Gantz and Reinsel (2012) became interested in the Big Data paradigm and asked about the share of the total amount that would be useful for informatics analysis. They report that in 2012 some 23% of the information in the digital universe would be useful for Big Data if it were tagged and ed, while in practice only 3% of the potentially useful data was tagged at that moment, and even less was analysed.
Discussion and limitation
One frequent critique of the kind of information quantification studies reviewed here is that they only address the question of 'how much?', which foregoes the question of 'meaning' or 'value'. It is important to emphasise that the main goal of the presented studies is the quantification of information, not a value judgment of the quality, impact or value of information. As such, many of the authors of those exercises even stress that the quantification of information does not necessarily say anything about the quality or value of this information.
One might say that the 'How much information?' question is an indispensable first question, while the 'How valuable?' is another, subsequent question. The assessment of quality or value of information requires the addition of supplementary variables. To quote Shannon's seminal 1948 paper: 'Frequently the messages have meaning; that is they refer to or are correlated according to some system with certain physical or conceptual entities' (Shannon, 1948, p. 379). This supplementary system allows defining a possible impact, the quality of the information or its value. By definition, concepts like impact of information, value of information or quality of information first of all require a metric for information (in the denominator) and then an additional metric for impact, value, or quality (in the numerator): {[unit of impact] / [unit of information]}; {[unit of value] / [unit of information]}, or {[quality / unit of information]}. To create indicators such as [US$ / bit], [growth / bit]; [attention / bit], or [pleasure / bit], one first of all needs to measure the denominator of the ratio: the amount of information. To test hypotheses about the value of information, we have to answer the 'How much information?' question first. Without normalisation on the quantity of information, we would helplessly confuse the effects of more information with those of better information. Only if the denominator is fixed, one can start to analyse which kind of the same amount is better, more impactful, or more valuable. In short, information quantity is not equal to information quality or information value, but the second requires the first. Future studies will be required to obtain insights into these additional aspects.
Conclusion
The article started by noticing different answers to the 'How much information?' question provided by different information inventories. These seem contradictory at first sight. By comparing the most important of these inventories, we found decisive differences in the research focus and subsequent methodological choices. Some inventories focus on the amount of information demanded by consumers, while others on information supplied by producers. Some inventories focus lump stored and communicated information into information consumption, while others distinguish between sources. Some focus on unique information, others on compressed information, and others on hardware capacity, among other differences. Differences in numbers are a reflection of different questions on the researchers' minds.
This leaves us with two possible future visions. On the one hand, we could argue that any methodological decision and any choice of metric will always be taken in response to a particular research focus and that the important and complementary results achieved so far are proof of the effectiveness of this plurality. It is therefore advisable to continue with a variety of approaches to quantify information stocks and flows. On the other hand, some of the authors of these studies suggest that it is desirable to work toward a harmonisation of the different methodologies through the creation of satellite accounts (Bounie and Gille, 2012), or even through the creation of a stand-alone System of National Information Accounts (SNIA) (Dienes, 2012). History has demonstrated that it is useful to set up an institutional mechanism to regularly collect important and influential indicators, and harmonised methodologies will certainly be required to do so. The above-mentioned Working Party on Indicators for the Information Society of the Organisation for Economic Co-operation and Development (OECD) is seen as a case in point in favour of this argument (OECD, 2011). The well-known drawback of institutionalised statistics is their inertia and one-size-fits-all mentality, which often leads to the creation of obsolete or meaningless indicators over time. To minimise this risk, it is advisable that methodological choices are very mature and solid before they are fed into the global statistical machinery (Hilbert, 2012b). This article is a contribution to the maturation of this field, be it for the goal of better understanding and celebrating the variety in approaches or for the goal of working toward a harmonisation of currently diverse approaches.
Acknowledgements
The author would like to thank Priscila López, Roger Bohn, Jim Short, Istvan Dienes, Russell Neuman, Elliot Panek and Andrew Odlyzko for insightful discussions.
About the author
Martin Hilbert is Associate Professor in the Department of Communication, University of California, Davis. He pursues a multidisciplinary approach to understanding the role of information and knowledge in complex social systems. He holds doctorates in Economics and Social Sciences and in Communication. Before joining UC Davis, he created and coordinated the Information Society Programme of United Nations Secretariat in Latin America and the Caribbean. He can be contacted at hilbert@ucdavis.edu