Information behaviour illustrated
Jenna Hartel
Faculty of Information, University of Toronto, 140 St. George Street, Toronto, Ontario M5S 3G6, Canada
Introduction
For an ongoing, arts-informed, visual research project about the nature of information, 293 original drawings of information have been collected from graduate students at a North American iSchool. The goals of the project are to better understand how people visualize information; whether patterns exist across different populations; and how these images relate to conceptions of information made of words. Each illustration has been made in black pen on a compact, 4" by 4" piece of white paper, coined an iSquare. To date, the images have been analyzed to discover how information is rendered as a drawing (Hartel, 2014a; 2013a, 2013b, 2012). It has been established that people construe information as pictures, link diagrams, grouping diagrams and symbols, among other types of graphic representations (Engelhardt, 2002) suggesting a complex multi-dimensionality. Parallel to the research, the pedagogical benefits of drawing information in the classroom have been realized (Hartel, 2014b; 2014c). The iSquare project has provided an accessible and inspiring alternative and complement to conceptions of information generated through the conventional, philosophical analytic approach that relies upon words alone.
Gazing across this collection of illustrations, attendees to the 2014 Information Seeking in Context conference would be delighted to see many human beings dealing with information, the phrase Savolainen (2008) uses as a catch-all for information behaviour, information activity and information practice. (For simplicity, the term information behaviour will be used, broadly construed, in this paper.) The fusion of information and information behaviour on the ibSquares also reflects Buckland's (1991) insight that information can be both noun and verb; as a noun it is information-as-thing and as a verb (enacted by people) it is information-as-process or information processing.
To explore the intriguing confluence of information and information behaviour in the drawings, the study at hand analyzes the iSquares for what they may reveal about information behaviour. The Information Seeking in Context conference seems the ideal venue to entertain a fresh perspective on information behaviour as generated through arts-informed, visual research. The intent is to answer these questions: What can drawings of information suggest about information behaviour? What role can images of this kind play in information behaviour research?
Theoretical framework: arts-informed visual research
As an example of arts-informed methodology (Cole and Knowles, 2008), this research project combined the systematic and rigorous features of qualitative methodologies with the artistic and imaginative qualities of the arts. Picasso captured the synergy of the crossroads when he said, 'I never made a painting as a work of art, it's all research'. Arts-informed methodology sanctions unconventional modes of inquiry as research, such as poetry, literary prose, playwriting, visual arts, dance and music.
The study is also an instance of visual methods (Prosser and Loxley, 2008) that rely upon images as evidence, rather than words or numbers alone. Weber (2008) states three compelling reasons to tap the visual realm: Images can be used to capture the ineffable, the hard-to-put into words; images can be used to communicate more holistically, incorporating multiple layers and evoking stories or questions; and, images can be more accessible than most forms of academic discourse. The field of information science and its information behaviour specialty can only benefit from more nuanced, holistic, layered and accessible ways of knowing through images.
Both arts-informed methodology and visual approaches have been making their way into information research and the information behaviour community. The 2013 annual meeting of the American Society for Information Science and Technology featured a panel, "Exploring the Complexities of Information Practices through Arts-Based Research" (Given, O'Brien, Absar and Greyson, 2013). Visual approaches have been championed by several information behaviour scholars (Sonnenwald, 2005; Copeland and Agosto, 2012). These recent efforts to study information behaviour creatively continue the mission of pioneering ethnographer Elfreda Chatman (1996), who sought richer, deeper understandings of information behaviour.
Research method
Data were gathered by applying the draw-and-write technique (Pridmore and Bendelow, 1995). In the draw-and-write technique a researcher asks participants to draw something, followed by an interview, focus group or written questionnaire. Given the involvement of human subjects, the Office of Research Ethics at the University of Toronto approved the research design. Respondents were students pursuing a Master of Information or Master of Museum Studies degree, and aged from 22 to 58 years (most being between 24-32 years).
Two researchers visited the classroom for 15 minutes to oversee the data collection. For a consistent outcome, participants were given a black pen and a 4" by 4" square of white paper, the iSquare. They were then asked spontaneously to answer the question 'What is information?' in the form of a drawing, and on the back side of the paper to complete the phrase 'Information is…'. The 293 iSquares, gathered from several classes and collectively referred to as the iSquare corpus, can be seen in their entirety at the project website (www.iSquares.info).
Though the draw-and-write technique generates visual and textual data in tandem, the drawings on the front sides of the iSquares were deemed of greatest interest for the Information Seeking in Context conference, since few studies of information behaviour employ visual data. For this paper, the written responses to the phrase 'Information is…' on the back sides of the iSquares were placed aside, a methodological decision discussed further in Hartel (2014a).
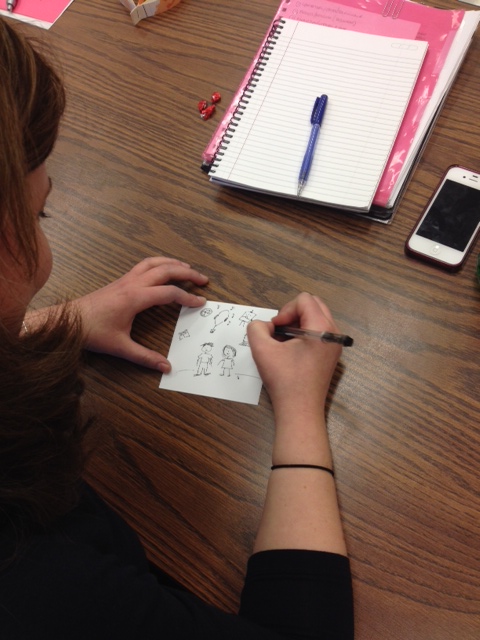
Figure 1: A student at the Faculty of Information, University of Toronto, participates in the study.
From iSquares to ibSquares
From the corpus of 293 iSquares, a preliminary step in the analysis process was to create a distinct sub-set of the data in which the drawings of information could be associated with information behaviour. Put differently, this meant re-casting iSquares as 'information behaviour squares' or 'ibSquares' due to their explicit features of interest to information behaviour scholars. To bring this special sub-set into sharper relief, it helps to first survey those iSquares that unequivocally come across as illustrations of information, not information behaviour.
Print artifacts
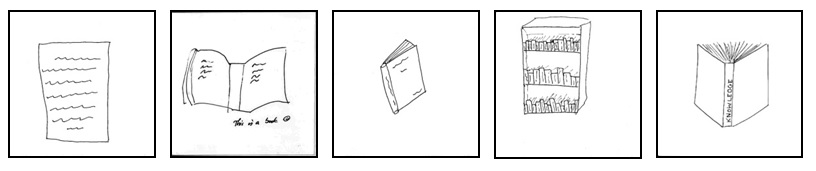
Figure 2: iSquares in which information is rendered as print artifacts.
Within the corpus there were many renderings of print artifacts (Figure 2), such as books and documents. They were usually expressed as singular items on the center of the page, but appeared as collections in bookcases, too. These visions of information reflect Buckland's (1991) information-as-thing, the longstanding material epicenter of information science, and also Dervin's notion (1983b) of information as objective, like a brick that can be put in a bucket. Methodologically speaking, students may have chosen print artifacts, in part, because they were relatively easy to draw.
Information technologies
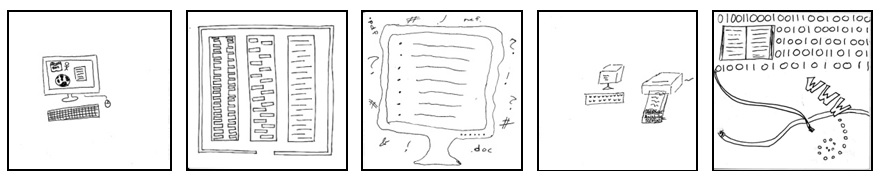
Figure 3: iSquares in which information is rendered as information technologies.
Numerous iSquares were devoted to information technologies (Figure 3). Most featured computer hardware, though a few displayed more intangible aspects of information systems, such as the Internet and file storage, which are harder to visualize. Information systems were central in the early history of information behaviour research when a systems perspective was dominant. Dervin and Nilan's landmark ARIS&T chapter (1986) was a call to action to shift attention off information systems and onto the user; hence these drawings of information technologies were not included in our special sub-set.
Abstractions and patterns
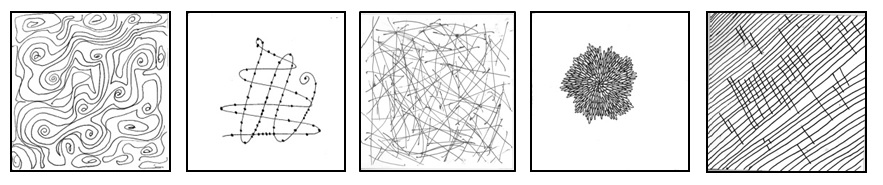
Figure 4: iSquares in which information is rendered as abstractions and patterns.
Many iSquares displayed abstractions and patterns (Figure 4). These markings brought to mind scientific and mathematical conceptions of information such as information theory, cybernetics, and Bates' preferred definition of information as, 'the pattern of organization of matter and energy' (Bates, 2005b). The beautiful drawings capture information at its most transcendental, scientific and monotonous, placing them beyond the human, practical, and everyday concerns of the information behaviour enterprise; hence these were not deemed ibSquares.
Symbols
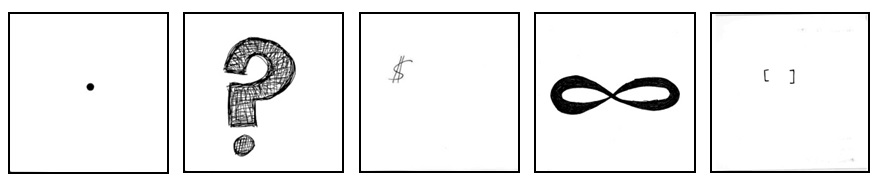
Figure 5: iSquares in which information is rendered as symbols.
The corpus also included a handful of symbols, like question marks or the infinity sign. These drawings were perhaps the most economical response from participants, for a few pen strokes generated powerful, though ambiguous, ideas. Surprisingly, no obvious symbol for information appears across the data set, suggesting information science lacks a succinct image at its epicenter. Like the patterned iSquares shown in Figure 4, these images were hard to relate precisely to the domain of information behaviour.
Nature
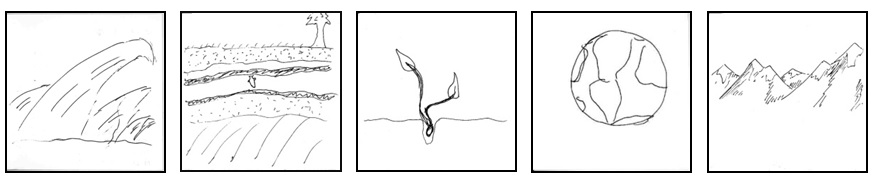
Figure 6: iSquares in which information is rendered as nature.
Some participants in the study invoked nature as a trope for information; several iSquares of this kind took the form of landscapes, such as a rough sea or serene mountain range. All capture the power, vastness and mystery of information but did not have immediate relevance to information behaviour.
Against these visions of information as print artifacts, technologies, abstractions, patterns, symbols and nature an ibSquare was operationalized as one that contains a human being or a visual synecdoche in which a part of a human being represents the whole. The presence of a person enabled the re-casting of the drawing and its associated idea from information to information behaviour. It seems almost too obvious to state that people are a qualifying and central marker of information behaviour scholarship and should characterize its visual vocabulary. The eminence of human beings is central to Bates' definition of information behaviour as 'the currently preferred term used to describe the many ways in which human beings interact with information, in particular, the ways in which people seek and utilize information' ([emphasis added] Bates, 2010, p. 2381). To sum up, in contrast with iSquares, ibSquares were anthropocentric, meaning, that they 'consider human beings the most significant entity of the universe' and 'interpret or regard the world in terms of human values and experiences' ("Anthropocentric", 2014). Of the 293 iSquares, 126 (43%) contained human beings or a body part and were therefore ibSquares.
Thematic analysis
Next, thematic analysis (Braun and Clarke, 2006) was performed upon the 126 ibSquares. Thematic analysis is a flexible qualitative method for identifying, analyzing and reporting patterns, called themes, within data. In thematic analysis epistemological assumptions must be made explicit at the outset, as follows. This study applied a deductive form of theoretical thematic analysis that viewed the ibSquares in light of major theories, concepts and trends of information behaviour research. The theoretical approach stands in contrast to inductive thematic analysis that aims to solicit indigenous themes from the data. Further, the drawings were seen in a realist or essentialist manner that embraced their surface reality, rather than their socially-constructed, latent or metaphorical meanings. From this deductive and realist epistemological stance, the analysis process entailed: 1.) Familiarizing oneself with the data, 2.) Generating initial codes, 3.) Searching for themes, 4.) Reviewing themes, 5.) Defining and naming themes, and 6.) Producing the report.
Results
Despite their common humanity, the 126 ibSquares were actually quite diverse. The human beings engaged in information behaviour were represented as whole bodies or, more often, in synecdoche as hands, brains, faces, heads, or busts. The drawings ranged from simple smiley faces or stick figures to artful and expressive portraits. People appeared solo, in dyads, or as groups. The actors were on the sidelines or stood front and center. The figure(s) occupied a stark canvas or inhabited a cluttered information environment. Upon applying the thematic analysis process, themes were identified. The themes and their associations with information behaviour are surveyed next.
The hand(s)
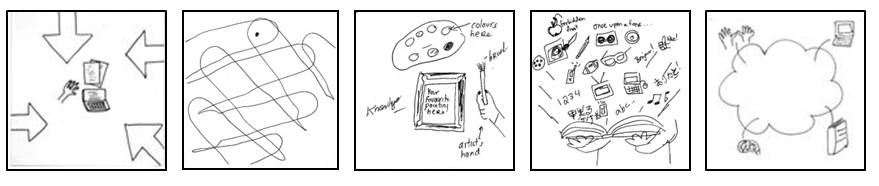
Figure 7: Appearances of the hand(s) in the ibSquares.
Several of the drawings represented a person through hand(s). This may be expected since, 'The hand has played a part in the creative life of every known society, and it has come to be symbolic or representative of the whole person in art, in drama, and in the dance' (Alpenfels, 1955, p. 4). For example, in one ibSquare a hand with a paintbrush is poised to create a work of art and in another the hands carry a wide-open book of multimedia information resources. In all cases the hand(s) animate the ibSquare with vitality and suggest engagement with the material world. From the annals of information behaviour, this reflects the role of action in Kuhlthau's information search process (1988), such as taking a book off a library shelf. These ibSquares also channel Buckland's information processing, that is, the handling of information that is tangible (1991). More recently, Hektor (2001) has used the phrase information activity instead of information behaviour, to emphasize the physical manipulation of information as done with the hand(s). Alpenfels continues, 'The hands are the organs of the body which, except for the face, have been used most often in the various art forms to express human feeling' (1955, p. 14). While emotions did not appear to run particularly deep in these ibSquares, the hand(s) effectively channel ability and agency on a material plane.
The brain
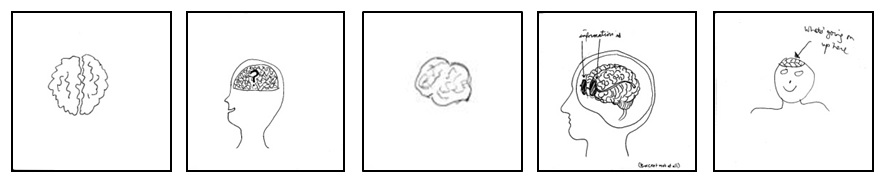
Figure 8: Appearances of the brain in the ibSquares.
Another recurring motif was the brain. Uniformly, these entailed a roundish, lumpy cerebral cortex with symmetrical hemispheres and distinct, variegated folds. The brain is the physical structure considered to be the site of the mind, consciousness and thought, which are likely the associations to information sought by the creators of these drawings. The preponderance of brains affirms information science's affiliation with cognitive science, cognitive psychology and neuroscience. They are reminders, too, that information behaviour research treats the brain as a black box; we do not pursue anatomical and physiological explanations for information phenomena. Yet these ibSquares point to a nascent frontier in our specialty. Emergent techniques of brain imaging might someday afford a new perspective on information behaviour. Imagine, for a moment, seeing colorful, real-time images of the brain as a research subject searches for and uses information, revealing relationships and patterns not detected before.
A person thinking
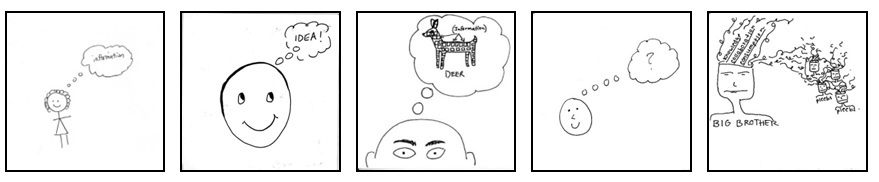
Figure 9: Appearances of a person thinking in the ibSquares.
Numerous ibSquares harbored a person thinking. Two graphic sub-objects dominated the simple compositions: a head and its thought bubble. The latter is a convention used in comic books and cartoons to display an actor's subjective thoughts. What is on the mind of the figures varied: information, an idea! and ? to name a few contemplations.
These ibSquares of a person thinking reflect the cognitive viewpoint in information science and information behaviour. Anchored in Brookes' (1980) fundamental equation of information science [K (S) +ΔI = K (S +ΔS)] in which information produces a change in a knowledge structure, the cognitive perspective centers information phenomena in the mind. The same idea is captured in Buckland's information-as-process (1991), which is 'When someone is informed, what they know has changed' (p. 351). In the cognitive tradition, Belkin (1980) generated important subjective concepts such as the anomalous state of knowledge (ASK) as the driver for information seeking. An example of the cognitive approach to information behaviour research is Todd's (1999) study of how girls' understanding changes as they process drug information. (If Todd were to turn his research on girls into a comic book, it might resemble this batch of ibSquares.)
Like the brains in Figure 8, the actors appear alone on the page, devoid of sociality and context. Nothing exists in the surroundings to influence what is happening inside the head. This chronic individualism and mentalism is the crux of the critique of the cognitive perspective that emerged in the 1990s (Frohmann, 1992) and that continues today (Day, 2011).
Unlike the more sterile brain ibSquares (Figure 8) the portraits in Figure 9 convey feeling and personality, with wide-open eyes and sometimes a charming smile. Whether happy, ambivalent, or sad, they confirm Kuhlthau's (1988) insight that affect is an important element of the information experience. That the majority of mouths were smiling also validates recent inquiry into information behaviours that are positive (Kari and Hartel, 2007), pleasurable (Fulton, 2009) and happy (Tinto, 2013).
An individual in a context
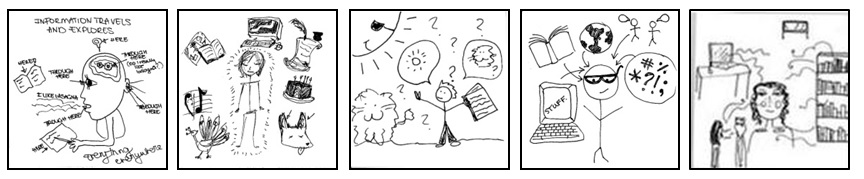
Figure 10: Appearances of an individual in a context in the ibSquares.
All the drawings in the ibSquare series of Figure 10 showed an individual in a context. The person stands front and center surrounded by his or her own thoughts and ideas, print information artifacts, media, information technologies, people, nature, culture and language. The compositions are dynamic, with lines and arrows connecting graphic sub-objects to suggest a process, influence or transformation.
On account of the assemblage of things surrounding each figure, these ibSquares reflect the theme of the Information Seeking in Context conference, context. Context is a disputed term with many interpretations (Dervin, 1996). Here, context comes across as objectified, an approach that identifies the entities that impact information behaviour in any situation (Talja, Keso and Pietiläinen, 1999). These ibSquares do not capture context in its most fulsome expression, which might include epistemological, social, cultural, historical and temporal elements. Indeed, the context shown here is quite generic. A less felicitous but more precise banner for this set would be 'An Individual in an Objectified Generic Context'.
By visualizing a person in a situation, these ibSquares expose the matter of space, an important contextual factor in information behaviour research. Savolainen (2006) asserts that spatial factors in studies of information seeking have been addressed in an objective, realist-pragmatic and perspectivist manner. The ibSquares that place the actor on the ground or in a room reflect the objectifying approach which entails an actual geography and its barriers or enablers to information access. Those that treat space as a subjective realm in the actor's mind are the perspectivist approach. The latter, perspectivist view is a hallmark of Sonnenwald's information horizon (2005) and these ibSquares resemble the diagrams produced during the information horizon interview process.
A twosome in information exchange
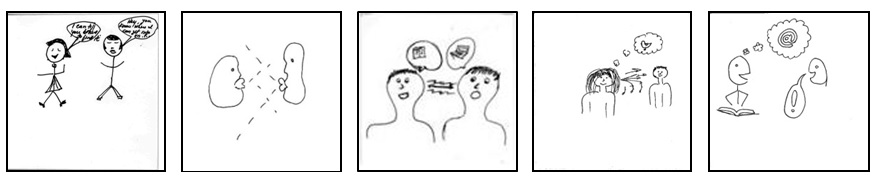
Figure 11: Appearances of a twosome in information exchange in the ibSquares.
Another common picture manifestation was a twosome engaged in information exchange. On these cartoony ibSquares, partners face each other in conversation via speech bubbles or through messages that manifest as arrows or lines. Ironically, their mouths are opened wide for speaking though most figures lacked ears for listening. The substance of the conversations is not apparent, except one which captures a reference interview. A man says, 'Hey...do you know where I can get info on...' and a woman (perhaps a librarian in a neat skirt and sensible shoes), responds, 'I can tell you where to find it'.
These ibSquares depict an information activity that Hektor (2001) calls information exchange. It entails the bi-directional acts of dressing (expressing information) and unfolding (experiencing information) in an ongoing reciprocal process. Reciprocity is underscored in the drawings by evenly distributed thought bubbles or an arrow with two heads. Another apt term for what appears is information sharing and the vigor of the figures suggests they may be super-sharers (Talja, 2002). These ibSquares are not placed under the banner of communication, which implies mass communication, a topic not usually broached in information behaviour research.
A different interpretation is that the twosome is experiencing an information ground (Pettigrew, 1999), that is, an environment where people come together for one reason but end up socializing and sharing information spontaneously. Information grounds bring attention to locations, such as waiting rooms, hair salons and other unexpected places where they occur. However, no spatial or geographic clues exist on the drawings, so these glimpses of information grounds are incomplete.
ibSquares that show people chatting highlight the role of language and reflect a discursive perspective on information behaviour, as well. Discursive approaches view information phenomena as embedded in cultural, social, or organizational practices that reside in discourses (Talja and McKenzie, 2007). Champions of discursive approaches have argued that conversations, not information, should be the central concept in information science (Tuominen, Talja and Savolainen, 2003); the ibSquares in Figure 11 advertise that very idea.
An information-rich social world
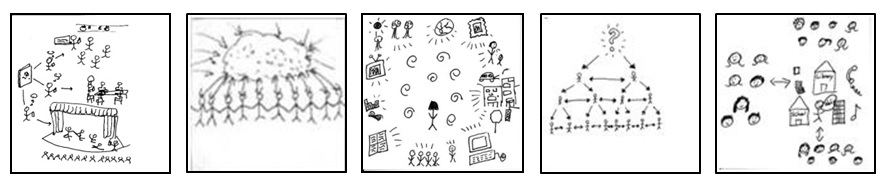
Figure 12: Appearances of an information-rich social world in the ibSquares.
A final visual motif within the ibSquare collection showed an information-rich social world (Strauss, 1978). People were numerous and appear as tiny faces or stick figures, resembling a colony of insects. In different ways the actors are placed in relation to information phenomena such as information technology, information resources and information institutions. Arrows and lines connect the graphic sub-objects, suggesting an iterative flow between the entities.
Different social groupings appeared in these ibSquares. Some bore the markers of a town or city, with a library and school at the center. One took the form of a hierarchical organizational chart, suggesting a workplace. A few were quite abstract and may have referred to the entirety of humanity. Only one ibSquare in this set illustrated an identifiable social world, a theatre troupe, which is also a powerful metaphor for social life (Goffman, 1956).
The ibSquares in Figure 12 construe information behaviour as embedded in community, reflecting a long-standing social approach to information behaviour that takes a group as the unit of analysis. The first textbook of library and information science established the relevance of sociality in a chapter entitled 'The Sociological Problem' (Butler, 1933). Early studies of scientific communication by Menzel (1959) focused on scientific disciplines and there have since been research on marginalized populations (Chatman, 1996), youth (Agosto and Hughes-Hassell, 2006), the elderly (Williamson, 1997) and hobbies (Hartel, 2003; 2010), among sundry collectives. The metatheories that guide this line of research are known as collectivism (Talja, Tuominen and Savolainen, 2005), domain analysis (Hjørland and Albrechtsen, 1995), or socio-cognitivism (Jacob and Shaw, 1998). In a current climate that favors more precise terminology, information behaviour within communities is referred to as information practice (Savolainen, 2008; McKenzie, 2003), and it is suggested in these ibSquares.
Discussion
To review, of 293 original drawings of information gathered using the draw-and-write technique, 126 (43%) contain a whole or partial human being and can be re-cast as expressions of information behaviour, or ibSquares. By applying thematic analysis to the ibSquares, recurring visual motifs were identified as: the hand(s), the brain, a person thinking, an individual in a context, a twosome in information exchange and an information-rich social world. The themes can be linked to tenets of information behaviour. In light of the results, the discussion that follows revisits the research questions of the study: What can drawings of information suggest about information behaviour? What role can images of this kind play in information behaviour research?
The outcome of this project suggests the importance and omnipresence of information behaviour in information science today. It is remarkable that almost half of a data set in which participants envisioned information can likewise be cast as information behaviour. Perhaps information behaviour is the unifying concept that lies at the epicenter of the broader field, more so than information itself. The confluence of information and information behaviour on the ibSquares is an invitation, of sorts, for information behaviour scholars to be more active in the theoretical debates concerning information. The oeuvres of Marcia J. Bates, Brenda Dervin, and Sanna Talja serve as inspiration and evidence that scholars who bridge information theory and information behaviour can make especially comprehensive and powerful contributions.
By focusing attention on the visual vocabulary of information behaviour research, the ibSquares set the stage for a critical visual analysis that 'takes images seriously...and thinks about the social conditions and effects of visual objects' (Rose, 2007, p. 15). To explain, for the past three decades findings in information behaviour have taken the form of models, that is, 'a tentative ideational structure used as a testing device' (Bates, 2005a, p. 2). Our specialty is indelibly marked by the serpentine berrypicking path (Bates, 1989) and the smiling Sense-maker who leaps over a gap on the time-space continuum (Dervin, 1983a), among other visualizations. These models have been surveyed for their contribution to the understanding of information phenomena (Wilson, 1999; Järvelin and Wilson, 2003) but they have not been problematized as representations themselves. This paper has not focused upon existing models such as berrypicking and Sense-making; rather, it has presented a different set of images in order to raise awareness of the visual discourse that permeates the information behaviour domain.
As was discovered with the iSquares (Hartel, 2014b, 2014c), the ibSquares have pedagogical applications, too. They can be useful as courses on information behaviour are becoming popular and required in some curriculums. When shown to students, these drawings of information behaviour can introduce an abstract topic, accommodate diverse learning styles and intelligences, complement the scholarly literature and seed lively classroom discussions. In this paper ibSquares have illustrated information activity, the cognitive viewpoint, context, information exchange, information ground, and many other fundamental lessons are possible. The most vigorous debate today — information behaviour versus information practice — can be engaged afresh through the drawings in Figures 9/10 and Figures 11/12, which are highly suggestive of each concept, respectively. In short, through the ibSquares we experience what Weber (2008) claims as the benefits of visual research, that is, 'Images can be used to capture the ineffable, the hard-to-put into words…and images can be more accessible than most forms of academic discourse'.
One limitation of the ibSquares and the visual medium must be noted. In all the drawings people are 'dealing with information' (Savolainen, 2008) and it is possible to infer informationactivity (Hektor, 2001) or information behaviour versus information practice (Savolainen, 2008; McKenzie, 2003) based upon the number of figures present. Otherwise, it is difficult to say with more precision just what is being done with information in each drawing. Using words, Hektor (2001) has characterized eight information activities of search and retrieve, browse, monitor, unfold, exchange, dress, instruct, and publish. In most ibSquares a viewer cannot distinguish among these distinct information activities. Unfortunately, there may never be a visual classification system for information behaviour at its most granular. Scholars of information behaviour can only envy other realms of human experience, such as Olympic sports, that can be displayed in neat, distinctive pictograms, as in Figure 13.
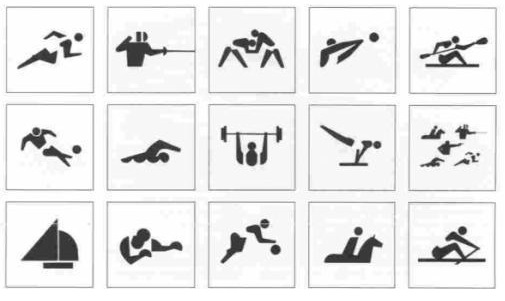
Figure 13: A sample of the pictograms for various sports of the summer Olympics. Unfortunately, specific information activities are not so easy to represent.
Conclusion
This study is one of the first applications of arts-informed, visual methods in information behaviour research and hopefully will not be the last. Many other research designs and questions can build upon the iSquare and ibSquares work. For example, whereas the data set at hand originally targeted "information", the draw-and-write technique could explore information behaviour directly by asking people to draw themselves "dealing with information" (Savolainen, 2008) and then commenting in words upon the matter. Alternatively, new insights could be gleaned about information behaviour in different contexts through comparative draw-and-write studies among different populations, following the tradition of socially-oriented information behaviour scholarship.
Arts-informed, visual methods also aim to stimulate the imagination, especially via unconventional formats that invite participation. Therefore, an exhibition of the 126 ibSquares accompanies this paper to enliven the venue of 2014 Information Seeking in Context conference. The sprawling, eclectic array of ibSquares should make a memorable impression. The installation is interactive; adjacent to the display is a table where people can draw, write, and talk about information phenomena.
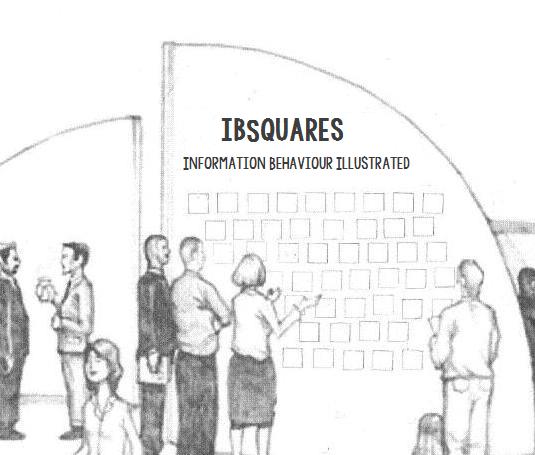
Figure 14: The author's rendering of the ibSquare exhibition at the 2014 Information Seeking in Context conference.
Acknowledgements
Thanks to all students in my Winter 2014 course, INF2332: Information Behaviour, at the Faculty of Information, University of Toronto. Our learning experience together inspired this paper. Thanks also to: research assistants Karen Pollock and Rebecca Noone; proofreader Stephanie Power; HTML expert Ashleigh Burnet; and the anonymous reviewers who offered ideas to improve the manuscript.