Vol. 12 No. 4, October, 2007
Vol. 12 No. 4, October, 2007 | ||||
Electronic government (e-Government), which refers to governments' use of information and communication technology to exchange information and services with citizens, businesses, and other arms of government, is often regarded as the new way forward for the public sector. According to the UN report on global e-Government readiness, "An increasing number of e-Government initiatives are being employed to improve the delivery of public services to the people, and to tap the potential synergy from the interaction between new technologies, an educated population and an enabling environment for the attainment of knowledge-based economies.( UN,2004). e-Government may be applied by the legislature, judiciary, or bureaucracy, in order to improve internal efficiency, the delivery of public services, or processes of democratic governance. Even though there are various service opportunities in e-Government, information publication via the Webis one of the main services, which enables people to access high quality information that was not accessible in the past. West (2004) reported that 89 percent of websites in 2004 provided access to publications and 62 percent had links to databases.
However, it is very difficult to ensure the accuracy and currency of all Webpublications manually because the Webuses a passive information delivery mechanism, called pull technology. In this case, people should visit the publication Websites to acquire new information, but this is a time consuming and uncertain process because there are too many Websites that are usually maintained by different departments and agencies. Nowadays Websites can send new information to subscribed users by using e-mail or more sophisticated methods such as RSS (Really Simple Syndication), but this is not provided by all Websites because of financial or technical limits.
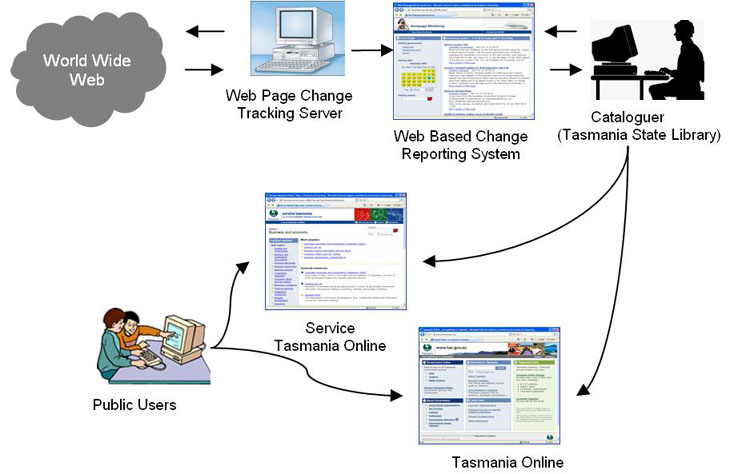
This project was motivated by the Web information integration of federal, state and local government Websites. The State Library of Tasmania (SLT) operates two Websites to provide integrated government information. Tasmania Online (www.tas.gov.au) is a portal of Tasmania business, community and government Websites. The aim of Service Tasmania Online (www.service.tas.gov.au) is to provide flexible access to a wide range of resources on the Webprimarily for the state government, but also for federal and local government. Additional information on Service Tasmania Online is available at http://www.service.tas.gov.au/ stabout/stabout.asp.
We proposed a monitoring system that continuously monitors new and changed content on selected federal, state and local government Web pages. The system provides two key services, one monitoring home pages and the other media release pages. This complements the indexing and description of those sites on Service Tasmania Online and Tasmania Online as the SLT must continuously monitor the Websites to ensure the accuracy and currency of the information provided. This process - conducted manually before we proposed this project - was a time consuming repetitive and routine task. SLT cataloguers were also required prior knowledge of the content of the monitored Websites. The Web monitoring system both saves staff time and removes a large component of a repetitive and routine task, and ensures the timely delivery of new and changed Webcontent in one access point to the SLT cataloguers.
This paper consists of the following contents: Section 2 summarizes related research on government Web information integration. Section 3 explains our Web monitoring system implementation details. Section 4 summarizes basic workflow and benefits. Section 5 summarizes Web monitoring and usage results. Conclusions and further studies are discussed in Section 6.
Providing access to government information is the most common e-Government initiative. Many governments have tried to vastly increase the number of interactions and to provide large amounts of online information for efficiency, better services to citizens and improved governmental processes. There are many benefits both for the public and for government of this kind of service: reducing distribution costs for government agencies, ensuring 24/7 access to information, removing the delay between production of and access to information, and more timely update of material.(Pardo,2000) A significant proportion of total Web information comes from governments because they provide large amounts of information via their Websites to exploit the above benefits (Wagner et al.).
Integration of government Web information is a significant problem, because it is created by different departments and agencies, and people cannot access all Websites to find relevant information from the government Websites. Governments have used several technologies to provide useful information to citizens through the web, such as portals(Wimer,2001), content management systems, e-mail broadcasting and list serves or discussion forums. All these solutions can help to disseminate and exchange information, but each has its own strengths and weaknesses. However these approaches are limited in their ability to provide an automatic timely and integrated information service. In fact, The realization of the full potential of e-Government depends on the same goals that government agencies have been pursuing for many years: true horizontal and vertical integration of services" ( Pardo,2000).
Some researchers used Semantic Webtechnology to integrate government Web information in the semantic level (Wagner et al., 2006, Drumm, 2006, Gugliotta, 2005). The Semantic Webaims to facilitate semantic interoperability and integration by using XML based machine-processible information (McIlraith, 2001). Although the Semantic Webis regarded as the future of the current web, there are some limitations because large parts of legacy systems do not support a Semantic Webservice. It is not easy to transform legacy information into Semantic Webserviceable information even though some middleware can help legacy systems to provide a Semantic Webservice. We did not use Semantic Webtechnology for this project because our aim is to provide Web information integration without changing legacy systems or information or adding any additional middleware to the existing systems.
Timely Web information integration can be accomplished by the Web monitoring technique. Web monitoring systems/services collect new information from selected Websites by continually revisiting these sites. By doing this they can obtain new information in real-time. There are other systems that support real-time information dissemination. Nowadays XML based RSS services are prevalently used to serve real-time information provision (Powers,2005). People can get new information by registering RSS service URLs, called feeds, to the RSS aggregator systems. However, these systems/services have limitations because they only work when the service Websites provide XML based RSS services. In comparison with an XML based RSS service, the most significant benefit of the Web monitoring method is that we can obtain information in real-time without changing current Webcontents. The Web monitoring system has been researched since the beginning of the Web (Pandy et al., 2004, Liu et al., 2000, Tan, 2002) and nowadays the following Web monitoring systems or services are available:
| Service/Product Name | URL |
|---|---|
| WatchThatPage | http://www.watchthatpage.com |
| Wisdomchange | http://www.wisdomchange.com |
| ChangeDetection | http://www.changedetection.com |
| ChangeDetect | http://www.changedetect.com |
| Track Engine | http://www.trackengine.com |
| Copernic Tracker | http://www.copernic.comen/products/tracker |
| WebsiteWatcher | http://aignes.com |
Although these systems and services are available, there is no significant large scale research that focuses on the Web information integration of government Websites. In this research, we focus on this issue and report operation results of 248 Websites over 1.5 years.
We developed a Web information monitoring system to collect newly uploaded publications from selected Web pages. The system monitors specific Web pages that consist of various objects such as text, hyperlink, and images. Hyperlinks are the most important object among them, because they are usually linked to the specific Web document. A hyperlink consists of link text that is located between <a> and </a> tag and a URL that indicates the location of a specific document (linked content).
The system works as follows. The system sends an HTTP request message to the Web server of the registered Web page according to the fixed revisit time (Trevisit). The revisiting time (Trevisit) is affected by the publication frequency of the source pages and the user's need for information. If the publication frequency is high, Trevisit should decrease otherwise increase. If the user wants to get information as soon as possible, Trevisit should decrease otherwise increase. As we had no prior information about the publication patterns of the selected domains, we employed a single fixed scheduling strategy. We set the revisit time (Trevisit) as 2 hours for all the Web information source pages.
When the system receives an HTTP response message from the server, the system extracts URLs and their link texts from the HTTP response body (Hc) and compares them with those of the last HTTP response body (Hp).
Hc and Hp are defined as follows
Hc = {(Ui,Ti)} , where Hc is a set of URLs and link texts of the current HTTP response message body. (Ui,Ti) is the ith pair of hyperlink and link text of a hyperlink.
Hp = {(Uj,Tj)} , where Hp is a set of URLs and link texts of the last HTTP response message body. (Uj,Tj) is the jth pair of URL and link text of a hyperlink.
Newly updated information is In = Hc - Hp
For more clarity, we would like to indicate the following things. Firstly, according to this definition, if the URL or link text is changed, it is regarded as new information. However, this approach cannot detect new information when the URL and the link text are not changed, but the linked content has changed. Although this limitation may cause under-detecting of new information, we employed this approach to save cost. Secondly, we excluded URLs that contain session id in the URL path. When a URL contains session id, it is detected as new information whenever the monitoring system requests the Web pages, because session id is created on the fly and therefore the URL is continually changed. Thirdly, we eliminated some URLs from the new URLs by registering filtering URLs. For example, advertising URLs are collected as new information, but our URL filter (Hf) eliminates these URLs before they are recorded in the database. Lastly, we excluded URLs that were already recorded in the database. Some URLs may have been harvested already before the last session (He). For example, a URL is collected during the first monitoring session and disappears in the second session, and reappears in the third session. In this case the URL is regarded as new information at the third session according to the above definition. Therefore, the system checks if a new URL already exists in the database, and it is only recorded in the database if it is not already listed there. New information is redefined as follows:
In = Hc - Hp - Hf- He
We did not use data that was collected from the first session, because they included the navigational information as well as old information that was published before monitoring was started.
Government Web information integration workflow with a Web monitoring system is summarized in Figure 1. The system automatically identifies new information on the selected federal, state and local government Web pages, and they are reported to the SLT cataloguers via the Webbased change reporting system, which reports new information in real time. The cataloguers need to review the records in the tracking reporting service and identify which records need follow up and adding to the Service Tasmania Online and Tasmania Online Websites. Public users can access new information from these two Websites.
The SLT reported the following benefits of using our system and applying the new workflow.
We have been monitoring 249 federal, state and local government Websites for the Web information integration since July 2005. Monitoring Websites consist of federal government homepages (21 sites, 8%), federal government media release pages (108 sites, 44%), Tasmanian government homepages (73 sites, 30%), Tasmanian government media release pages (16 sites, 6%), and Tasmanian local government homepages (31, 12%) as illustrated in Figure 2 (a). At first we started with 112 Websites, but we gradually added additional Websites as requested by the SLT (Figure 2 (b)).
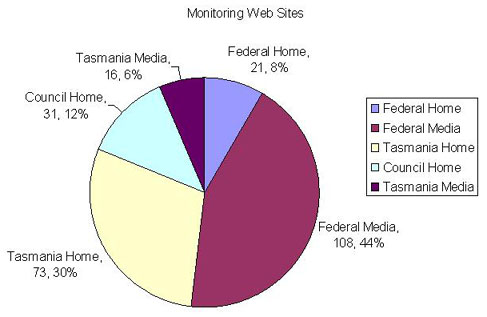
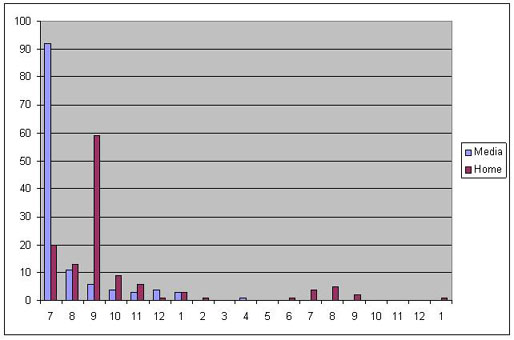
Figure 3 summarizes overall monitoring results from July 2005 to January 2007. As seen in Figure 3 (a), the most prolific domain is federal media release pages (16,075 documents, 51%). This is followed by Tasmanian government homepages (6,288 documents, 20%), Tasmanian government media release pages (4,673 documents, 15%), federal government homepages (3,243 documents, 10%), and local council homepages (1,493 documents, 5%).
Figure 3 (b) illustrates distribution of Web pages by monitoring result frequencies. The horizontal axis represents the level of collected documents of each Web page, the left vertical axis shows the number of monitoring sites of each domain in each publication level, and the right vertical axis represents the total number of collected documents in each level. Though the federal media release pages and Tasmanian government homepages are more prolific than Tasmanian government homepages (see Figure 3(a)), they have more monitoring results in the 100 publication level compared to that of the Tasmanian government media release pages. For this reason, the Tasmanian government media release pages, the third most prolific domain, shows the highest number in average documents per Web pages.
Figure 3(b) illustrates another fact. Even though the number of monitoring sites in the level of over 500 publication (500~) is smaller than that of other sites, they contribute large parts of the overall monitoring documents. That is, only a small number of Web pages contribute large parts of the total collected documents. This result means that we need to reconsider the monitoring scheduling strategy, because it implies that some new information checking sessions of the monitoring system is unnecessary. The scheduling time should be effectively changed according to the publication characteristics of the monitoring Websites to minimize the monitoring costs.
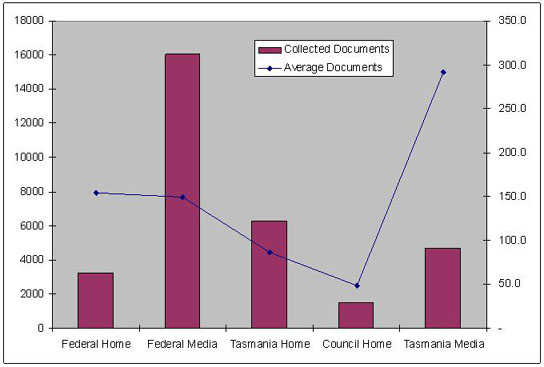
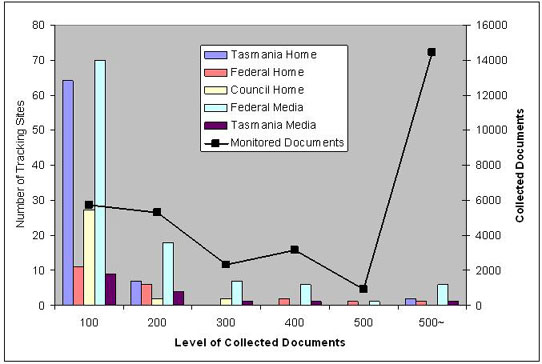
Figure 4 (a) illustrates monthly monitoring results by domains over the operation period. We need to consider the trends from September, 2005 since we added most Websites from September, 2005. First of all, we can see that the total of collected documents from May to December is greater than those from January to April. However, though there are significant drops in January, 2007, we can not conclude that this trend is stable, because we only reviewed about 1.5 years. This trend requires further investigation, although given the nature of government activity during the summer holiday period it is probable this trend will continue. The trend of the total monitoring results is similar to those of each domain. Especially the trend of the federal media releases represents high similarity. Figure 4 (b) illustrates monthly monitoring results by the collected documents frequency level. The result shows that the overall trend is closely related to that of the 500 ~ publication level.
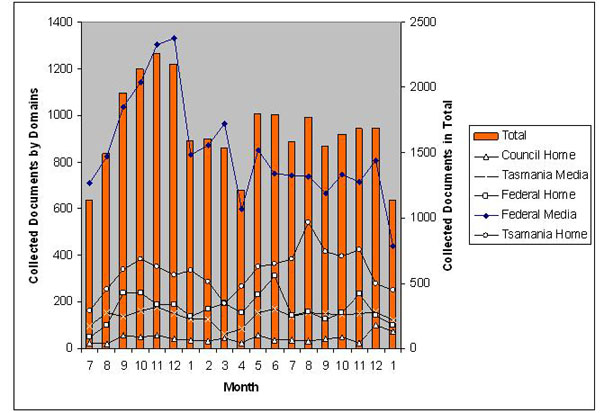
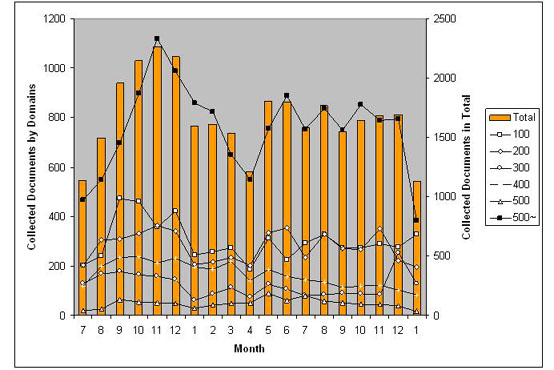
Figure 5. illustrates the weekly trend of the collected documents. Figure 5 (a) shows weekly trends by domains and Figure 5 (b) shows weekly trends by publication level. Not surprisingly, more documents are collected during working days, Monday to Friday. There are no significant differences among domains and different publication levels except the documents from the 500~ publication level indicates that they published more new information on Saturdays and Sundays than other level Websites. This result implies that we wasted computing resources to process unnecessary monitoring sessions in the current fixed monitoring scheduling strategy and we may use weekly variations to create a more dynamic scheduling strategy.
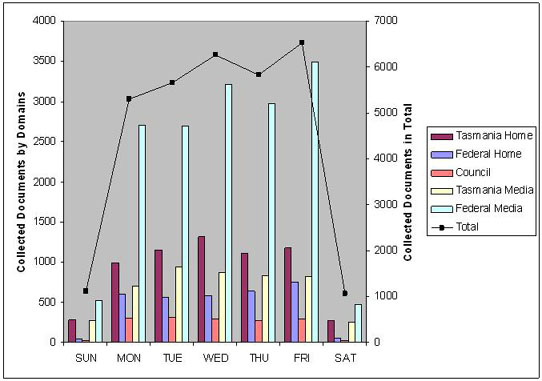
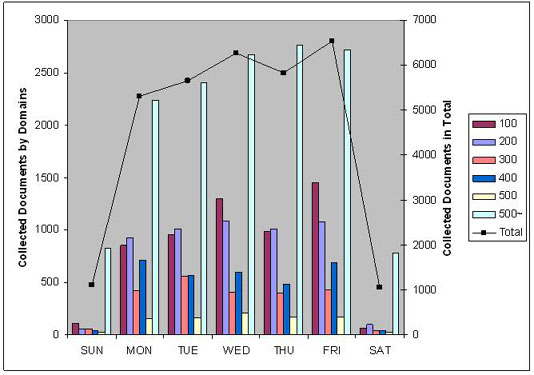
Figure 6 illustrates the daily trend of the collected documents. Figure 6 (a) compares daily trend by domains and Figure 6 (b) by publication levels. The results show that most documents were collected around working hours, from 9 am to 8 pm. There is no significant difference among domains and publication levels. Daily trend results also propose a further research on the scheduling strategy of our monitoring system because we wasted some resources for unnecessary monitoring sessions in a day and we may minimize monitoring cost by employing an appropriate scheduling strategy.
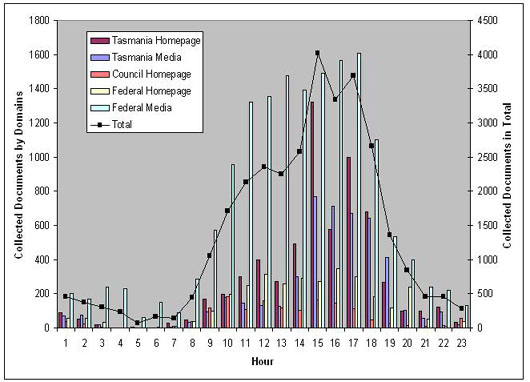
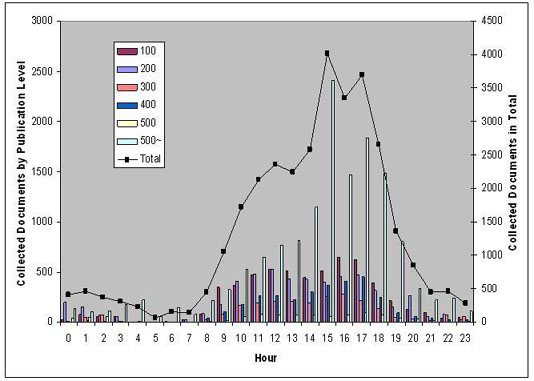
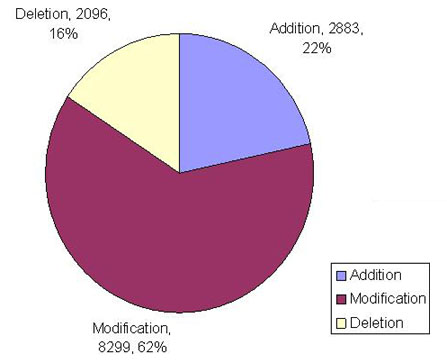
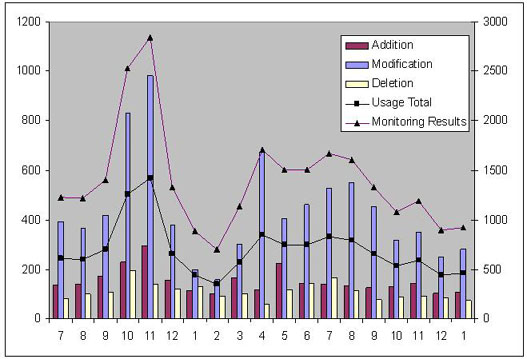
Figure 7 illustrates overall usage results and monthly trend, which is are reported by the SLT. According to their report, they used other sources such as newspapers and internal reports on Web pages changes to change Web information on the Service Tasmania Online and Tasmania Government Online. Therefore, the report on usage trends not exactly match with the total usages of monitoring results. However, we can draw trends of monitored document usage result under this assumption. Figure 7 (a) shows the overall usage statistics. Modification of the current Web information (62%) is the largest part of usage, which is followed by 'Addition' (22%) and 'Deletion* (16%). Figure 7(b) shows usage trend sin July, 2005. The result shows that overall usage trends very closely related to the monitoring results trends.
However, the SLT cataloguers reported that the number of documents from the monitoring system indexed directly on Tasmania Online and Service Tasmania Online is very small compared to the total number of monitored pages. This is not necessarily a problem for the SLT cataloguers as they wish to be alerted to new and changed content even though this content may not always be appropriate to be added to the Tasmania Online and Service Tasmania Online Websites. The cataloguers assess the monitored pages and make a professional judgement as to whether resources need to be added or updated on Tasmania Online and Service Tasmania Online. The SLT cataloguers continually review the URL seed list to remove redundant or unhelpful URLS. Some technical refinements may require investigation to improve the performance of the monitoring service. Possible refinements include the removal of duplicated resources and the elimination of noise with certain categories of updated information being excluded from monitoring. For example updated weather reports from monitored pages could be excluded.
Government Web information integration is an important issue in e-Government implementation. In this paper, we proposed a monitoring system based Web information integration method and reported 1.5 years operation results. This approach is very useful because it supports Web information integration without requiring any changes in the current system. Although our system successfully supported the Web information integration for the SLT, the following significant challenging issues were raised during the project. These issues will be the basis for further research. Firstly, we need to extend our scheduling system to minimize monitoring costs. We found that there were yearly, monthly, weekly, and daily variation patterns in the past data set. These patterns can be used to establish improved scheduling strategies. Secondly, we need to provide recommendation system that helps the SLT cataloguers. The current system only display the newly updated information from the target Websites and the cataloguers manually add, delete, or modify Web information on the Service Tasmania Online and the Tasmania Government Online. The further system should provide further recommendations such as addition, deletion, and modification with the monitored results.
This work was supported by the Asian Office of Aerospace Research and Development (AOARD) (AOARD-06-4006)
| Find other papers on this subject | ||
© the authors, 2007. Last updated: 18 August, 2007 |
|